What It Takes to Build a Great Graph
Knowledge representation in a networked world
You have probably seen or interacted with a graph whether you realize it or not. Our world is composed of relationships. Who we know, how we interact, how we transact — graphs structure information in a way that makes these inherent relationships explicit.
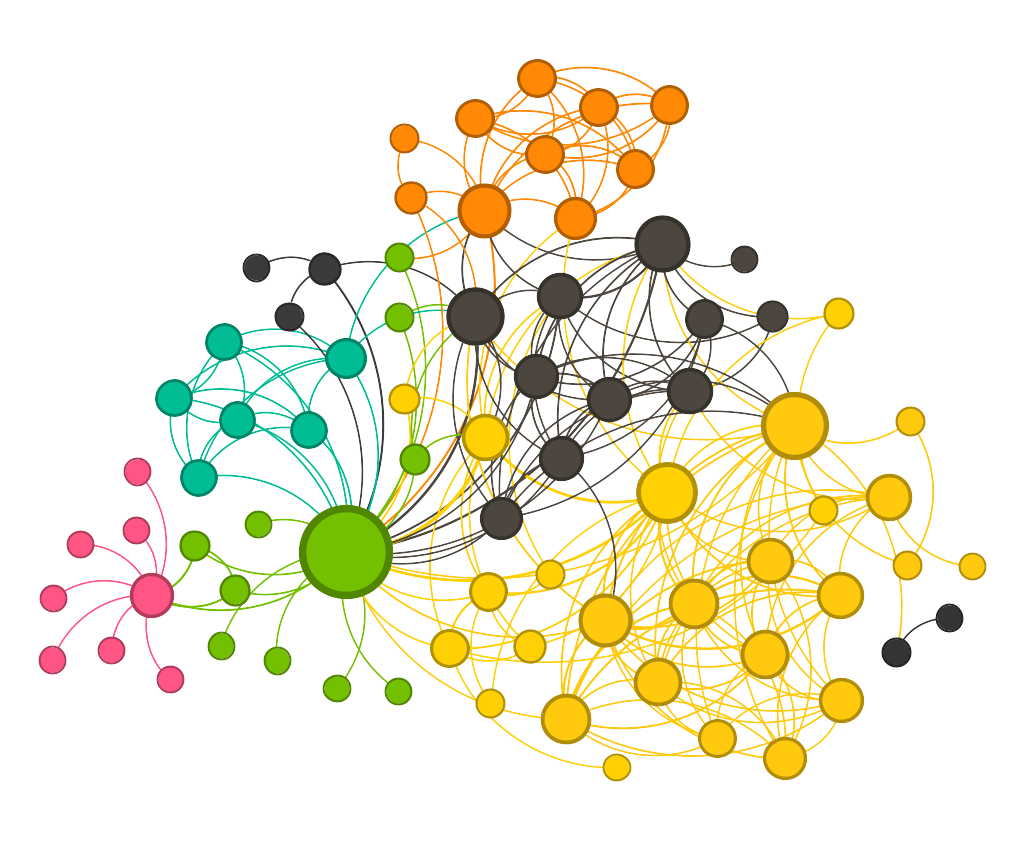
Analytically speaking, knowledge graphs provide the most intuitive means to synthesize and represent connections within and across datasets for analysis. A knowledge graph is a technical artifact “that presents data visually as entities and the relationships between them.” It gives an analyst a digital model of a problem. And it looks something like this…

This article discusses what makes a great graph and answers some common questions pertaining to their technical implementation.
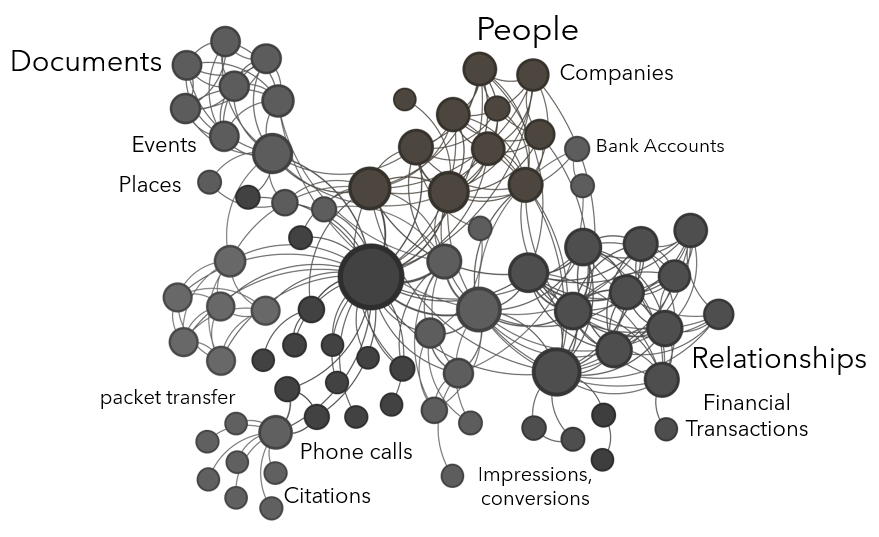
Graphs can represent almost anything where there is interaction or exchange. Entities (or nodes) can be people, companies, documents, geographic locations, bank accounts, crypto wallets, physical assets, etc. Edges (or links) can represent conversations, phone calls, e-mails, academic citations, network packet transfer, ad impressions and conversions, financial transactions, personal relationships, etc.

So what makes a great graph?
- The purpose of the graph is clear.
The domain of graph-based solutions includes an analytical environment (often powered by a graph database), graph analytic techniques, and graph visualization techniques. Graphs, like most analytic tools, require specific use cases. Graphs can be used to visualize connections within and across datasets, to discover latent connections, to simulate the dissemination of information or model contagion, to model network traffic or social behavior, to identify most influential actors in a social network, and many other use cases. Who is using the graph? What are these users trying to accomplish analytically and/or visually? Are they exploring an organization’s data? Are they answering specific questions? Are they analyzing, modeling, simulating, predicting? Understanding the use cases the graph-based solution needs to address is the first step to establishing the purpose of the graph and identifying the graph’s domain.
- The graph is domain-specific.
Probably the biggest mistake in implementing graph-based solutions is the attempt to create the master graph. One Graph to Rule Them All. In other words, all enterprise data in one graph. Graph is not a Master Data Management (MDM) solution nor is it a replacement for a data warehouse, even if the organization has a scalable graph database in place. The most successful graphs represent a given domain of analytic inquiry. For example, a financial intelligence graph may contain companies, beneficial ownership structures, financial transactions, financial institutions, and high net worth individuals. A pattern-of-life locational graph may contain high-volume signals data such as IP addresses and mobile phone data, alongside physical locations, technical assets, and individuals. Once a graph’s purpose and domain are clear, architects can move on to the data available and/or required to construct the graph.
- The graph has a clear schema.
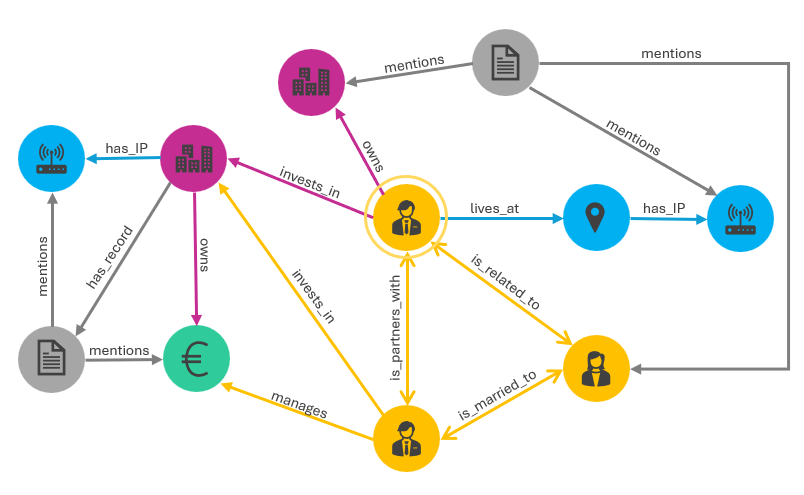
A graph that lives in a graph database will have a schema that dictates its structure. In other words, the schema will specify the types of entities that exist in the graph and the relationships that are permitted between them. One benefit of a graph database over other database types is that the schema is flexible and can be updated as new data, entities, and relationship types are added to the graph over time. Graph data engineers make many decisions when designing a graph database to represent the ontology — the conceptual structure of a dataset — in a schema that makes sense for the graph being created. If the data are well understood in the organization, frequently the graph architecting process can begin with schema creation, but if the nature of the graph and inclusive datasets is more exploratory, ontology design may be required first.
Consider the sample schema in the image below. There are five entity types: people (yellow), physical and virtual locations (blue), documents (gray), companies (pink), and financial accounts (green). Between entities, several relationship types are permitted, e.g., “is_related_to”, “mentions”, and “invests_in”. This is a directed graph meaning that the directionality of the relationship has meaning, i.e., two people are_married_to each other (bidirectional link) and a person lives_at a place (directed link).

- There is a clear mechanism for connecting datasets.
Connections between entities across datasets may not always be explicit in the data. Simply importing two datasets into a graph environment could result in many nodes with no connections between them.
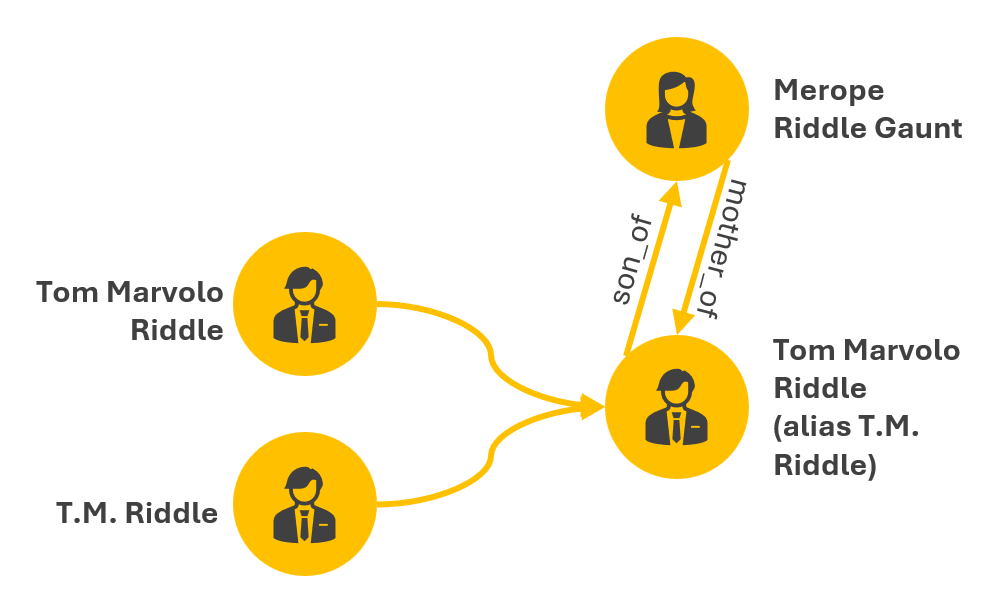
Consider a medical dataset that has a Tom Marvolo Riddle entry and a voter registration dataset that has a T.M. Riddle entry and a Merope Riddle Gaunt entry. In the medical dataset, Merope Gaunt is listed as Tom Riddle’s mother. In the voter registration dataset, there are no family members described. How do the Tom Marvolo Riddle and T.M. Riddle entries get deduplicated when merging the datasets in the graph?, i.e., there should not be two separate nodes in the graph for Tom Riddle and T.M. Riddle as they are the same person. How do Tom Riddle and Merope Gaunt get connected, and how is their connection specified as in the image below?, e.g., connected, related, mother/son? Is the relationship weighted?
These questions require not only a data engineering team to specify the graph schema and implement the graph’s design, but also some sort of entity resolution process, which I have written about previously.

- The graph is architected to scale.
Graph data are pre-joined in graph data storage, meaning that one-hop queries run faster than in traditional databases, e.g., query Tom Riddle and see all of his immediate connections. Analytical operations on graphs, however, are quite slow, e.g., ‘show me the shortest path between Tom Riddle and Minerva McGonagall’, or ‘which character has the highest eigenvector centrality in Harry Potter and the Half Blood Prince’? As a general rule, latency in graph operations increases exponentially with graph density (a ratio of existing connections in the graph to all possible connections in the graph). Most graph visualization tools struggle to render several tens of thousands of nodes on screen.
If an organization is pursuing scalable graph solutions for multiple concurrent analyst users, a bespoke graph data architecture is required. This includes a scalable graph database, several graph data engineering processes, and a front-end visualization tool.
- The graph has a solution for handling temporality.
Once a graph solution is built, one of the biggest challenges is how to maintain it. Connecting five datasets in a graph database and rendering the resultant graph analysis environment produces a snapshot in time. What is the periodicity of those datasets and how frequently does the graph need to be updated, i.e., weekly, monthly, quarterly, real-time? Are data overwritten or appended? Are removed entities removed from the graph or persisted? How are the updated datasets provided, i.e., delta tables, the entire dataset provided again? If there are temporal elements to the data, how are they represented?
- The graph-based solution is designed by graph data engineers.
Graphs are beautiful. They are human-intuitive, compelling, and highly visual. Conceptually, they are deceptively simple. Gather some datasets, specify the relationships between the datasets, merge data together, a graph is born. Analyze the graph, render pretty pictures. But the data engineering challenges associated with architecting a scalable graph-based solution are not trivial.
Tool and technology selection, schema design, graph data engineering, approaches to entity resolution and data deduplication, and architecting well for intended use are just some of the challenges. The important thing is to have a true graph team at the helm of designing an enterprise graph-based solution. A graph visualization capability does not a graph solution make. And a simple point-and-click self-serve software might work for a single analyst user, but is a far cry from an organizationally-relevant graph analytics environment. Graph data engineers, methodologists, and solution architects with graph experience are required to build a high-fidelity graph-based solution in light of all the challenges mentioned above.
Conclusion
I’ve seen graphs change many real-world analytic organizations. Regardless of the analytic domain, so much of an analyst’s work is manual. Numerous technology products exist that attempt to automate analyst workflows or create point-and-click solutions. Despite these efforts, the fundamental problem remains — the data an analyst requires are rarely readily accessible through one interface, much less interconnected and ready for iterative exploration. Data are provisioned to analysts through a variety of platforms, Application Programming Interfaces (APIs), and query tools, all of which require varying levels of technical acumen to access. It is then up to the analyst to manually synthesize the data and draw meaningful analytic conclusions.
Graph-based solutions comingle all an analyst’s relevant data together in one place and represents it intuitively. This gives the analyst the ability to quickly click through the entities and connections as appropriate for analysis. I have personally helped teams build anti-money laundering solutions, target bad actors and illicit financial transactions, interdict migrants lost at sea, track the movement of illegal substance, address illegal wildlife trafficking, and predict migration routes all with graph-based solutions. Unlocking the power of graph solutions for analytic enterprises begins with building a great graph — a solid foundation on which to build stronger, more impactful analytic inquiry.
What It Takes To Build a Great Graph was originally published in Towards Data Science on Medium, where people are continuing the conversation by highlighting and responding to this story.
Originally appeared here:
What It Takes To Build a Great Graph
Go Here to Read this Fast! What It Takes To Build a Great Graph