
Balancing complexity and performance: An in-depth look at K-fold target encoding

Introduction
Data science practitioners encounter numerous challenges when handling diverse data types across various projects, each demanding unique processing methods. A common obstacle is working with data formats that traditional machine learning models struggle to process effectively, resulting in subpar model performance. Since most machine learning algorithms are optimized for numerical data, transforming categorical data into numerical form is essential. However, this often oversimplifies complex categorical relationships, especially when the feature have high cardinality — meaning a large number of unique values — which complicates processing and impedes model accuracy.
High cardinality refers to the number of unique elements within a feature, specifically addressing the distinct count of categorical labels in a machine learning context. When a feature has many unique categorical labels, it has high cardinality, which can complicate model processing. To make categorical data usable in machine learning, these labels are often converted to numerical form using encoding methods based on data complexity. One popular method is One-Hot Encoding, which assigns each unique label a distinct binary vector. However, with high-cardinality data, One-Hot Encoding can dramatically increase dimensionality, leading to complex, high-dimensional datasets that require significant computational capacity for model training and potentially slow down performance.
Consider a dataset with 2,000 unique IDs, each ID linked to one of only three countries. In this case, while the ID feature has a cardinality of 2,000 (since each ID is unique), the country feature has a cardinality of just 3. Now, imagine a feature with 100,000 categorical labels that must be encoded using One-Hot Encoding. This would create an extremely high-dimensional dataset, leading to inefficiency and significant resource consumption.
A widely adopted solution among data scientists is K-Fold Target Encoding. This encoding method helps reduce feature cardinality by replacing categorical labels with target-mean values, based on K-Fold cross-validation. By focusing on individual data patterns, K-Fold Target Encoding lowers the risk of overfitting, helping the model learn specific relationships within the data rather than overly general patterns that can harm model performance.
How it works
K-Fold Target Encoding involves dividing the dataset into several equally-sized subsets, known as “folds,” with “K” representing the number of these subsets. By folding the dataset into multiple groups, this method calculates the cross-subset weighted mean for each categorical label, enhancing the encoding’s robustness and reducing overfitting risks.
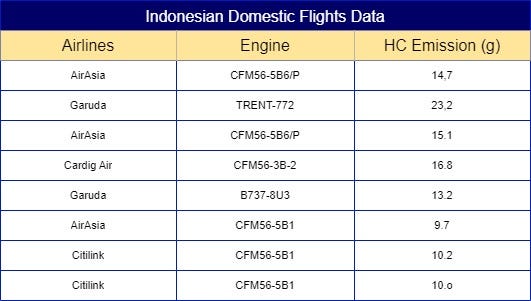
Using an example from Fig 1. of a sample dataset of Indonesian domestic flights emissions for each flight cycle, we can put this technique into practice. The base question to ask with this dataset is “What is the weighted mean for each categorical labels in ‘Airlines’ by looking at feature ‘HC Emission’ ?”. However, you might come with the same question people been asking me about. “But, if you just calculated them using the targeted feature, couldn’t it result as another high cardinality feature?”. The simple answer is “Yes, it could”.
Why?
In cases where a large dataset has a highly random target feature without identifiable patterns, K-Fold Target Encoding might produce a wide variety of mean values for each categorical label, potentially preserving high cardinality rather than reducing it. However, the primary goal of K-Fold Target Encoding is to address high cardinality, not necessarily to reduce it drastically. This method works best when there is a meaningful correlation between the target feature and segments of the data within each categorical label.
How does K-Fold Target Encoding operate? The simplest way to explain this is that, in each fold, you calculate the mean of the target feature from the other folds. This approach provides each categorical label with a unique weight, represented as a numerical value, making it more informative. Let’s look at an example calculation using our dataset for a clearer understanding.
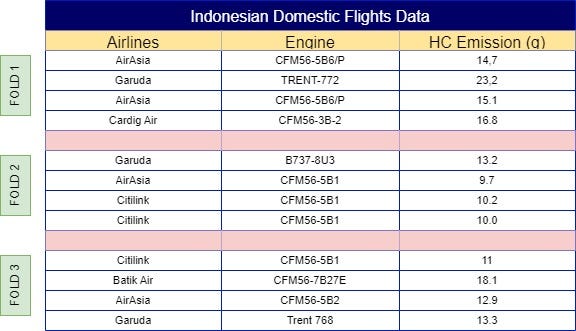
To calculate the weight of the ‘AirAsia’ label for the first observation, start by splitting the data into multiple folds, as shown in Fig 2. You can assign folds manually to ensure equal distribution, or automate this process using the following sample code:
import seaborn as sns
import matplotlib.pyplot as plt

# In order to split our data into several parts equally lets assign KFold numbers to each of the data randomly.

# Calculate the number of samples per fold
num_samples = len(df) // 8

# Assign fold numbers
df['kfold'] = np.repeat(np.arange(1, 9), num_samples)

# Handle any remaining samples (if len(df) is not divisible by 8)
remaining_samples = len(df) % 8
if remaining_samples > 0:
    df.loc[-remaining_samples:, 'kfold'] = np.arange(1, remaining_samples + 1)

# Shuffle again to ensure randomness
fold_df = df.sample(frac=1, random_state=42).reset_index(drop=True)
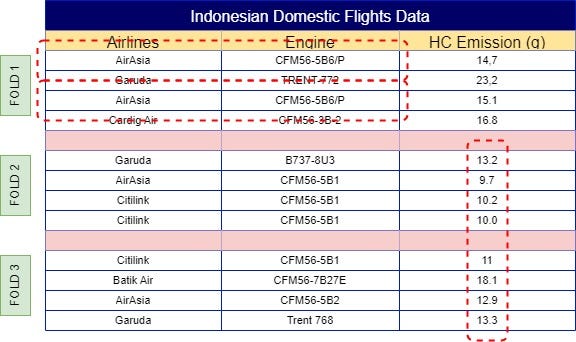
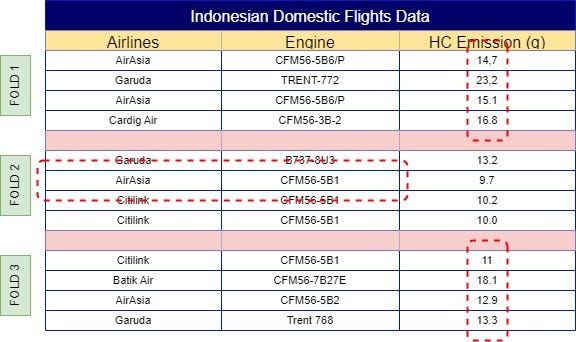
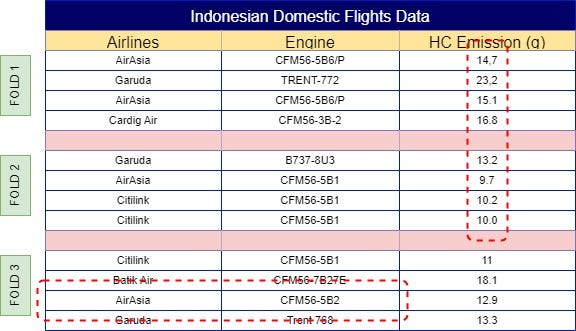
With your dataset now split into folds, the next step is to calculate the mean of the same label across other folds. For example, ‘AirAsia’ in Fold 1 would use the mean from Folds 2, 3, 4, 5, 6, and so on, resulting in a mean of 11.3. This process continues across all folds, so Fold 2 would incorporate the mean from Folds 1, 3, 4, 5, 6, etc. The final results of these calculations are illustrated in Fig 4.
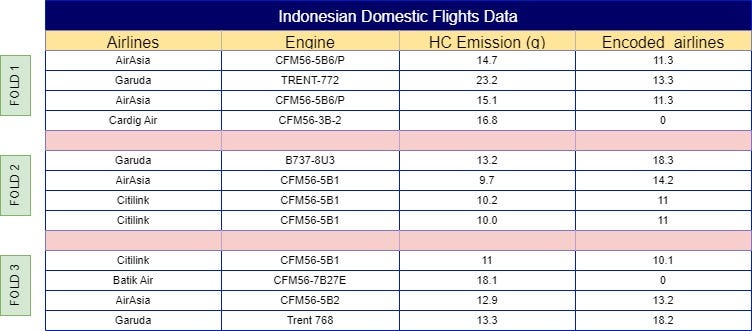
This calculation is known as the “category-specific mean,” which defines the average value for each categorical label based on similar label instances. Another essential calculation is the “global mean,” which defines the average intensity of your categorical label based on a user-defined global mean weight. The global mean serves as a baseline or “neutral” encoding, especially valuable for rare categories where the category-specific mean may rely on limited data points.
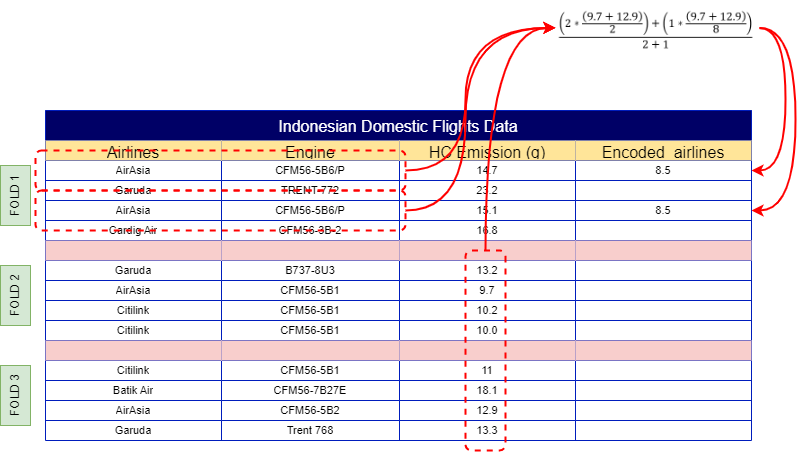
In K-Fold Target Encoding, both the category-specific and global means are typically combined to create a more robust and comprehensive representation. For a detailed illustration, refer to Fig 5.

The mathematical formula makes it easier to understand how this calculation works. Here, m represents a user-defined weight, allowing control over the influence of the global mean in the final calculation. Now, we can apply this formula to the dataset from Fig 2 and implement it using the code below.
# First we have to encode the categorical features using K-Fold target encoding

def useful_feature(df, target, weight):
  utilized_feature = [c for c in df.columns if c not in (target)]
  obj = [col for col in df.columns if df[col].dtype == 'object']
  global_mean = df[target].mean()

  for objek in obj:
        df[f"countperobject_{objek}"] = 0
        df[f"meanperobject_{objek}"] = 0

        # Compute aggregations
        agg = df.groupby(objek)[target].agg(['count', 'mean']).reset_index()

        counts = agg['count'].values
        mean = agg['mean'].values

        # Iterate over each row
        for i in range(1, 9): # design regarding to the length of the k-fold
          for index, row in df.iterrows():

              # Get the category and target value
              if row["kfold"] != i:
                  category = row[objek]
                  target_val = row[target]

                  # Get the count from agg
                  count_agg = agg[(agg[objek] == category)]['count'].values
                  if len(count_agg) > 0:
                      df.at[index, f"countperobject_{objek}"] = count_agg[0]

                  # Get the mean from agg
                  mean_agg = agg[(agg[objek] == category)]['mean'].values
                  if len(mean_agg) > 0:
                      df.at[index, f"meanperobject_{objek}"] = mean_agg[0]

        # Now find the weighted mean
        df[f"weightedmean_{objek}"] = ((df[f"countperobject_{objek}"] * df[f"meanperobject_{objek}"]) + (weight * global_mean))/(weight + df[f"countperobject_{objek}"])

  encoding_maps = {}
  for objek in obj:
      encoding_maps[objek] = df.groupby(objek)[[f"countperobject_{objek}", f"meanperobject_{objek}"]].mean().to_dict()

  return df, encoding_maps
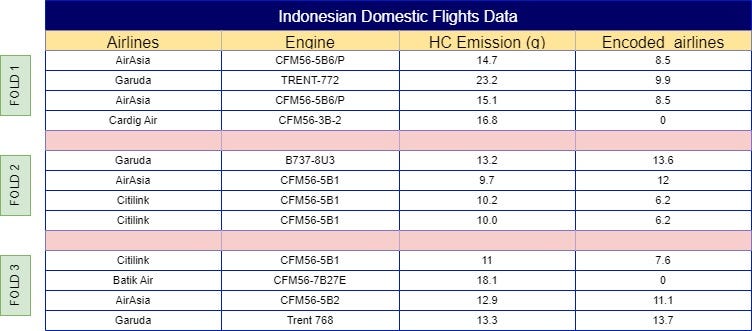
Now with plotting the same formula into each of the categorical labels, the outcome would look like Fig 7.
It’s important to remember that this method can be risky if there is a significant difference between your training and test datasets. For example, if AirAsia consistently produces high volumes of HC emissions in your training data, but in your test data, Garuda has the highest HC emissions distributed evenly, the model may overfit to the training pattern, leading to lower accuracy on new data.
Thanks for reading this article, hope you can get a better view of what is K-Fold Target Encoding and when to use it. Go check out my social media here and help me grow a better community for future data talents!!!:
Linkedin: https://www.linkedin.com/in/fhlpmah/
Dev.to: https://dev.to/fhlpmah
Instagram: https://www.instagram.com/fmasmoro/
Resources
[1] Image Made by The Author.
[2] Datasets are Artificially Simulated by The Author. Inspired by: Organization ICA, 2023, ICAO Aircraft Engine Emissions Databank https://www.easa.europa.eu/en/domains/environment/icao-aircraft-engine-emissions-databank.
[3] All Codes is written by The Author.
Understanding K-Fold Target Encoding to Handle High Cardinality was originally published in Towards Data Science on Medium, where people are continuing the conversation by highlighting and responding to this story.
Originally appeared here:
Understanding K-Fold Target Encoding to Handle High Cardinality
Go Here to Read this Fast! Understanding K-Fold Target Encoding to Handle High Cardinality
