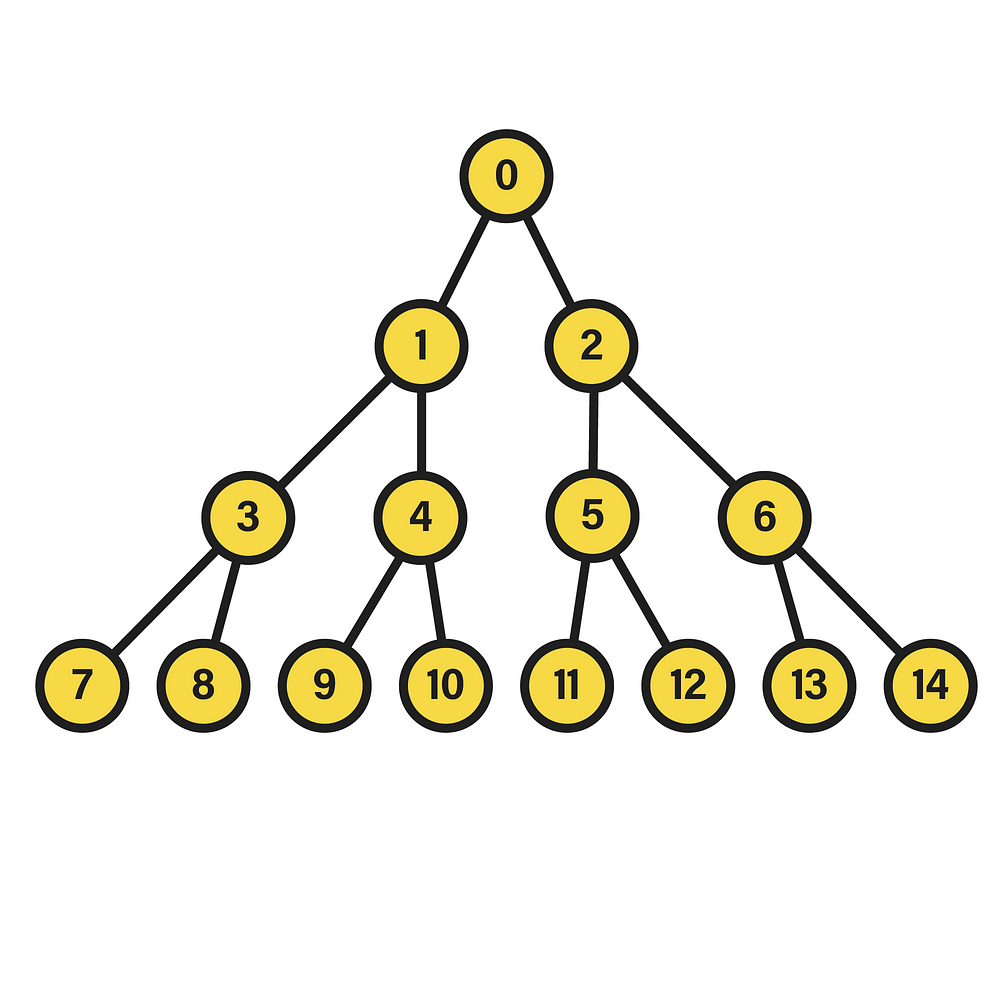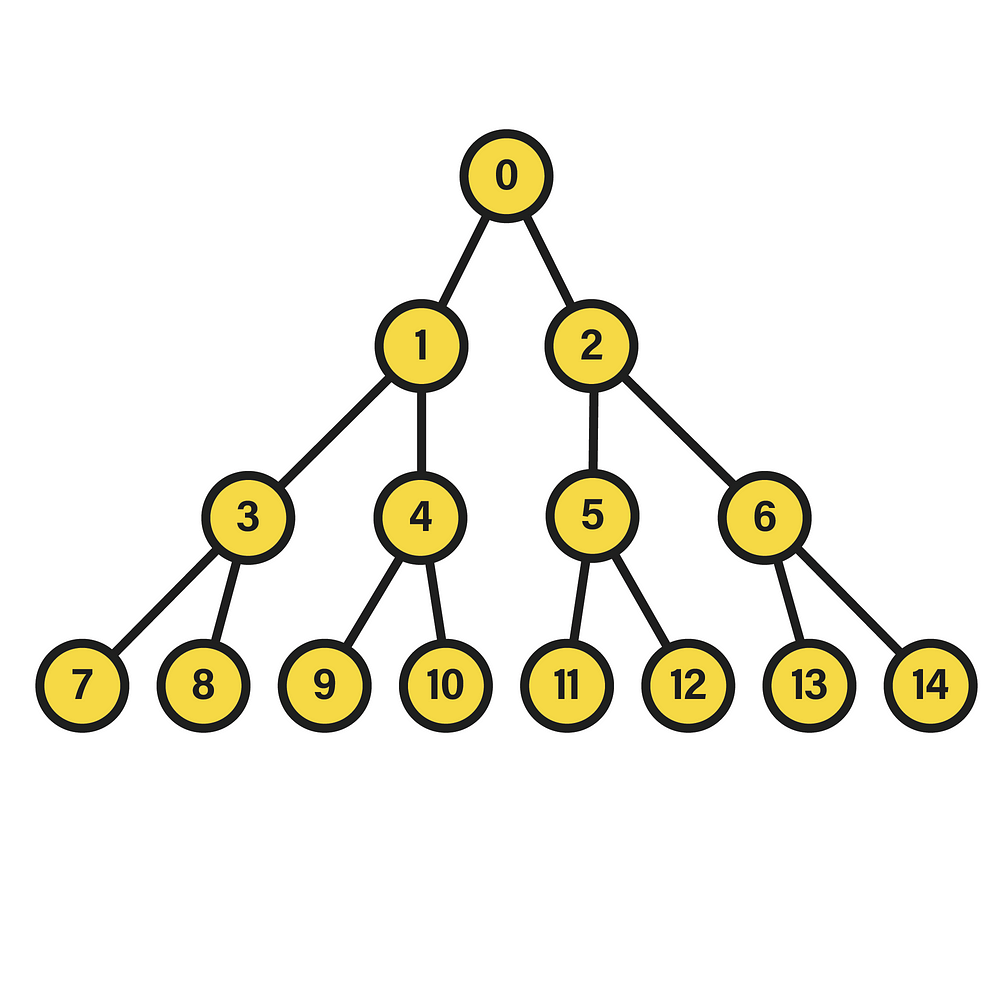
Deriving the tightest asymptotic bound of a particular tree traversal algorithm

Introduction
Data structures and algorithms are key elements in any software development, especially due to their impact on the final product quality. On the one hand, characterizing a process by means of a widely known and studied algorithm leads to a potential increase in the maintainability of codebases, since there is a large volume of open source resources and documentation available on the web. But, the main feature that is the reason why much effort is spent when deciding which data structure to use for the representation of information or the ideal algorithm for the performance of a given task is efficiency, both in terms of memory and time. In short, the choice of a good procedure or structure usually produces an advantage over other products on the market, whose response time, computational resources needed to fulfill its purpose or scalability are inadequate for its requirements.
Therefore, in order to make proper decisions in this regard, it is necessary to measure the cost of the algorithms accurately to subsequently perform studies in which a sufficiently valid comparison can be established to discard implementations or data structures that do not fit the product requirements, which often involve time and space constraints. As such, these two quantities are quantified by their asymptotic growth as the size of the input data provided grows to infinity. That is, the measure of how efficient an algorithm is depends on the growth of the time or space resources required for its execution given a certain increase in the input size, whereby the more they increase with the same variation of the input size, the worse its performance is considered, since they will need more resources than necessary. On the other hand, the selection of a suitable data structure on which efficient algorithms can be applied depends mainly on the complexity of the information to be modeled, although the final objective is that the algorithms determined by their operations (add(), remove(), search(element)…) have the minimum asymptotic growth achievable.
Objective
In this work, with the aim of showing the method to describe the time complexity of an algorithm and to allow its comparison with other alternatives, we will first start with a data structure, namely a perfectly balanced binary tree, and an algorithm executed on it. Subsequently, the format of its input will be formalized, visualizations will be built to understand its composition, as well as the procedure trace, and finally the ultimate bound will be reached through a formal development, which will be simplified and detailed as much as possible.
Algorithm Definition
The algorithm we are about to work with involves a binary tree with the restriction of being perfectly balanced. By definition, a binary tree is a pair formed by a set of nodes and another set of edges that represent connections between nodes, so that each of the nodes of the set has a connection with exactly two nodes known as child nodes. And, of all the existing trees that can be formed from this definition, here we are only interested in those designated as perfect.
A perfect binary tree is distinguished by the equality in the depth of its leaf nodes, i.e. those of its last level, and by the constant number of children equal to two in the remaining nodes. The depth of a node within the tree, in turn, is the length of the path between its root and the node in question. Hence, the appearance of the data structure will be akin to:
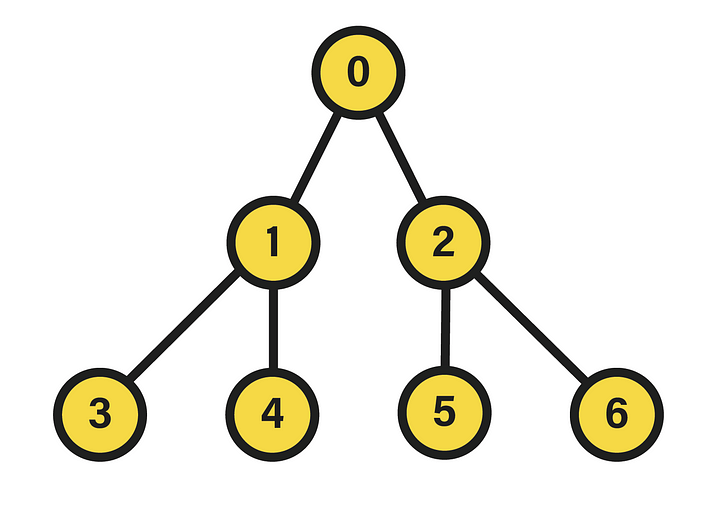
In this particular case, we are dealing with a perfect binary tree of depth two, since the nodes of the last level fulfill the condition of having the same depth, equivalent to that value. Additionally, in the picture the nodes have been numbered in a certain way that will be useful in this context. Specifically, the integer corresponding to each node stems from the execution of a breadth-first traversal starting from the root, which is equivalent to a level-order traversal given the tree hierarchy. Therein, if the visited nodes are numbered starting from 0, a labeling like the one shown above will be settled, in which each level contains all the nodes assigned to integers between 2^l-1 and 2^(l+1)-2, where l is the level. To see the source of this expression, it suffices to find a function that, with a level l as input, returns the minimum integer in the interval of that level, as well as another function that calculates the opposite, i.e. the maximum.
First, let m(l) be the function that returns the minimum. Thus, by observing the sequence it should follow as the input increases, we notice the pattern {0,1,3,7,15,31,63…}. And, when searching for its initial values in OEIS, it yields a match with the sequence A000225. According to the definition of this sequence, its values are given by the expression 2^l — 1, but, to see why this is the one that models the progression of m(l), it is necessary to establish a relation between two contiguous evaluations m(l) and m(l+1), which will lead to such formulation. Then, if we consider the minimum value for one level l and that of the next, we can start from the assumption that the difference between the two is always equal to the number of nodes existing in the level with the least number of nodes. For instance, in level 1 there are only two nodes, whose labels are {1,2}. The minimum value in this level is 1, and the next one is 3, so it is easy to verify that 3=1+2, that is, the minimum value of level {1,2} plus the number of nodes in it. With this, and knowing that the number of nodes in a level, being a binary tree, is exactly 2^l nodes, we arrive at the following formulation of m(l):

In summary, m(l) is expressed as the minimum integer in the previous level m(l-1) plus the nodes contained in it 2^(l-1), in addition to the base case m(0)=0.
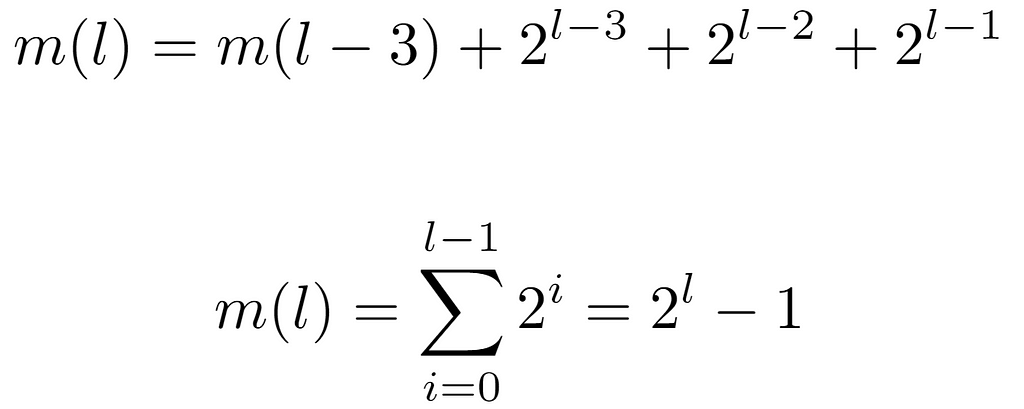
So, when expanding m(l) by evaluating its recursive term, a pattern appears with which this function can be characterized. Briefly, every power of 2 from 0 arising from m(l-l) up to l-1 is aggregated. Finally, after solving the summation, we arrive at the same expression present in the definition of A000225. Consequently, we now proceed to obtain the maximum integer at level l, which is denoted by a new function M(l). In this case, the sequence formed by its evaluations is of the form {0,2,6,14,30,62…}, also recorded in OEIS as A000918. For its derivation, we can leverage the outcome of m(l), so that by knowing the number of nodes present at each level, M(l) can be defined as the minimum integer at each level m(l) plus the number of nodes in it.

In order to arrive at the ultimate expression 2^(l+1)-2, we add m(l) and the number of nodes at that level except for one, the minimum. And, as this value coincides with m(l), we can conclude M(l)=2m(l).
After defining the data structure the algorithm will work with and discovering some potentially useful properties for a complexity analysis, the algorithm in question, expressed in pseudocode, is introduced:
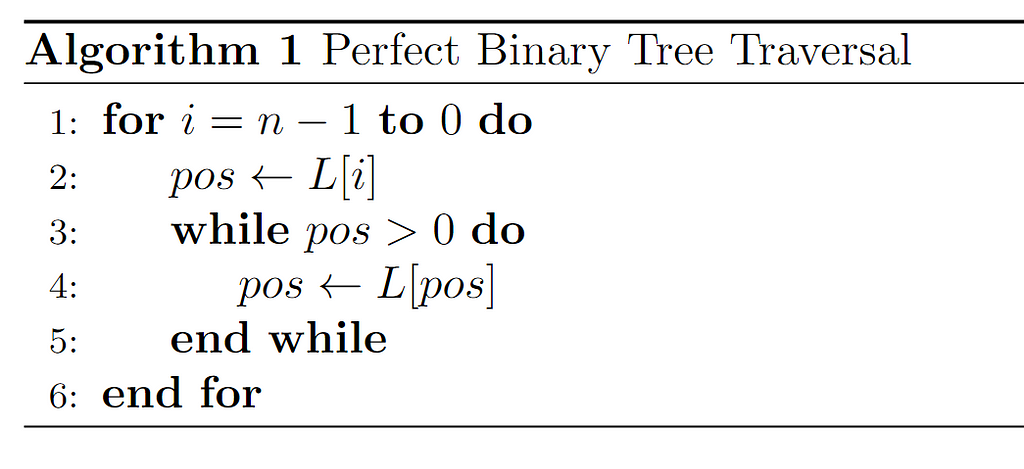
At first, although we will later expand on this in detail, the input consists of a vector (array) denoted as L where the binary tree is represented. With it, every entry of the array corresponding to nodes in the tree is linearly traversed by means of a for loop. And, within each iteration of this loop, a temporary variable pos is initialized to store array elements, so it will have the same type (integer). In addition, in the iteration, all the nodes that form the path from the root of the tree to the node represented by the array entry on which the for is running are traversed via the while loop nested within it. For this purpose, the exit condition pos>0 is set, which corresponds to the situation where pos has reached the root. As long as this condition is not met, pos will update its value to that of its parent node, so assuming that the input structure is correct, there is a guarantee that for every node in the tree the while loop will always reach the root, and therefore terminate.
Input Characterization
To grasp this process, it is essential to be familiar with the input format. In particular, the way in which the binary tree can be represented in the form of an array, being the structure used by the algorithm. To this end, and to simplify this representation, a transformation is performed in the labeling of the tree nodes, so that the breadth traversal they were labeled with at the beginning is executed from the root node starting at the integer 1. Or, seen in another way, 1 is added to the original label of all nodes.
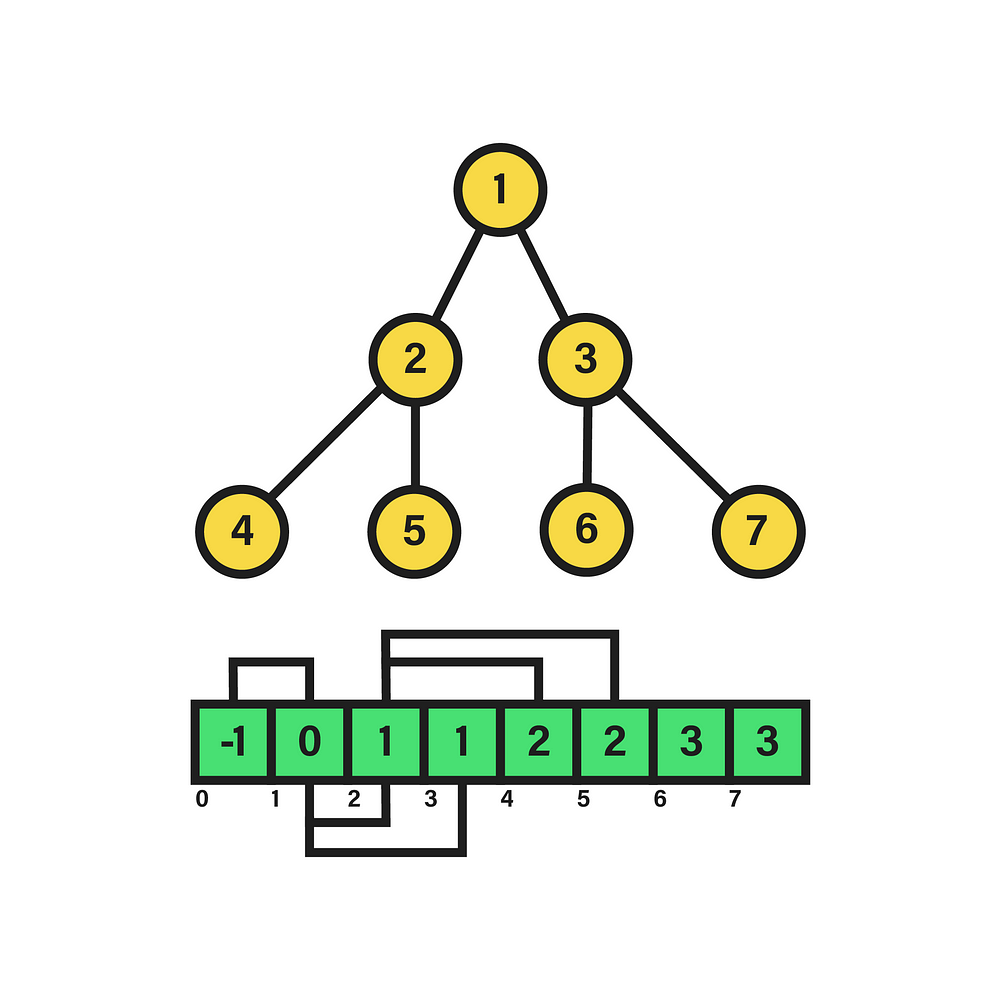
The result of the aforementioned transformation is shown above. As evidenced, the minimum and maximum values of the labels at each level have also been modified. Although, due to the properties of the transformation, it is sufficient to apply its inverse to the functions m(l) and M(l) to re-characterize the label sequences correctly.

Consequently, if the transformation on the nodes consists of adding 1 to its label, its inverse subtracts such quantity. This way, after applying the inverse transformation to both functions, we arrive at the upper expressions, modeling the sequence of minimum and maximum value labels for each tree level. On the other hand, by means of the new labeling, the data structure can be represented as an array, like the one our algorithm takes as input. Similarly, since it is a perfect tree, we know that it will have a regular structure in terms of number of nodes, as well as their location in the hierarchy. Because of this, considering the input array L[n+1], we can relate its indexes to the values stored in those positions.
For example, as depicted in the above image next to the “linked” representation of the tree, we can map the labels of each node to the array indexes, so that L[1] stands for the instance of the root node, L[2] and L[3] for their respective child nodes, and so on up to the terminal nodes. However, it is also necessary to denote their edges explicitly, so it is decided to store in the array values the label corresponding to the parent node of a given one by a certain index. In short, for each node i (index) of the array, the value stored in L[i] corresponds to the label of i’s parent node. Yet, as a matter of correctness, the first index of the list L[0] is not considered to correspond to any node. Moreover, its value is set to -1 to denote that it has no node above it in the hierarchy.
In view of this idea, it is worthwhile to study the properties of the sequence {-1,0,1,1,1,2,2…} (A123108), or even to find a function to span its values, which will be valuable in the analysis. Hence, it is first important to consider how the child nodes and the parent L[i] of a given node i are determined.

Regarding the child nodes of a given node i, if we account that any subtree of the original structure is also a perfect tree, it can be inferred that m(l) will serve its purpose within the scope of the subtree, resulting in the difference between the labels of any node and its left child being i (below instead of i is denoted as 2^l, both equivalent), which coincides with the amount of nodes at the lower level.
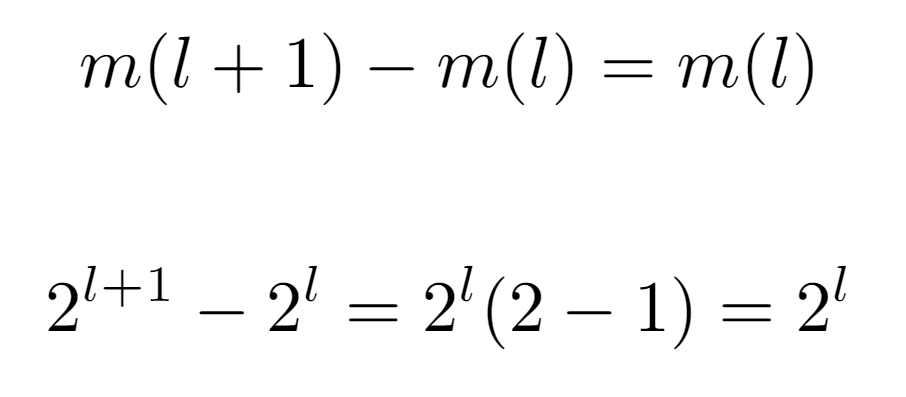
Furthermore, to view that it is fulfilled in all subtrees, offsets α and β are attached to the left child and parent node labels repectively, resulting in the equivalence 2α=β.

Assuming that the offsets do not exceed the node limit at their level, the amount of nodes present at the level of the child node located between its minimum m(l+1) and itself is twice that of the same magnitude considered at the upper level with its parent node. Hence, by doubling the number of nodes at each level by definition of a perfect binary tree, it is concluded that the label of the left child node of one i is given by the expression 2i, being that of its right child 2i+1 accordingly. Likewise, a node i will always have a parent node, except in the case where it is the root, whose parent will be L[0], which is not treated as a tree node.

To determine the function that outputs the label of the parent node, we first define the functions Cleft(i) and Cright(i) that get the respective child nodes. In this manner, if these functions transform the label in such a way that the result is equivalent to a descent in the hierarchy, their inverses will lead to the opposite effect, which is expected in case we want to retrieve the parent. After defining P(i) as the function that returns the parent node of i, equivalently denoted as the value in the vector L[i], it is necessary to make a distinction in the expression applied for its computation according to the properties of the input. That is, if the node is labeled even, that means it is the left child of some node, so the inverse of Cleft(i) will be invoked. On the other hand, in case it is odd, the function P(i) has as expression the inverse transformation to Cright(i).
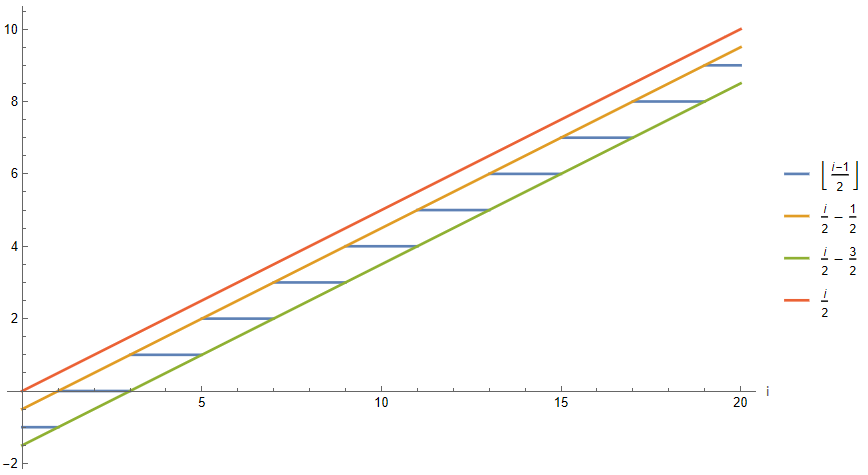
Graphically, both formulations for even and odd labeled nodes exhibit asymptotically similar growth as i increases. Even, due to the properties of the floor function it is possible to constrain the values of P(i) with odd i via i/2-dependent bounds and a constant. As a result, this leads to the following property:
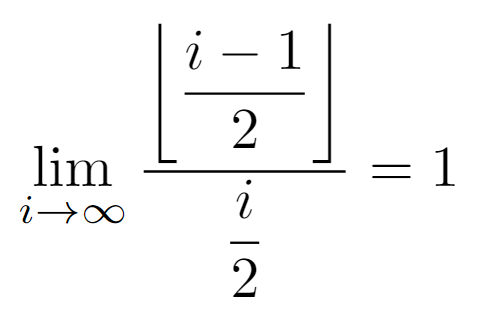
By observing the above graph it is not possible to guarantee that the asymptotic growth of both subexpressions of P(i) is exactly equal. But, after deriving the bounds for the odd case and determining that the dependence has order O(i), we can compute the limit when the node label tends to infinity of the ratio between the two functions, being their growths equivalent as expected.
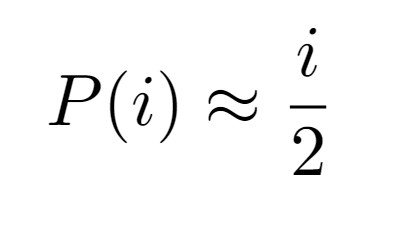
Consequently, for simplicity it would be convenient to provide a single formulation for P(i) regardless of the input received, so the simplest option is to consider the growth order of the even case i/2, since the remaining case has the same asymptotic growth.
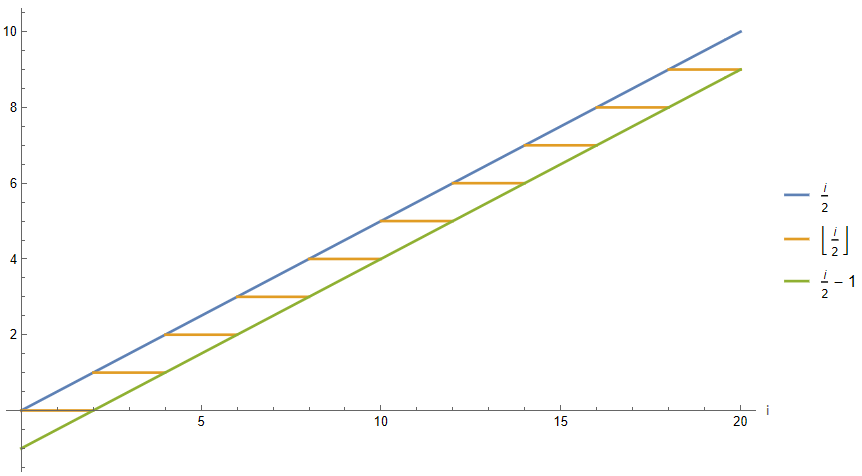
Nevertheless, the i/2 operation does not return integers for nodes with odd label, so to address this concern it is decided to apply the floor function again to i/2. Visually, the value of Floor[i/2] can be bounded in a similar way by the original function and its same value minus 1 due to the properties of the floor function. But, as the objective is to reach a correct expression for P(i), not an approximate one that serves for an asymptotic analysis, still, it is deemed necessary to define it from the floor of i/2.
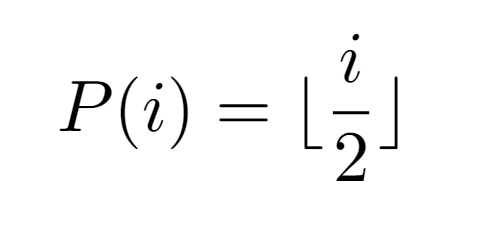
The main reason for selecting such definition arises from the formal definition of the input array:

Since L contains the labels of the parent nodes determined by each array index, it is possible to characterize them from the function P(i), where i in this case is a valid index. In other words, the first value L[0] must equal -1, which is denoted in a special way without the use of P(i) as it cannot generate that value. Then, the base array {-1} is concatenated with the sequence {P(1),P(2),P(3)…} whose length is the total number of nodes and whose values correspond to the parent nodes of the label sequence {1,2,3…}.
GenerateTree[n_] := Flatten[{-1, Table[i/2, {i, 1, n}]}]
GenerateTree[15]
Once the sequence contained in the input array has been modeled, above is the Wolfram code needed to generate a tree with 15 nodes, resulting in L={-1, 1/2, 1, 3/2, 2, 5/2, 3, 7/2, 4, 9/2, 5, 11/2, 6, 13/2, 7, 15/2}. As expected, by not using the Floor function in P(i), nodes with odd index return rational numbers, so after redefining the GenerateTree[] function with the appropriate P(i), the correct sequence L={-1, 0, 1, 1, 1, 2, 2, 2, 2, 3, 3, 3, 4, 4, 4, 5, 5, 5, 6, 6, 6, 7, 7} is achieved:
GenerateTree[n_] := Flatten[{-1, Table[i/2 // Floor, {i, 1, n}]}]
GenerateTree[15]
Input Visualization
Besides building the array, it is appropriate to visualize it to ensure that the indexes and values contained in it match its definition. For this purpose, Wolfram’s graphical features are used to automate the tree visualization process from the sequence created by GenerateTree[]:
PlotBinaryTreeFromList[treeList_List] :=
 Module[{n = Length[treeList], edges},
  edges = Flatten[Table[{i -> 2 i, i -> 2 i + 1}, {i, 1, Floor[n/2]}]];
  edges = Select[edges, #[[2]] <= n &];
  TreePlot[edges, VertexLabeling -> True,
   VertexRenderingFunction -> ({Inset[treeList[[#2]], #1]} &),
   DirectedEdges -> False, ImageSize -> Full]]
n = 31;
treeList = GenerateTree[n]
PlotBinaryTreeFromList[Drop[treeList, 1]]
When building a tree with exactly 31 nodes, L={-1, 0, 1, 1, 1, 1, 2, 2, 2, 3, 3 … 14, 14, 15, 15}, which graphically resembles the following:

Concretely, the blue text denotes the index of the parent node, while the other text in black illustrates the label of the node in question.
Implementation
Now with a well-defined input, it is possible to comprehend at a more abstract level what the operations of the tree traversal actually do. On one side, the outer For[] loop traverses through all the nodes in level order from the lowest level to the one where the root is located. And, for each node the While[] loop traverses the path from the root to the visited node in reverse order, although the important aspect for the time complexity bound is its length.
TreeIteration[v_List] := Module[{n, pos}, n = Length[v];
  For[i = n, i >= 0, i--,
   pos = v[[i]];
   Print["FOR: ", i];
   While[pos > 0,
    Print["While: ", pos];
    pos = v[[pos + 1]];
    ]]]
So, after implementing it in Wolfram, some Print[] are included to display the index of the parent node of the nodes it traverses during its execution, enabling an easier reconstruction of its trace.
Output
n = 7;
treeList = GenerateTree[n]
TreeIteration[treeList]
PlotBinaryTreeFromList[Drop[treeList, 1]]
Running the algorithm with a 7-node tree, represented as L={-1, 0, 1, 1, 1, 1, 2, 2, 2, 3, 3}, yields the following outcome:
FOR: 8
While: 3
While: 1
FOR: 7
While: 3
While: 1
FOR: 6
While: 2
While: 1
FOR: 5
While: 2
While: 1
FOR: 4
While: 1
FOR: 3
While: 1
FOR: 2
FOR: 1
FOR: 0
At first glance, the trace is not too revealing, so it should be combined with the tree depiction:
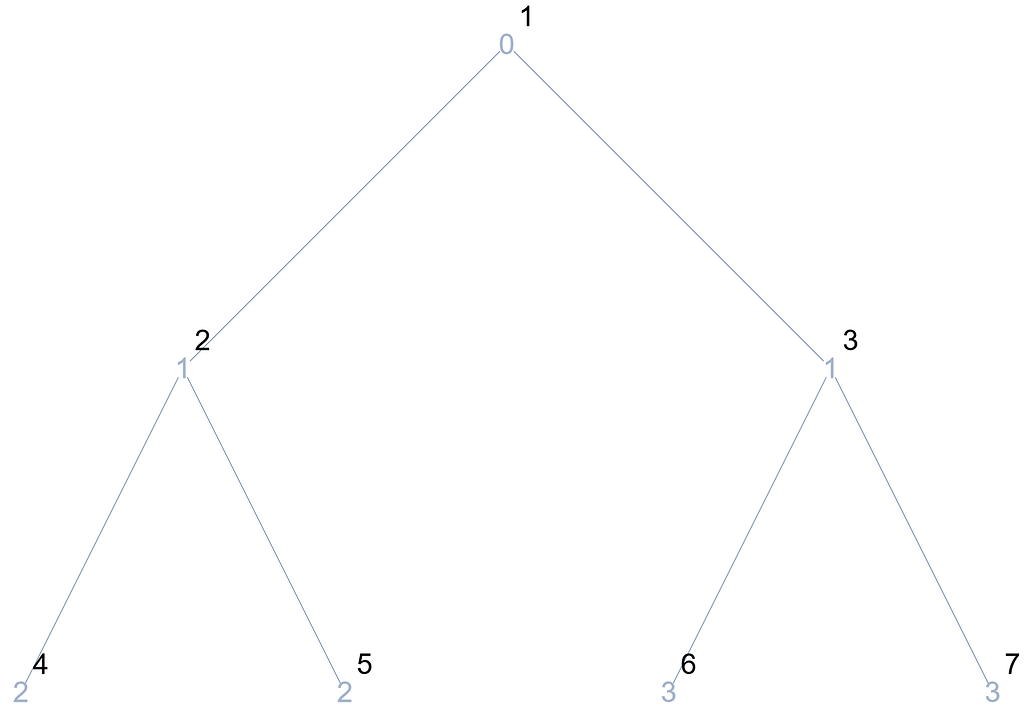
In the first iteration of the for loop, the traversal starts at the last node of the lowest level, whose parent has index 3. Subsequently, this node is also visited by the while loop, until in the next iteration it reaches the root and ends. In the succeeding for iteration, the same process is performed with the difference that it begins with the node with index 6, whose parent node is the same as before. Thus, it can be noted that the for is actually traversing all the existing paths in the tree that connect each of the nodes to the root.
Analysis
With the algorithm in place, and after having fully characterized its input and understood its operation, it is suitable to proceed with its analysis, both in terms of memory and time. On the one hand, the analysis of the memory occupied is straightforward in this case, since the algorithm does not need additional memory to perform its task, beyond the integer value pos in which the node traversed in each iteration is stored. Accordingly, the asymptotic bound representing the additional memory consumption is constant O(1). And, if we consider the space occupied by the input, an amount of memory of order O(n) would be required, where n is the number of nodes in the tree, or more precisely O(2^d), where d is the tree depth.
On the other hand, to determine the time complexity bound, we must define an elementary operation to be accounted for. For this algorithm, it is established as the asingnation executed inside the while loop, which at an abstract level can be considered as the traversal of an edge between a node and its parent. Therefore, to ascertain how many times this operation is invoked, the cost of the algorithm is first decomposed into two functions. There is, on one side, the cost Tf(n) of the for loop, which represents the total of one algorithm’s execution. This, in turn, is defined as the sum of the costs incurred by the while loop, designated as Tw(i).
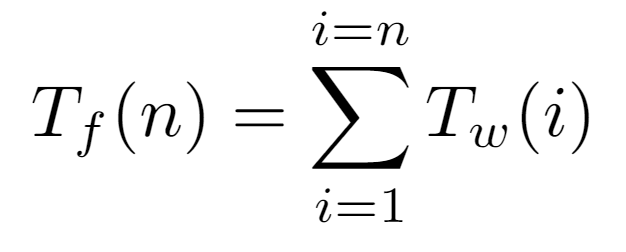
For all nodes i contained in the array, we need to determine how many elementary operations are involved in the traversal of the path from the root to i, so we append the corresponding Tw(i) evaluation. Specifically, that function will return the exact number of assignments caused by a certain input node. Thus, since we know that the first L[0] cannot walk any path to the root, it is not counted, keeping the sum limits between 1 and the number of nodes n in the tree.
Before continuing, we proceed to demonstrate that the application of the function P(i) to a node i located at level l of the tree results in the label of a node located at the immediately upper level, since the elementary operation considered in this analysis is equivalent to pos=P(pos), mainly due to the input features:
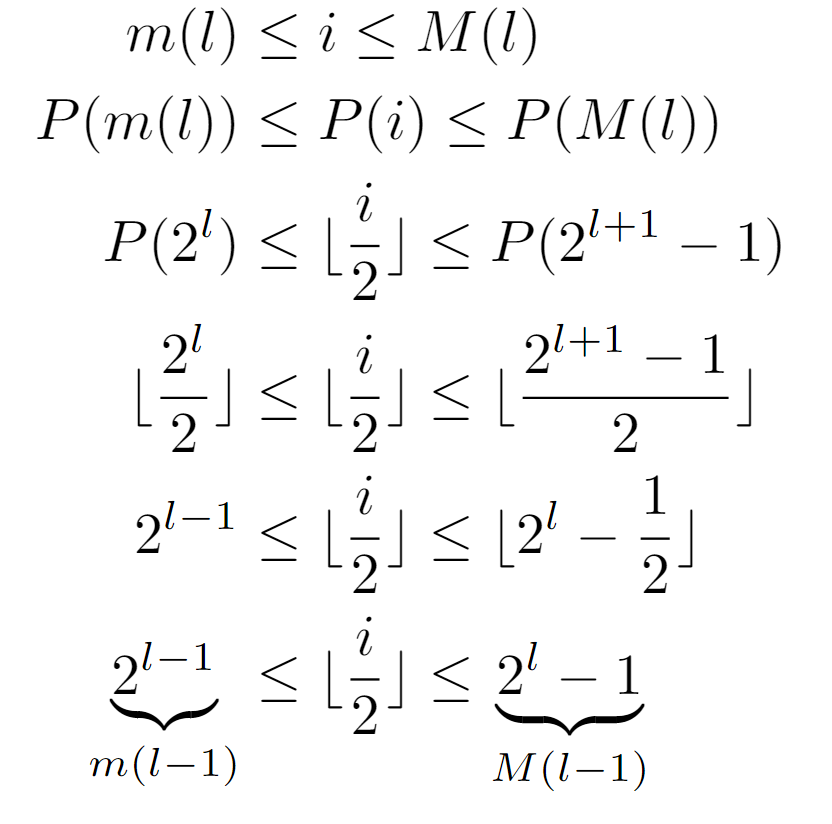
As shown, we begin with the inequality that any node must fulfill with respect to the level at which it is found, being its label bounded by the functions m(l) and M(l), and assuming that l is its level. Afterwards, when applying P, several simplifications can be effected, leading to the conclusion that P(i) lies between 2^(l-1) and 2^l-1, both coinciding with the evaluations m(l-1) and M(l-1), suggesting that after the transformation the resulting node is located at level l-1. With this, we are demonstrating that after several iterations of the while loop, the node stored in pos will have a level closer to the tree root. Consequently, if enough of them are completed, the path is guaranteed to reach the root and terminate. Although, in case of considering an infinite tree this might not hold.
Approach 1
At the moment, we know that the complexity is driven by Tf(n), despite the lack of an exact expression for Tw(i), so we proceed to discuss three different ways to characterize this function, and thereby the overall asymptotic growth of the execution time.
Regardless of how the remaining function is found, a constraint on the tree nodes will be met in all analyses. Namely, since they all have a single parent, except the root, we can ensure that the path length between an arbitrary node located at a level l and the root is equal to l. Primarily this is due to the property demonstrated above, although it can also be evidenced by the realization that each node present on such a path is at a different level, which can vary from 0 to l. Then, as the while loop traverses every node in the path, it is concluded that the operations counted in Tw(i) are exactly l.
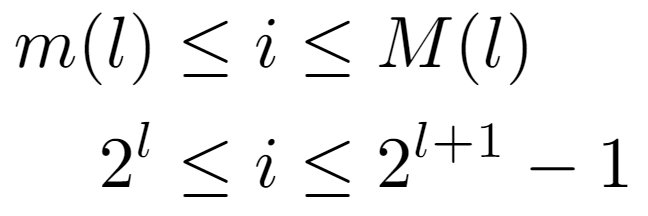
Now, the analysis is focused on computing the level of a given node, so we start from the upper inequality. That is, the label of a node i is at a level l bounded by m(l) and M(l), yielding two conditions with which the level can be accurately quantified:

On the one hand, solving from the left side of the inequality leads to a condition reducible to a floor operation on log_2(i), by its own definition. From this, it can be inferred that the level is equal to that quantity, although the other condition of the original inequality still needs to be verified.
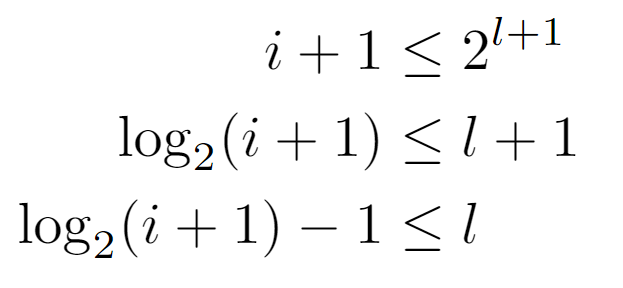
Starting from the right-hand side, we arrive at a lower bound for l, which a priori appears to be complementary to the preceding. However, after operating and applying the definition of the ceiling function, we arrive at the following formulation for the level, since its value is the minimum integer that satisfies the last inequality shown above.

Recapitulating, so far we have derived several expressions for the level of a node i, which at first could be thought of as bounds of that value due to their nature. Nonetheless, the level must be an integer, so it is conceivable to check the distance between them, just in case it were small enough to uniquely identify a single value.

In summary, it is proven that both expressions are identical for all the values that the node labels may have. Therefore, the level of a node can be inferred by either of the above formulae, the left one being the simplest, and so the one that will be used in the analysis.

As the level of i coincides with the elementary operations of the while loop, the cost Tw(i) is defined analogously to the node’s level from which the path to the top must commence.

Next, with an expression for the cost of each iteration of the for loop as a function of the initial node, we can try to find the sum of all the costs generated by the nodes of the tree. But, as there is a floor function in each summand, we will first study the impact of not applying this function on the ultimate bound, in order to simplify the summation, as well as the resulting bound in case the floor becomes dispensable.
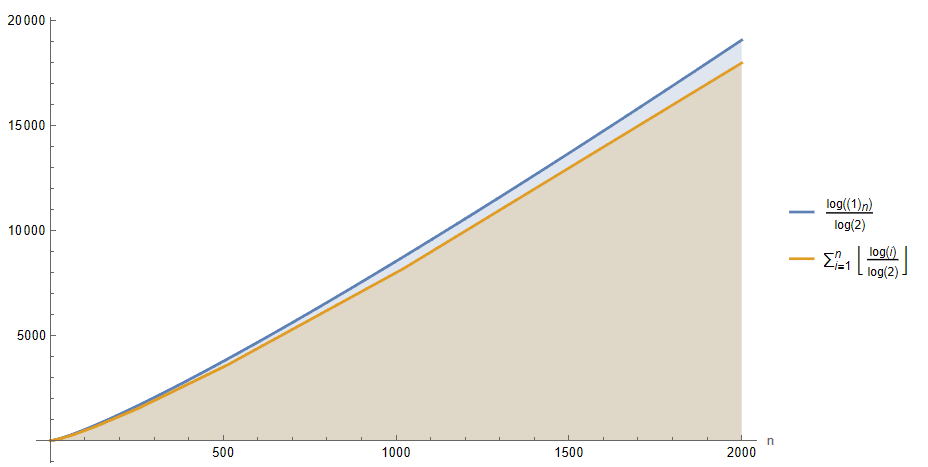
If we plot Tf(n) for a decent range of n, a slight difference is discernible between the function with the floor of each summand removed and the original one. Particularly, the one that directly sums the logarithm values without any additional transformation appears to be a upper bound of the actual complexity, so if we proceed to solve the sum where each term is directly log_2(i), we can arrive at a bound that asymptotically may be somewhat larger than the actual one, establishing itself as the upper one:

By expressing the sum in a closed form, we could assume that the algorithm requires an execution time no greater than the order O(log(n!)) with respect to the number of nodes in the input tree. Still, this bound can be further simplified. For instance, if we consider that in each iteration of the for loop, which is executed as many times as n nodes, a work is performed proportional and not higher than the maximum level of the tree, we would get an upper bound of order O(n log(n)). As a consequence, if we compare it with the previous order O(log(n!)) through the limit of its ratio when the input tends to infinity, we conclude that both are equivalent, allowing the simplification of the upper bound of the algorithm’s runtime to O(n log(n)).
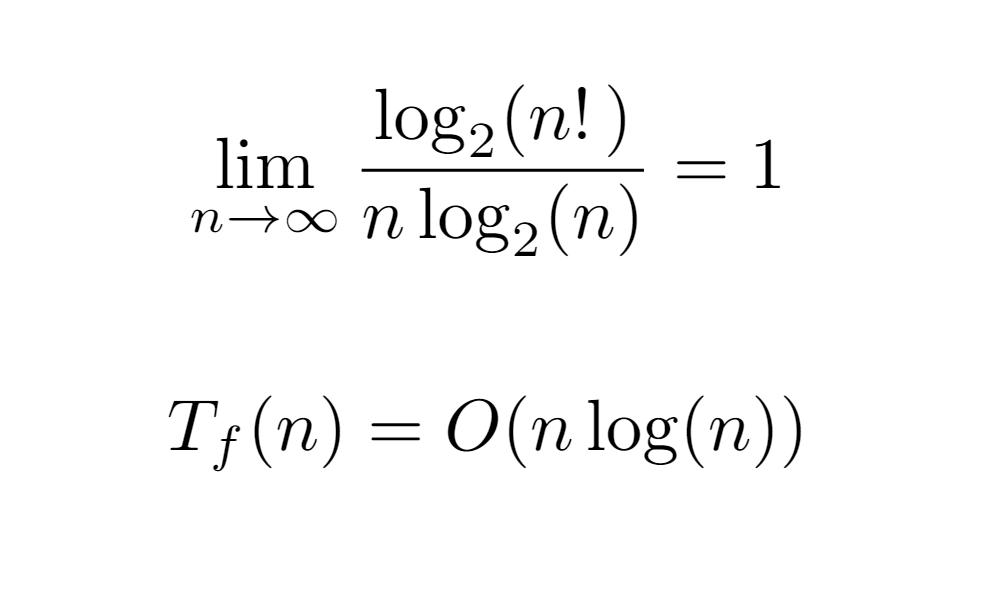
At this juncture, the upper bound ensures that the runtime overhead of the algorithm does not exceed the order O(n log(n)) in terms of growth with respect to the input. However, the interest of the analysis resides in bounding the cost as much as possible, i.e., finding the tight bound, not an upper one, which in some cases may differ significantly. For this, it is necessary to find a closed form for the sum Tf(n) above, especially when the floor function is applied to the summands. Intuitively, the application of the floor will reduce the value of each term to some extent, and the ultimate value may vary due to the dependence between the upper limit and the size of the tree.

Firstly, for log_2(i) to be an integer and to avoid applying the floor transformation, the node label must be of the form 2^l, where l must necessarily refer to the level at which it is encountered.
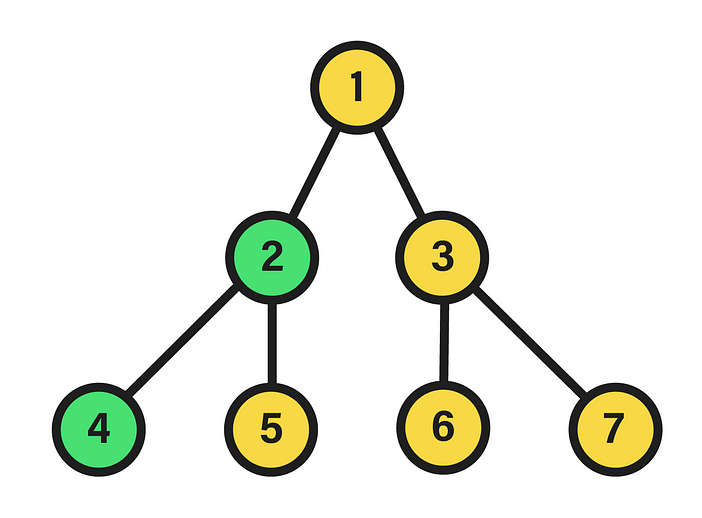
Coincident with m(l), above it is shown that all nodes i=m(l) whose label is the minimum of their level will result in log_2(i) being an integer, namely l.

Therefore, by feeding all labels between m(l) and M(l) as input to the floor(log_2(i)) function, it should yield its level, which has been found to coincide with that of the “representative” m(l) node of that level. Briefly, this allows to assume that every node of a particular level will incur in the same cost Tw(i), as the path’s length from any one of them to the root is exactly equal to l.

Subsequently, the number of nodes at each level is deduced, which as one might guess without this step is 2^l, that is, if at each level the number of nodes of the previous one is doubled, for a certain level this quantity will be given by the product of the branching factor by itself l times.

In conclusion, the runtime cost of the algorithm at all nodes of the same level l is the product between the length of the path to the root, coincident with the level, and the number of nodes in it. And, from this result a closed form for Tf(n) dependent on the depth d of the tree can be drawn:
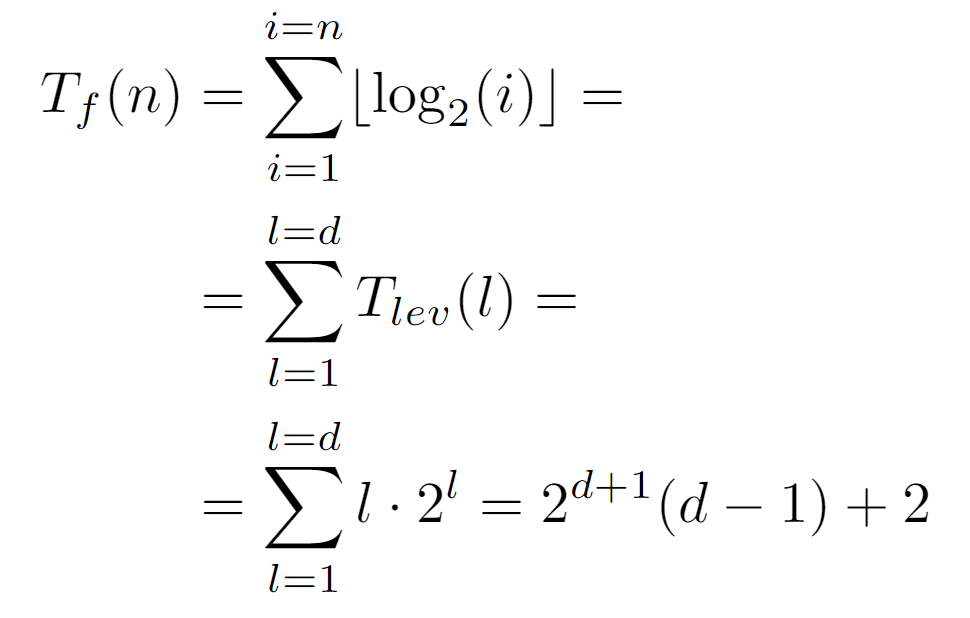
By rewriting the sum as a function of the levels from 0 to the depth, we arrive at the above expression, which can be concretized by defining the relationship between d and the total number of nodes n:

Since n is the label of the last node, floor(log_2(n)) guarantees to return the value of the last level, which in turn coincides with the depth d. Thus, by the above formulation of the complete cost Tf(n) we conclude with the following tight bound:

At this point, it is worth trying to simplify it, so that it is featured by a simpler expression. For this reason, we proceed to calculate its ratio with the previous upper bounds, which will mainly show the difference between both in case they are asymptotically equivalent, or diverge in the opposite case (although it could also converge to 0).
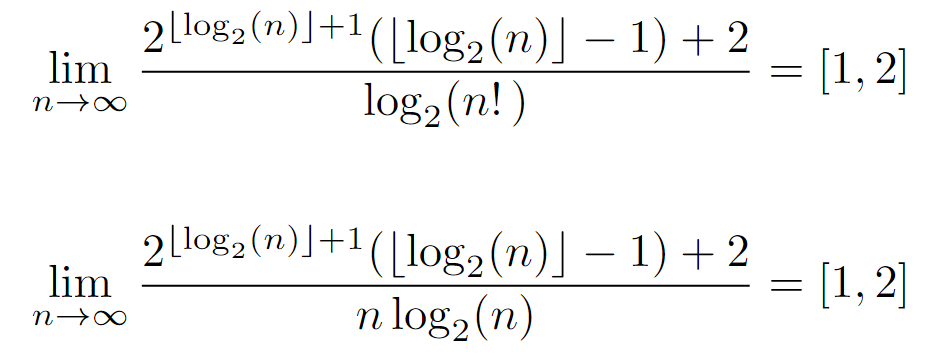
Nevertheless, the limits of the ratio produce the same result for both upper bounds, being asymptotically equivalent. And, as they lie on a real interval, it can be inferred that the tight bound is equivalent to the upper one, at least asymptotically, since the ratio indicates a negligible difference at infinity.

Finally, the time complexity of the algorithm is determined by the top order, which can be achieved in several ways as we will see below. Before continuing, though, it is worth noting the relationship between the two expressions found for the tight bound. While the latter depends directly on the number of nodes, the original one can be formed by rewriting the one shown above replacing n by the number of nodes at the last level, which contributes to a better understanding of the dependence between the runtime and the properties of the data structure involved.
Approach 2
Another way to proceed with the analysis is by defining each value contained in the input array:

Each one is identified by a concrete evaluation P(i), from which the following constraint can be inferred:

By representing P(i) an ascent in the tree, any input bounded by [0,n] that can be provided to the function will always return a result present in the same interval, which leads to the formalization of the traversal performed by the while loop and whereby we will achieve Tw(i):

At the beginning of the traversal, any node i is chosen, ascending to its parent P(i), then to its ancestor P(P(i)) and so on until reaching the root with label 1. Actually, the loop stops when reaching the “node” L[0], however, here it is considered that it stops at the root, since the difference in cost will be constant. So, above we formalize this process by composing P(i) a variable number of times, which as we know coincides with the length of the path to the root, can be set equal to the node’s level l.

With this approach, the cost Tw(i) is defined as the level of the input node, which can also be acquired by finding the integer that satisfies the upper equality.
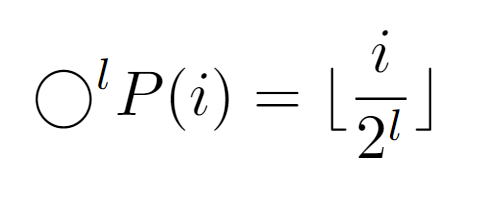
At this point, when obtaining the integer l that causes the repeated composition to result in 1, we first apply the properties of the floor function to describe the composition in a closed form. Also, it is demonstrable that the composition of the function P results in the above expression.
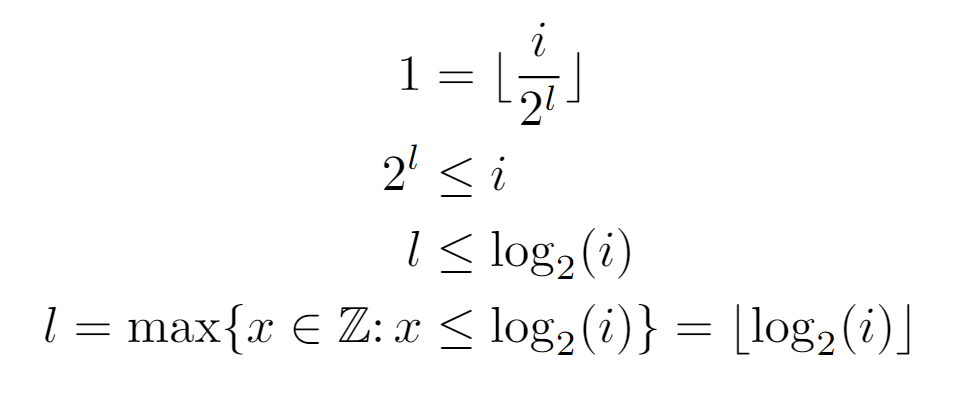
Thereafter, by definition of the floor function, an inequality is established between the closed form of the composition and the outcome it should reach. That is, the equality dictates that after l compositions exactly the value of the root is reached, although, since the argument of the floor may be greater than 1, we proceed from the inferred inequality. Finally, we conclude with an expression for the level of a certain node i, which we will use to find Tf(n), and hence the complexity.
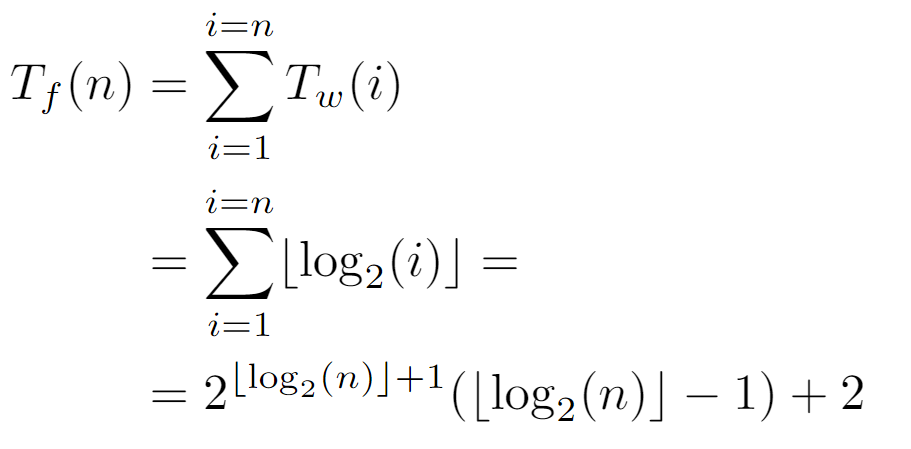
When replacing Tw(i) by the level of node i, the summation produced is equivalent to the one solved in the previous analysis, so the final expression is also equivalent.

Ultimately, the tight bound derived from this procedure is of order nlog(n), coinciding with the previously inferred one. In turn, it may also be rewritten as a function of tree’s depth, which in certain situations becomes helpful.
Approach 3
Lastly, we will explore an alternate way to perform this analysis and acquire the prior asymptotic bound. In this case, we shall start from the label i of a parent node stored in the array. This label at low level is represented as a positive integer, specifically in base 2. Therefore, its binary form can be denoted as follows:

On one hand, it is defined as the sum of the products of the bits by their value in the corresponding base, which in a compact format is formalized as a group of bits whose subscript denotes such value.

Each of the bits is an integer 0 or 1, whose subscript belongs to the interval of the integers comprised between 0 and B(i)-1, where B(i) is the function that returns the length of the binary representation of the integer i.

As for its formulation, it remains proven that the number of bits needed to describe an integer in base 2 is given by the above equality. A priori, the logarithmic term is identical to the expression describing the level at which node i is located, so we can begin to elucidate the rest of the procedure.

To calculate Tw(i), it is necessary to account for the effect of P(i) on the binary representation of the node label. Simply put, the label resulting from the repeated application of P(i) must be 1, or in this case for simplicity 0. Therefore, by dividing the label by 2 and applying the floor function, it can be guaranteed that in binary the equivalent of this function is a shift operation to the right. So, after B(i) shifts, the resulting label will be 0, concluding the path of the while loop and incurring a cost proportional to floor(log_2(i))+1.
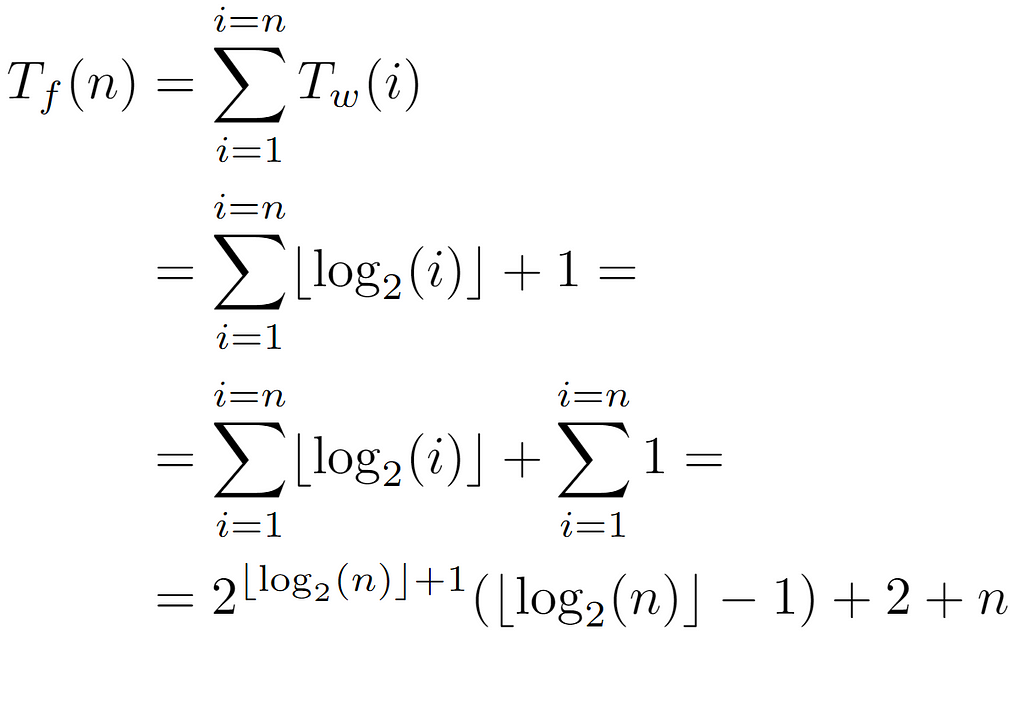
Likewise, when substituting B(i) in the sum of the overall cost, in this analysis we end up with an additional term n, which, being smaller than the final value, is asymptotically negligible.

In conclusion, with this procedure the same tight bound is deduced, keeping the runtime cost of the algorithm classified by the order nlog(n).
Time Measurements
Finally, after the theoretical analysis, experimental measurements will be collected of the time it takes to finish the algorithm for inputs of different sizes, in order to show how well or poorly the runtime growth matches the tight bound.
data = Flatten[
   ParallelTable[
    Table[{n,
      AbsoluteTiming[TreeIteration[GenerateTree[n]]][[1]]}, {index, 0,
       n}], {n, 1, 300}], 1];
To this end, several Wolfram functions are used in the measurement process. The most significant of these is AbsoluteTiming[], which records the time in seconds it took to run the algorithm with a tree consisting of n nodes. Here, we do not select values of n that are powers of 2, we simply consider that the input is a complete tree instead of a perfect one in order to observe how the execution time grows in relation to the number of nodes. Then, measurements are taken for n from 1 to 300, performing n runs for each corresponding number of nodes.
nonlinearModel = NonlinearModelFit[points, a*x*Log[x], {a}, x]
ListPlot[{points, Table[{x, nonlinearModel[x]}, {x, 0, 300}]},
 PlotStyle -> {Red, Green}, ImageSize -> Large,
 AxesLabel -> {"n", "Time (s)"}]
Afterwards, a fitting model of the form c*nlog(n) is defined in which c represents a constant used as a parameter, adjusting its value to the measurement dataset as dictated by the NonLinearModelFit[] function.

Once the model has been fitted, the top outcome is generated, the interpretation of which is significantly more meaningful when plotted against the data points:
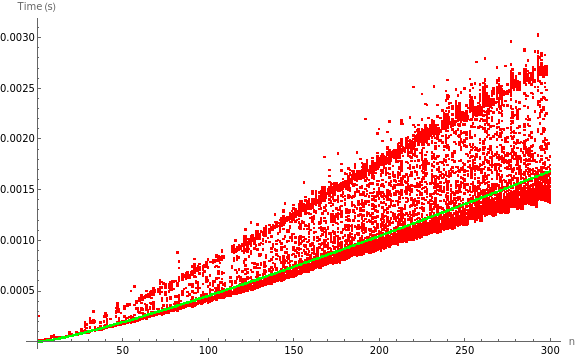
As seen, the dataset shows some variability due to practical interferences in the measurement process. However, the growth as n is increased is clearly similar to an order nlog(n), which is also remarkable in comparison with the location of the model, being situated in a zone somewhat lower than the average between the two regions that visibly show a higher density of measurements.

Finally, with the previous fitting results and an adjusted R² of 0.934551, it can be concluded that the model correctly captures the growth trend of the dataset. Though, its variability translates into a slight uncertainty in the value of the c constant.
Conclusion
The formal analysis of the algorithm characterizes the asymptotic growth of its execution time by the order Θ(nlog(n)). Such bound has been calculated from three different approaches, although all of them are based on the same idea of determining the depth of each tree node. In the first one, the level was used as the depth measure, which is equivalent to the number of times P(i) must compose with itself to reach the label of the root node, and, in turn, to the number of bits needed to represent the label of the initial node i in binary.
Also, as a final note, it is worth mentioning that most of the Wolfram code involved in this analysis was generated by the GPT-4o model from ChatGPT.
Time Complexity Analysis of Perfect Binary Tree Traversal was originally published in Towards Data Science on Medium, where people are continuing the conversation by highlighting and responding to this story.
Originally appeared here:
Time Complexity Analysis of Perfect Binary Tree Traversal
Go Here to Read this Fast! Time Complexity Analysis of Perfect Binary Tree Traversal
