
How to use network science and Python to map out the popular show
The second season of Arcane, a recent blockbuster series on Netflix based on the universe of one of the most popular online video games ever, League of Legends, is set in a fantasy world with heavy steampunk design, closed with astonishing visuals and a record-breaking budget. As a good network and data scientist with a particular interest in turning pop cultural items into data visualization, this was all I needed after finishing the closing season to map out the hidden connections and turn the storyline of Arcane into a network visualization — using Python. Hence, by the end of this tutorial, you will have hands-on skills on how to create and visualize the network behind Arcane.
However, these skills and methods are absolutely not specific to this story. In fact, they highlight the general approach network science provides to map out, design, visualize, and interpret networks of any complex system. These systems can range from transportation and COVID-19 spreading network patterns to brain networks to various social networks, such as that of the Arcane series.
All images created by the author.
1. Collecting the list of characters
Since here we are going to map out the connections behind all characters, first, we need to get a list of each character. For this, the Arcane fan wiki site is an excellent source of free-to-use information (CC BY-SA 3.0), which we can easily access by simple web scraping techniques. Namely, we will use urllib to download, and with BeautifulSoup, we will extract the names and fan wiki profile URLs of each character listed on the main character page.
First downloading the character listing site’s html:
import urllib
import bs4 as bs
from urllib.request import urlopen


url_char = 'https://arcane.fandom.com/wiki/Category:Characters'

sauce = urlopen(url_char).read()
soup  = bs.BeautifulSoup(sauce,'lxml')
Then, I extracted all the potentially relevant names. One can easily figure out what tags to feed the parsed html stored in the ‘soup’ variable by just right-clicking on a desired element (in this case, a character profile) and selecting the element inspection option in any browser.
From this, I learned that the name and url of a character are stored in a line which has ‘title=’ in it, but does not contain ‘:’ (which corresponds to categories). Additionally, I created a still_character flag, which helped me decide which subpages on the character listing page still belong to legitimate characters of the story.
import re

chars = soup.find_all('li')
still_character = True
names_urls = {}

for char in chars:

    if '" title="' in str(char) and ':' not in char.text and still_character:

        char_name = char.text.strip().rstrip()

        if char_name == 'Arcane':
            still_character = False

        char_url = 'https://arcane.fandom.com' + re.search(r'href="([^"]+)"', str(char)).group(1)

        if still_character:
            names_urls[char_name] = char_url
The previous code block will create a dictionary (‘names_urls’) which stores the name and url of each character as key-value pairs. Now let’s have a quick look at what we have and print the name-url dictionary and the total length of it:
for name, url in names_urls.items():
    print(name, url)
A sample of the output from this code block, where we can text each link — pointing to the biography profile of each character:

print(len(names_urls))
Which code cell returns the result of 67, implying the total number of named characters we have to deal with. This means we are already done with the first task — we have a comprehensive list of characters as well as easy access to their full textual profile on their fan wiki sites.
2. Collecting profiles
To map out the connections between two characters, we figure out a way to quantify the relationship between each two characters. To capture this, I rely on how frequently the two character’s biographies reference each other. On the technical end, to achieve this, we will need to collect these complete biographies we just got the links to. We will get that again using simple web scraping techniques, and then save the source of each site in a separate file locally as follows.
# output folder for the profile htmls
import os
folderout = 'fandom_profiles'
if not os.path.exists(folderout):
    os.makedirs(folderout)

# crawl and save the profile htmls
for ind, (name, url) in enumerate(names_urls.items()):
    if not os.path.exists(folderout + '/' + name + '.html'):
        fout = open(folderout + '/' + name + '.html', "w")
        fout.write(str(urlopen(url).read()))
        fout.close()
By the end of this section, our folder ‘fandom_profiles’ should contain the fanwiki profiles of each Arcane character — ready to be processed as we work our way towards building the Arcane network.
3. The Arcane network
To build the network between characters, we assume that the intensity of interactions between two characters is signaled by the number of times each character’s profile mentions the other. Hence, the nodes of this network are the characters, which are linked with connections of varying strength based on the number of times each character’s wiki site source references any other character’s wiki.
Building the network
In the following code block, we build up the edge list — the list of connections that contains both the source and the target node (character) of each connection, as well as the weight (co-reference frequency) between the two characters. Additionally, to conduct the in-profile search effectively, I create a names_ids which only contains the specific identifier of each character, without the rest of the web address.
# extract the name mentions from the html sources
# and build the list of edges in a dictionary
edges = {}
names_ids  = {n : u.split('/')[-1] for n, u in names_urls.items()}

for fn in [fn for fn in os.listdir(folderout) if '.html' in fn]:

    name = fn.split('.html')[0]

    with open(folderout + '/' + fn) as myfile:
        text = myfile.read()
        soup  = bs.BeautifulSoup(text,'lxml')
        text = ' '.join([str(a) for a in soup.find_all('p')[2:]])
        soup = bs.BeautifulSoup(text,'lxml')


        for n, i in names_ids.items():

            w = text.split('Image Gallery')[0].count('/' + i)
            if w>0:
                edge = 't'.join(sorted([name, n]))
                if edge not in edges:
                    edges[edge] = w
                else:
                    edges[edge] += w

len(edges)
As this code block runs, it should return around 180 edges.
Next, we use the NetworkX graph analytics library to turn the edge list into a graph object and output the number of nodes and edges the graph has:
#  create the networkx graph from the dict of edges
import networkx as nx
G = nx.Graph()
for e, w in edges.items():
    if w>0:
        e1, e2 = e.split('t')
        G.add_edge(e1, e2, weight=w)

G.remove_edges_from(nx.selfloop_edges(G))

print('Number of nodes: ', G.number_of_nodes())
print('Number of edges: ', G.number_of_edges())
The output of this code block:

This output tells us that while we started with 67 characters, 16 of them ended up not being connected to anyone in the network, hence the smaller number of nodes in the constructed graph.
Visualizing the network
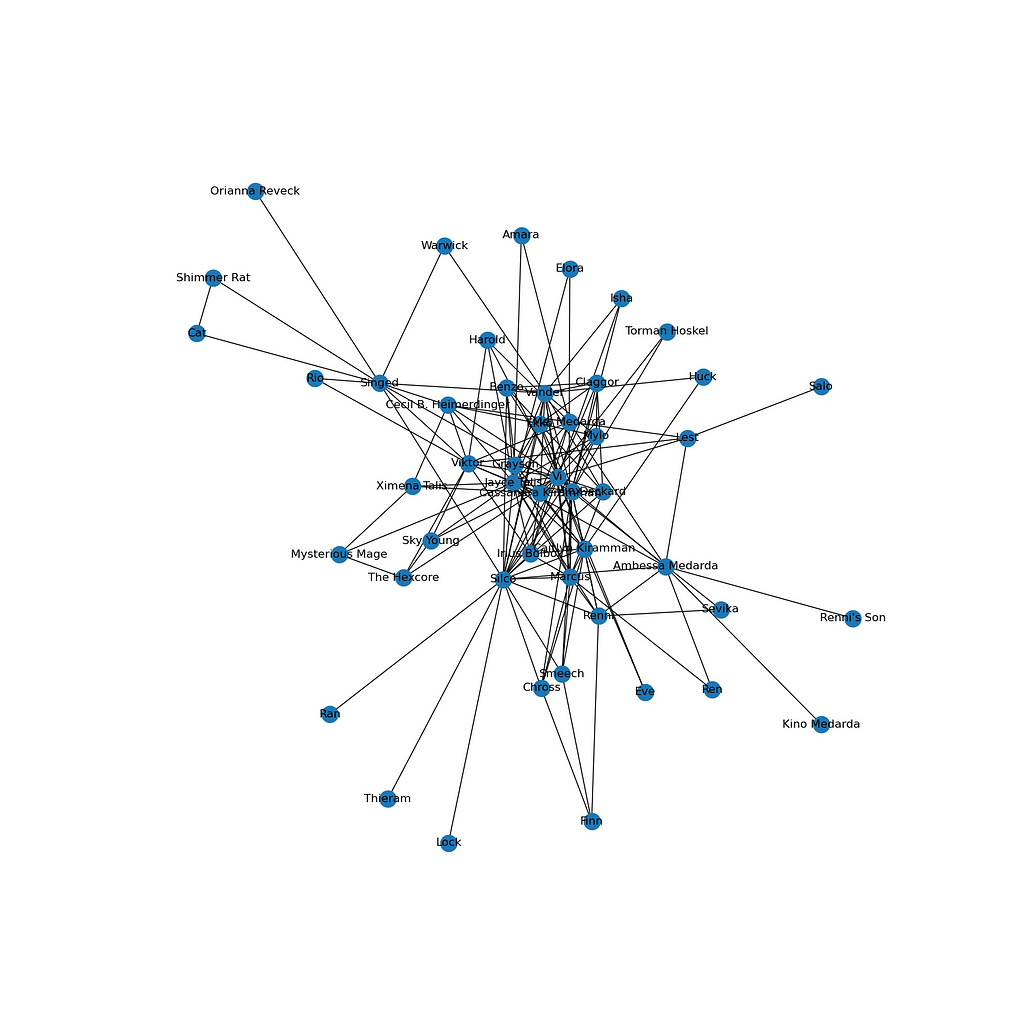
Once we have the network, we can visualize it! First, let’s create a simple draft visualization of the network using Matplotlib and the built-in tools of NetworkX.
# take a very brief look at the network
import matplotlib.pyplot as plt
f, ax = plt.subplots(1,1,figsize=(15,15))
nx.draw(G, ax=ax, with_labels=True)
plt.savefig('test.png')
The output image of this cell:

While this network already gives a few hints about the main structure and most frequent characteristics of the show, we can design a much more detailed visualization using the open-source network visualization software Gephi. For this, we need to export the network into a .gexf graph data file first, as follows.
nx.write_gexf(G, 'arcane_network.gexf')
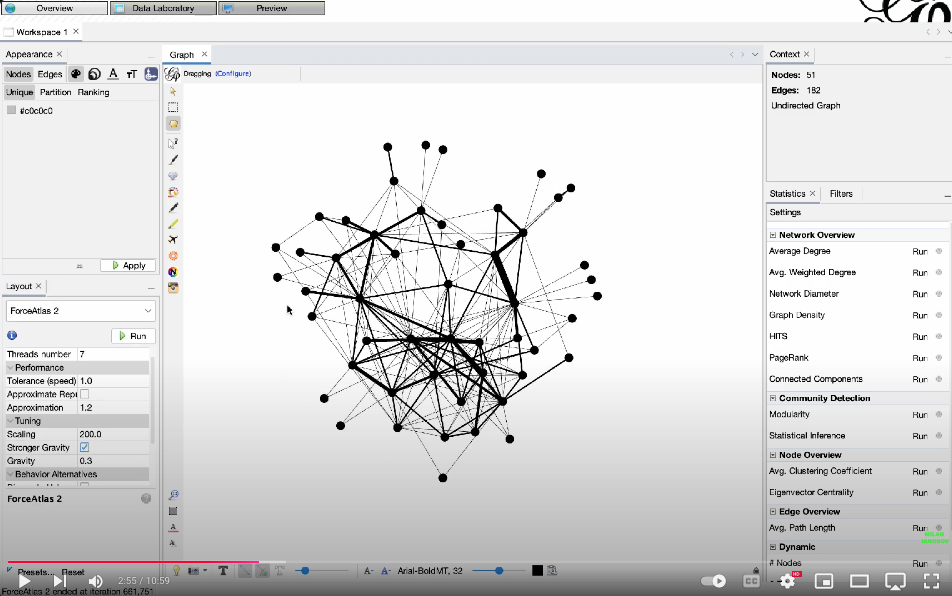
Now, the tutorial on how to visualize this network using Gephi:

Extras
Here comes an extension part, which I am referring to in the video. After exporting the node table, including the network community indices, I read that table using Pandas and assigned individual colors to each community. I got the colors (and their hex codes) from ChatGPT, asking it to align with the main color themes of the show. Then, this block of code exports the color—which I again used in Gephi to color the final graph.
import pandas as pd
nodes = pd.read_csv('nodes.csv')

pink = '#FF4081'
blue = '#00FFFF'
gold = '#FFD700'
silver = '#C0C0C0'
green = '#39FF14'

cmap = {0 : green,
        1 : pink,
        2 : gold,
        3 : blue,
    }

nodes['color'] = nodes.modularity_class.map(cmap)
nodes.set_index('Id')[['color']].to_csv('arcane_colors.csv')
Summary
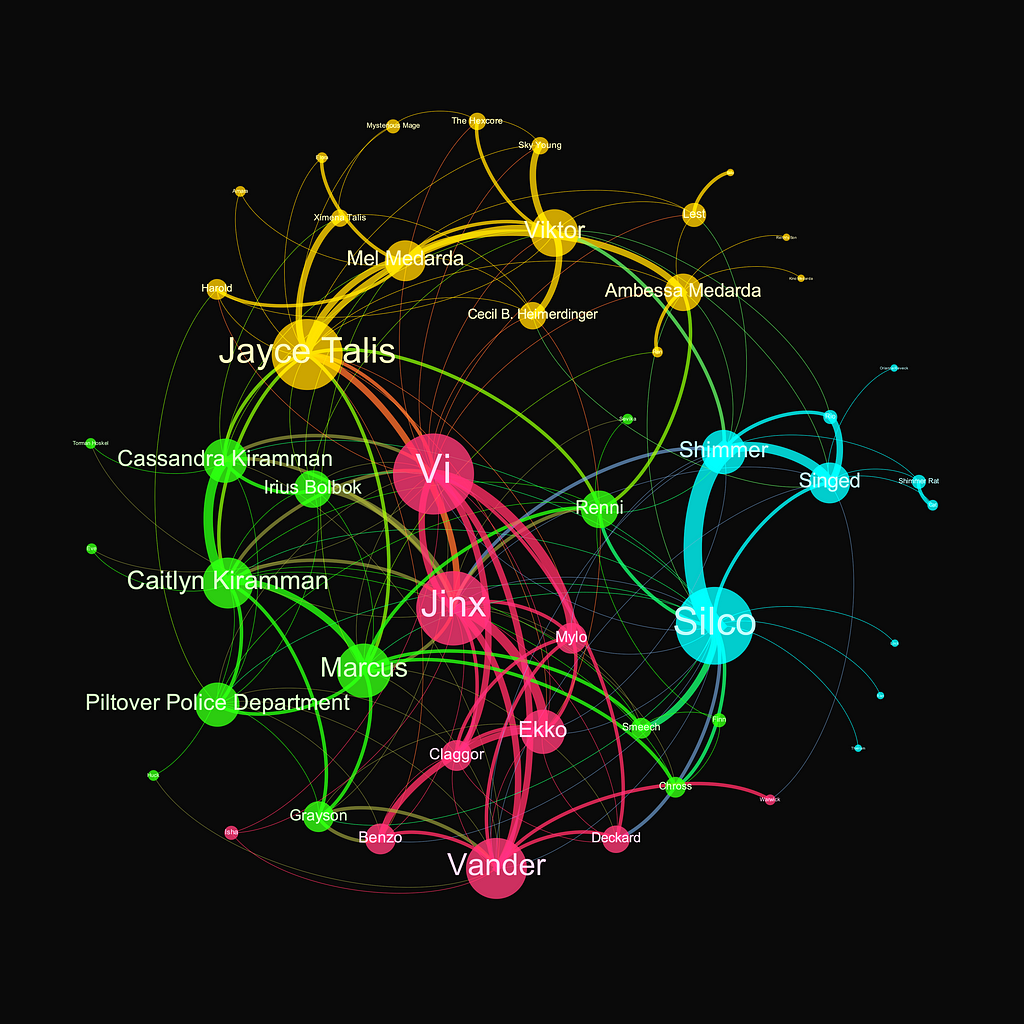
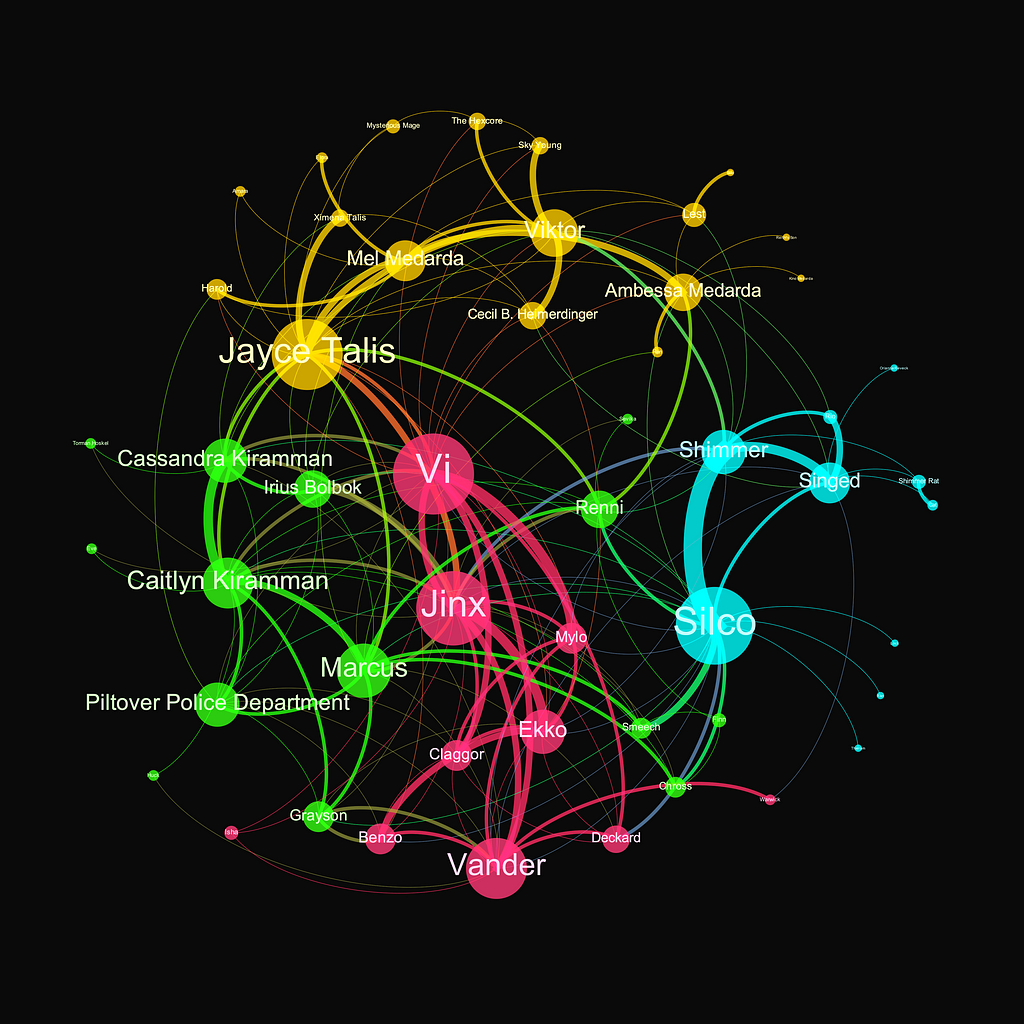
As we color the network based on the communities we found (communities meaning highly interconnected subgraphs of the original network), we uncovered four major groups, each corresponding to specific sets of characters within the storyline. Not so surprisingly, the algorithm clustered together the main protagonist family with Jinx, Vi, and Vander (pink). Then, we also see the cluster of the underground figures of Zaun (blue), such as Silco, while the elite of Piltover (blue) and the militarist enforce (green) are also well-grouped together.
The beauty and use of such community structures is that while such explanations put it in context very easily, usually, it would be very hard to come up with a similar map only based on intuition. While the methodology presented here clearly shows how we can use network science to extract the hidden connections of virtual (or real) social systems, let it be the partners of a law firm, the co-workers of an accounting firm, and the HR department of a major oil company.
The Arcane Network was originally published in Towards Data Science on Medium, where people are continuing the conversation by highlighting and responding to this story.
Originally appeared here:
The Arcane Network
