including 4 ways to make them and 2 ways to style them
Inset axes are a powerful data visualization technique to highlight specific plot regions or add detailed subplots. They are a great way to make effective use of otherwise-emtpy figure space.
This tutorial shows 4 methods to create inset axes in matplotlib, which let you position insets relative to an axes, to an overall, figure, in absolute units (i.e., inches), or using a grid system — the latter useful in particular when working with multiple insets.
We’ll also cover 2 ways to style zoom insets: with classic leader lines and with color-coded overlays.

At the end of this tutorial, you will be able to determine which approach best meets your needs —and have some code you can copy/paste to make it happen.
Here’s what we’ll cover.
Creating inset axes:
- predefined axes-level location codes: mpl_toolkits.axes_grid1.inset_axes,
- manual placement with axes-level coordinates: Axes.inset_axes, and
- manual placement with figure-level coordinates: Figure.add_axes;
- multi-inset auto-layout:Axes.inset_axes with outset.layout_corner_insets.
Adding zoom indicators:
5. leader lines: Axes.indicate_inset_zoom and
6. color-coded overlays: OutsetGrid.marqueeplot.
Sections 4 and 6 make use new tools from the open source outset library for multi-scale data visualization, which I recently released and am excited to share with the community.
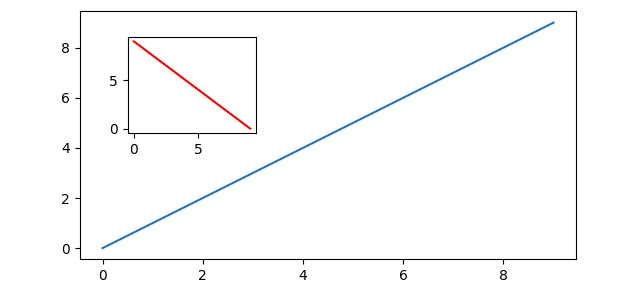
Method 1: Using `mpl_toolkits.axes_grid1.inset_axes`
This function simplifies adding insets. Here’s how to use it, including an explanation of the `loc` parameter for positioning:
import matplotlib.pyplot as plt
from mpl_toolkits.axes_grid1.inset_locator import inset_axes

fig, ax = plt.subplots(); ax.set_box_aspect(0.5)  # main figure and axes
ax.plot([0, 9], [0, 9])  # example plot

# create inset axes & plot on them
inset_ax = inset_axes(ax, width="30%", height=1.2, loc="upper left")
inset_ax.plot([9, 0], [0, 9], color="r")
plt.xticks([]); plt.yticks([])  # strip ticks, which collide w/ main ax
Note that axes size can be specified relative to parent axes or in inches, as shown here with width and height, respectively.

Supported location codes for loc are as follows,
"upper right" | "upper left" | "lower left" | "lower right"
"right" | "center left" | "center right" | "lower center"
"upper center" | "center"
Method 2: Using `Axes.inset_axes`
Matplotlib’s Axes class provides the inset_axes member function, which is a straightforward way to create insets relative to the parent axes:
import matplotlib.pyplot as plt

fig, ax = plt.subplots(); ax.set_box_aspect(0.5)  # main figure and axes
ax.plot([0, 9], [0, 9])  # example plot

# create inset axes & plot on them
ins_ax = ax.inset_axes([.6, .15, .3, .3])  # [x, y, width, height] w.r.t. ax
ins_ax.plot([9, 0], [0, 9], color="r")
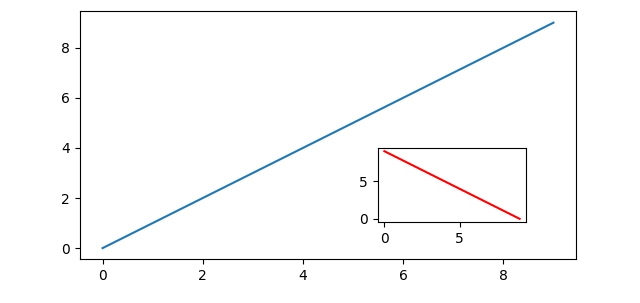
Coordinates are specified relative to the parent axes, so — for example — (0, 0, 0.5, 0.2) will create an axes in the lower left-hand corner with width that takes up half of axes width and height that takes up 0.2 of axes height.
To position an inset relative to a parent axes ax in terms of inches, we must first calculate the size of the parent axes in inches.
w_inch, h_inch = ax.figure.get_size_inches() * ax.get_position().size
Then, pass your x, y, w, and h in inches to Axes.inset_axes as follows
ax.inset_axes([x/w_inch, y/h_inch, w/w_inch, h/h_inch])
Method 3: Using `Figure.add_axes`
Matplotlib’s Figure class provides an analogous add_axes member function, which lets you position insets relative to the overall figure.
import matplotlib.pyplot as plt

fig, ax = plt.subplots(); ax.set_box_aspect(0.5)  # main figure and axes
ax.plot([0, 9], [0, 9])  # example plot

# create inset axes & plot on them
ins_ax = fig.add_axes([.2, .5, .2, .2])  # [x, y, width, height] w.r.t. fig
ins_ax.plot([9, 0], [0, 9], color="r")
Similarly to before, coordinates will be specified relative to the parent axes, so — for example — (0.5, 0.5, 0.3, 0.2) will create an axes 2/10ths the height of the overall figure and 3/10ths the width with the lower left corner centered within the figure.
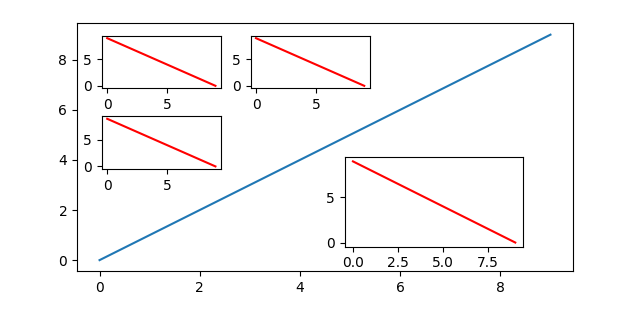
Method 4: `Axes.inset_axes` with `outset.layout_corner_insets`
For this next example, we will use the outset library, which provides specialized tools for working with inset axes in matplotlib. It can be installed as python3 -m pip install outset.
The outset library provides the flexible outset.util.layout_corner_insets utility to position multiple inset axes within a specified corner of a main axes. Here’s how to use it to pick positions for calls to Axes.inset_axes.
import matplotlib.pyplot as plt
import outset

fig, ax = plt.subplots(); ax.set_box_aspect(0.5)  # main figure and axes
ax.plot([0, 9], [0, 9])  # example plot

# ------ pick inset axes positions: 3 in upper left, one in lower right
inset_positions = outset.util.layout_corner_insets(  # upper left positions
    3, "NW", # number insets and corner to position in
    # optional layout tweaks...
    inset_pad_ratio=(.2,.35), inset_grid_size=(.6,.65), inset_margin_size=.05)
inset_positions.append(  # generate lower right position & tack on to list
    outset.util.layout_corner_insets(1, "SE", inset_grid_size=.4))

# ----- create inset axes & plot on them
inset_axes = [*map(ax.inset_axes, inset_positions)]  # create inset axes
for iax in inset_axes:  # example plot
  iax.plot([9, 0], [0, 9], color="r")
Note the optional customizations to inset positioning made through keyword arguments to outset.util.layout_corner_insets. Here, “pad” refers to spacing between insets, “margin” refers to space between the insets and the main axes, and “grid size” refers to the overall fraction of axes space that insets are stacked into.
That covers it for techniques to place inset axes!
A common use case for inset axes is to provide magnification of an area of interest within the main plot. Next, we’ll look at two ways to visually correspond magnifying insets with a region of the main plot.
Method 5: Zoom Indicator Leaders
A classic approach depicting zoom relationships draws connecting lines between the corners of the inset axes and the region it is magnifying. This works especially well when plotting small numbers of insets.
Matplotlib’s Axes includes the indicate_inset_zoom member function for this purpose. Here’s how to use it.
from math import isclose; import matplotlib.pyplot as plt

# set up main fig/axes
fig, main_ax = plt.subplots(); main_ax.set_box_aspect(0.5)
inset_ax = main_ax.inset_axes(
   [0.05, 0.65, 0.3, 0.3],  # [x, y, width, height] w.r.t. axes
    xlim=[4, 5], ylim=[4, 5], # sets viewport & tells relation to main axes
    xticklabels=[], yticklabels=[]
)

# add plot content
for ax in main_ax, inset_ax:
    ax.plot([0, 9], [0, 9])  # first example line
    ax.plot([0, 9], [1, 8])  # second example line

# add zoom leaders
main_ax.indicate_inset_zoom(inset_ax, edgecolor="blue")

# careful! warn if aspect ratio of inset axes doesn't match main axes
if not isclose(inset_ax._get_aspect_ratio(), main_ax._get_aspect_ratio()):
    print("chosen inset x/ylim & width/height skew aspect w.r.t. main axes!")
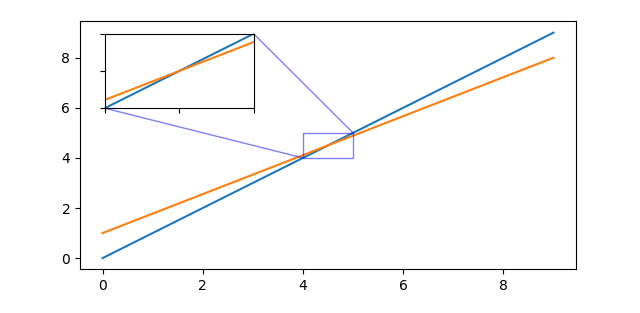
Note that to use Axes.indicate_inset_zoom, inset axes must be created using Axes.inset_axes.
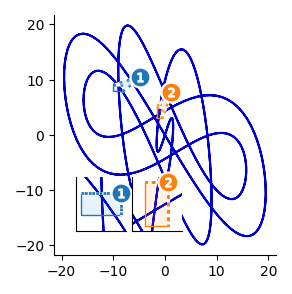
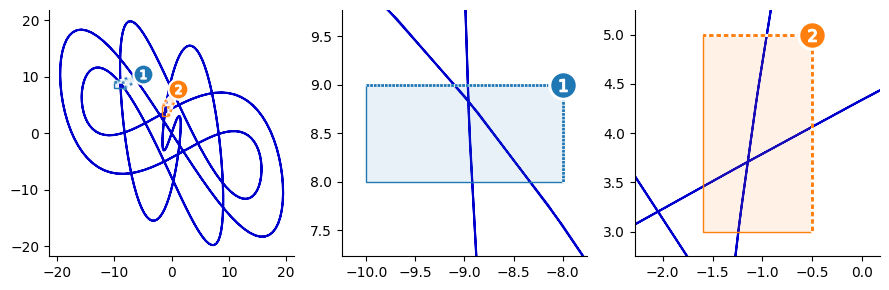
Method 6: Zoom Indicator Overlays
When working with larger numbers of insets, it may work better to correspond regions with numbered, color-coded highlights instead of leader lines.
The outset library’s OutsetGrid provides a marqueeplot member function for this purpose. Under this scheme, inset positioning is handled by outset.inset_outsets. Here’s how to create a zoom plot with color-coded position overlays.
from matplotlib import pyplot as plt
import numpy as np
import outset

# example adapted from https://matplotlib.org/stable/gallery/
i, a, b, c, d = np.arange(0.0, 2 * np.pi, 0.01), 1, 7, 3, 11

# 3 axes grid: source plot and two zoom frames
grid = outset.OutsetGrid([  # data coords for zoom sections...
     (-10, 8, -8, 9), (-1.6, 5, -0.5, 3)])  # ...as (x0, y0, x1, y1)
grid.broadcast(plt.plot,  # run plotter over all axes
    # subsequent kwargs go to the plotter
    np.sin(i * a) * np.cos(i * b) * 20,  # line coords
    np.sin(i * c) * np.cos(i * d) * 20,  # line coords
    c="mediumblue",  zorder=-1,  # line styling
)

# position insets over the source plot into lower/left ("SW") corner
outset.inset_outsets(grid, insets="SW")

grid.marqueeplot()  # render overlay annotations
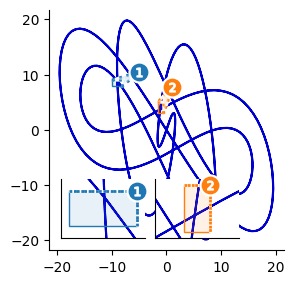
Note that inset positioning can be more finely controlled via outset.util.layout_corner_insets, as used for Method 4 above:
...  # as before

customized_placements = outset.util.layout_corner_insets(
    2, "SW",  # 2 insets into the lower left corner
    inset_margin_size=0.05, inset_grid_size=(0.8, 0.55)  # layout params
)
outset.inset_outsets(grid, insets=customized_placements)
grid.marqueeplot()  # render overlay annotations
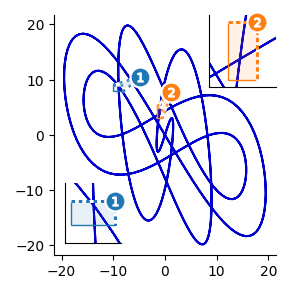
Inset placements can also be manually specified to outset.inset_outsetsusing axes-relative coordinates, too:
...  # as before

outset.inset_outsets(grid, insets=[
    (0.05, 0.05, 0.25, 0.25),  # two insets, with axes-relative coords...
    (0.7, 0.7, 0.3, 0.3),    # ...specified (x0, y0, width, height)
])
grid.marqueeplot()  # render overlay annotations
And, finally, to use bigger, side-by-side magnification panels instead of insets, just omit the call to outset.inset_outsets.
Conclusion
Inset axes are a great way to take your matplotlib visualizations to the next level, whether you’re looking to highlight specific data regions or add detailed subplots.
Here, we’ve covered the variety of approaches at your disposal, both built in to matplotlib and using the outset library. Each method offers unique advantages, ensuring a good fit for nearly any inset plotting scenario.
Now go make something informative and beautiful! Happy plotting 🙂
Further Information
matplotlib has some excellent inset example materials that are well worth checking out. In particular,
outset also provides some good example materials, notably one on zoom plots over rain guage time series data. outset also provides a useful quickstart guide and gallery page.
Formal argument-by-argument listings for all code covered here can be found in the API documentation pages for outset and matplotlib.
Both projects are open source on GitHub, matplotlib under a PSF license at matplotlib/matplotlib and outset under the MIT License at mmore500/outset — outset is a new project, consider leaving a ⭐️!
Joseph Early also has an excellent medium article on inset axes in matplotlib, which you can read here.
Authorship
This tutorial is contributed by me, Matthew Andres Moreno.

I currently serve as a postdoctoral scholar at the University of Michigan, where my work is supported by the Eric and Wendy Schmidt AI in Science Postdoctoral Fellowship, a Schmidt Futures program.
My appointment is split between the university’s Ecology and Evolutionary Biology Department, the Center for the Study of Complexity, and the Michigan Institute for Data Science.
Find me on Twitter as @MorenoMatthewA and on GitHub as @mmore500.
disclosure: I am the author of the outset library.
Citations
J. D. Hunter, “Matplotlib: A 2D Graphics Environment”, Computing in Science & Engineering, vol. 9, no. 3, pp. 90–95, 2007. https://doi.org/10.1109/MCSE.2007.55
Matthew Andres Moreno. (2023). mmore500/outset. Zenodo. https://doi.org/10.5281/zenodo.10426106
Appendix
To install dependencies for code snippets in this article,
python3 -m pip install
    matplotlib `# ==3.8.2`
    numpy `# ==1.26.2`
    outset `# ==0.1.8`
All images are works of the author.
A Comprehensive Guide to Inset Axes in Matplotlib was originally published in Towards Data Science on Medium, where people are continuing the conversation by highlighting and responding to this story.
Originally appeared here:
A Comprehensive Guide to Inset Axes in Matplotlib
Go Here to Read this Fast! A Comprehensive Guide to Inset Axes in Matplotlib