

How confident should I be in a machine learning model’s prediction for a new data point? Could I get a range of likely values?
When working on a supervised task, machine learning models can be used to predict the outcome for new samples. However, it is likely that the prediction from a new data point is incorrect. This is particularly true for a regression task where the outcome may take an infinite number of values.
In order to get a more insightful prediction, we may be interested in (or even need) a prediction interval instead of a single point. Well informed decisions should be made by taking into account uncertainty. For instance, as a property investor, I would not offer the same amount if the prediction interval is [100000–10000 ; 100000+10000] as if it is [100000–1000 ; 100000+1000] (even though the single point predictions are the same, i.e. 100000). I may trust the single prediction for the second interval but I would probably take a deep dive into the first case because the interval is quite wide, so is the profitability, and the final price may significantly differs from the single point prediction.
Prediction interval vs confidence interval
Before continuing, I first would like to clarify the difference between these two definitions. It was not obvious for me when I started to learn conformal prediction. Since I may not be the only one being confused, this is why I would like to give additional explanation.
- A (1-α) confidence interval [1] is an interval based on 2 statistics, ŝ_{lb} and ŝ_{ub}, which has a probability greater than (1-α) to contain the actual parameter that we try to estimate. Here θ is a parameter (not a random variable).
ℙ([ŝ_{lb} ; ŝ_{ub}] ∋ θ) ≥ 1-α
- A (1-α) prediction interval [2] is an interval based on 2 statistics, ŝ_{lb} and ŝ_{ub}, which has the following property: the target random variable has a probability greater than (1-α) of being inside this prediction interval. Here Y is a random variable (not a parameter).
ℙ(Y∈[ŝ_{lb} ; ŝ_{ub}]) ≥ (1-α)
Let’s consider an example to illustrate the difference. Let’s consider a n-sample of parent distribution N(μ, σ²). ŝ is the unbiased estimator of σ. <Xn> is the mean of the n-sample. I noted q the 1-α/2 quantile of the Student distribution of n-1 degree of freedom (to limit the length of the formula).
- The symmetric confidence interval for μ is:
[<Xn>-q*ŝ/√(n) ; <Xn>+q*ŝ/√(n)]
- The symmetric prediction interval for X(n+1), a (n+1)th random variable from the same distribution N(μ, σ²), is:
[<Xn>-q*ŝ*√(1+1/n)) ; <Xn>+q*ŝ*√(1+1/n)]
Now that we have clarified these definitions, let’s come back to our goal: design insightful prediction intervals to make well informed decisions. There are many ways to design prediction intervals [2] [3]. We are going to focus on conformal predictions [4].
Conformal predictions
Conformal prediction has been introduced to generate prediction intervals with weak theoretical guarantees. It only requires that the points are exchangeable, which is weaker than i.i.d. assumption (independent and identically distributed random variables). There is no assumption on the data distribution nor on the model. By splitting the data between a training and a calibration set, it is possible to get a trained model and some non-conformity scores that we could use to build a prediction interval on a new data point (with theoretical coverage guarantee provided that the exchangeability assumption is true).
Let’s now consider an example. I would like to get some prediction intervals for house prices. I have considered the house_price dataset from OpenML [5]. I have used the library MAPIE [6] that implements conformal predictions. I have trained a model (I did not spend some time optimizing it since it is not the purpose of the post). I have displayed below the prediction points and intervals for the test set as well as the actual price.
There are 3 subplots:
– The 1st one displays the single point predictions (blue points) as well as the predictions intervals (vertical blue lines) against the true value (on abscissa). The red diagonal is the identity line. If a vertical line crosses the red line, the prediction interval does contain the actual value, otherwise it does not.
– The 2nd one displays the prediction interval widths.
– The 3rd one displays the global and local coverages. The coverage is the ratio between the number of samples falling inside the prediction intervals divided by the total number of samples. The global coverage is the ratio over all the points of the test set. The local coverages are the ratios over subsets of points of the test set. The buckets are created by means of quantiles of the actual prices.
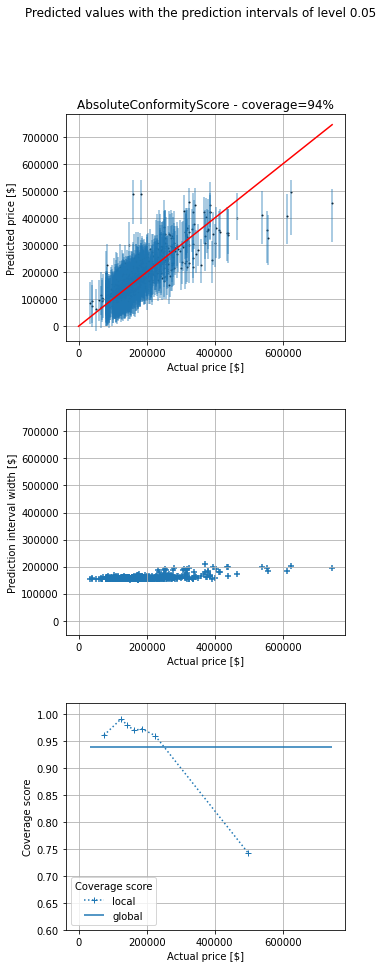
We can see that prediction width is almost the same for all the predictions. The coverage is 94%, close to the chosen value 95%. However, even though the global coverage is (close to) the desired one, if we look at (what I call) the local coverages (coverage for a subset of data points with almost the same price) we can see that coverage is bad for expensive houses (expensive regarding my dataset). Conversely, it is good for cheap ones (cheap regarding my dataset). However, the insights for cheap houses are really poor. For instance, the prediction interval may be [0 ; 180000] for a cheap house, which is not really helpful to make a decision.
Instinctively, I would like to get prediction intervals which width is proportional to the prediction value so that the prediction widths scale to the predictions. This is why I have looked at other non conformity scores, more adapted to my use case.
Conformal predictions with custom non conformity score
Even though I am not a real estate expert, I have some expectations regarding the prediction intervals. As said previously, I would like them to be, kind of, proportional to the predicted value. I would like a small prediction interval when the price is low and I expect a bigger one when the price is high.
Consequently, for this use case I am going to implement two non conformity scores that respect the conditions that a non conformity score must fulfill [7] (3.1 and Appendix C.). I have created two classes from the interface ConformityScore which requires to implement at least two methods get_signed_conformity_scores and get_estimation_distribution. get_signed_conformity_scores computes the non conformity scores from the predictions and the observed values. get_estimation_distribution computes the estimated distribution that is then used to get the prediction interval (after providing a chosen coverage). I decided to name my first non conformity score PoissonConformityScore because it is intuitively linked to the Poisson regression. When considering a Poisson regression, (Y-μ)/√μ has 0 mean and a variance of 1. Similarly, for the TweedieConformityScore class, when considering a Tweedie regression, (Y-μ)/(μ^(p/2)) has 0 mean and a variance of σ² (which is assumed to be the same for all observations). In both classes, sym=False because the non conformity scores are not expected to be symmetrical. Besides, consistency_check=False because I know that the two methods are consistent and fulfill the necessary requirements.
import numpy as np

from mapie._machine_precision import EPSILON
from mapie.conformity_scores import ConformityScore
from mapie._typing import ArrayLike, NDArray

class PoissonConformityScore(ConformityScore):
    """
    Poisson conformity score.

    The signed conformity score = (y - y_pred) / y_pred**(1/2).
    The conformity score is not symmetrical.
    y must be positive
    y_pred must be strictly positive

    This is appropriate when the confidence interval is not symmetrical and
    its range depends on the predicted values.
    """

    def __init__(
        self,
    ) -> None:
        super().__init__(sym=False, consistency_check=False, eps=EPSILON)

    def _check_observed_data(
        self,
        y: ArrayLike,
    ) -> None:
        if not self._all_positive(y):
            raise ValueError(
                f"At least one of the observed target is strictly negative "
                f"which is incompatible with {self.__class__.__name__}. "
                "All values must be positive."
            )

    def _check_predicted_data(
        self,
        y_pred: ArrayLike,
    ) -> None:
        if not self._all_strictly_positive(y_pred):
            raise ValueError(
                f"At least one of the predicted target is negative "
                f"which is incompatible with {self.__class__.__name__}. "
                "All values must be strictly positive."
            )

    @staticmethod
    def _all_positive(
        y: ArrayLike,
    ) -> bool:
        return np.all(np.greater_equal(y, 0))

    @staticmethod
    def _all_strictly_positive(
        y: ArrayLike,
    ) -> bool:
        return np.all(np.greater(y, 0))

    def get_signed_conformity_scores(
        self,
        X: ArrayLike,
        y: ArrayLike,
        y_pred: ArrayLike,
    ) -> NDArray:
        """
        Compute the signed conformity scores from the observed values
        and the predicted ones, from the following formula:
        signed conformity score = (y - y_pred) / y_pred**(1/2)
        """
        self._check_observed_data(y)
        self._check_predicted_data(y_pred)
        return np.divide(np.subtract(y, y_pred), np.power(y_pred, 1 / 2))

    def get_estimation_distribution(
        self, X: ArrayLike, y_pred: ArrayLike, conformity_scores: ArrayLike
    ) -> NDArray:
        """
        Compute samples of the estimation distribution from the predicted
        values and the conformity scores, from the following formula:
        signed conformity score = (y - y_pred) / y_pred**(1/2)
        <=> y = y_pred + y_pred**(1/2) * signed conformity score

        ``conformity_scores`` can be either the conformity scores or
        the quantile of the conformity scores.
        """
        self._check_predicted_data(y_pred)
        return np.add(y_pred, np.multiply(np.power(y_pred, 1 / 2), conformity_scores))
class TweedieConformityScore(ConformityScore):
    """
    Tweedie conformity score.

    The signed conformity score = (y - y_pred) / y_pred**(p/2).
    The conformity score is not symmetrical.
    y must be positive
    y_pred must be strictly positive

    This is appropriate when the confidence interval is not symmetrical and
    its range depends on the predicted values.
    """

    def __init__(self, p) -> None:
        self.p = p
        super().__init__(sym=False, consistency_check=False, eps=EPSILON)

    def _check_observed_data(
        self,
        y: ArrayLike,
    ) -> None:
        if not self._all_positive(y):
            raise ValueError(
                f"At least one of the observed target is strictly negative "
                f"which is incompatible with {self.__class__.__name__}. "
                "All values must be positive."
            )

    def _check_predicted_data(
        self,
        y_pred: ArrayLike,
    ) -> None:
        if not self._all_strictly_positive(y_pred):
            raise ValueError(
                f"At least one of the predicted target is negative "
                f"which is incompatible with {self.__class__.__name__}. "
                "All values must be strictly positive."
            )

    @staticmethod
    def _all_positive(
        y: ArrayLike,
    ) -> bool:
        return np.all(np.greater_equal(y, 0))

    @staticmethod
    def _all_strictly_positive(
        y: ArrayLike,
    ) -> bool:
        return np.all(np.greater(y, 0))

    def get_signed_conformity_scores(
        self,
        X: ArrayLike,
        y: ArrayLike,
        y_pred: ArrayLike,
    ) -> NDArray:
        """
        Compute the signed conformity scores from the observed values
        and the predicted ones, from the following formula:
        signed conformity score = (y - y_pred) / y_pred**(1/2)
        """
        self._check_observed_data(y)
        self._check_predicted_data(y_pred)
        return np.divide(np.subtract(y, y_pred), np.power(y_pred, self.p / 2))

    def get_estimation_distribution(
        self, X: ArrayLike, y_pred: ArrayLike, conformity_scores: ArrayLike
    ) -> NDArray:
        """
        Compute samples of the estimation distribution from the predicted
        values and the conformity scores, from the following formula:
        signed conformity score = (y - y_pred) / y_pred**(1/2)
        <=> y = y_pred + y_pred**(1/2) * signed conformity score

        ``conformity_scores`` can be either the conformity scores or
        the quantile of the conformity scores.
        """
        self._check_predicted_data(y_pred)
        return np.add(
            y_pred, np.multiply(np.power(y_pred, self.p / 2), conformity_scores)
        )
I have then taken the same example as previously. In addition to the default non conformity scores, that I named AbsoluteConformityScore in my plot, I have also considered these two additional non conformity scores.
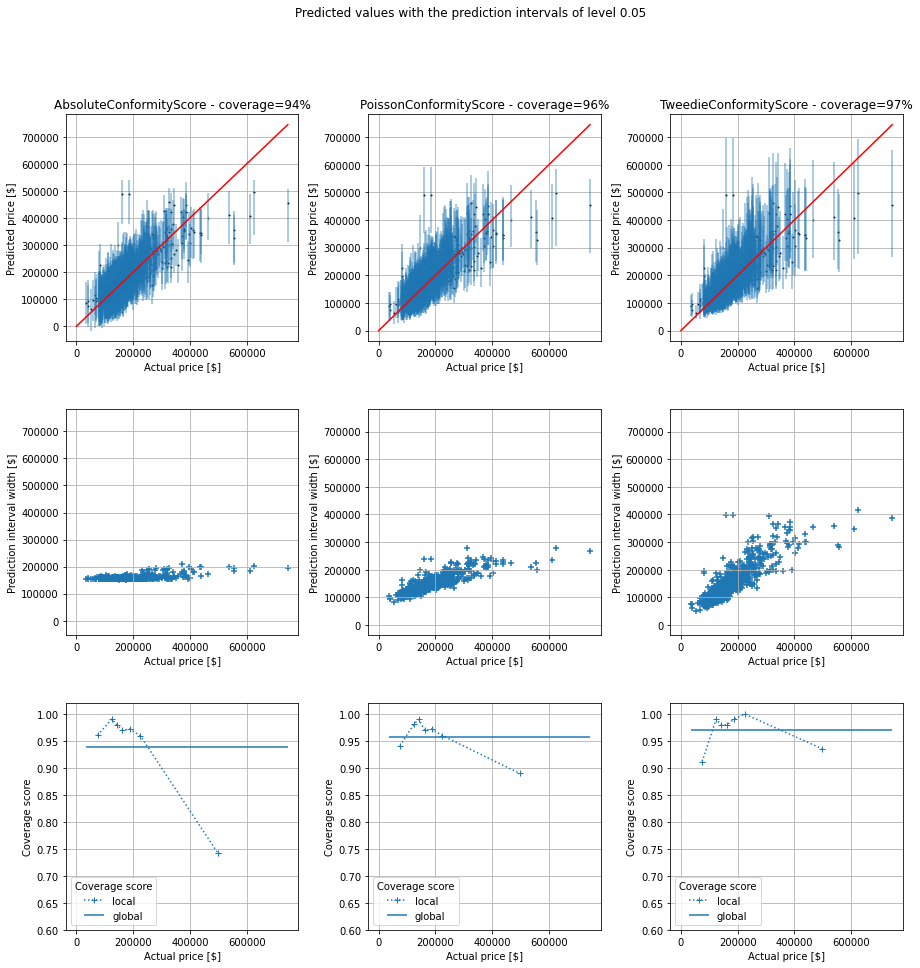
As we can see, the global coverages are all close to the chosen one, 95%. I think the small variations are due to luck during the random split between the training set and test one. However, the prediction interval widths differ significantly from an approach to another, as well as the local coverages. Once again, I am not a real estate expert, but I think the prediction intervals are more realistic for the last non conformity score (3rd column in the figure). For the new two non conformity scores, the prediction intervals are quite narrow (with a good coverage, even if slightly below 95%) for cheap houses and they are quite wide for expensive houses. This is necessary to (almost) reach the chosen coverage (95%). Our new prediction intervals from the TweedieConformityScore non conformity socre have good local coverages over the entire range of prices and are more insightful since prediction intervals are not unnecessarily wide.
Conclusion
Prediction intervals may be useful to make well informed decisions. Conformal prediction is a tool, among others, to build predictions intervals with theoretical coverage guarantee and only a weak assumption (data exchangeability). When considering the commonly used non conformity score, even though the global coverage is the desired one, local coverages may significantly differ from the chosen one, depending on the use case. This is why I finally considered other non conformity scores, adapted to the considered use case. I showed how to implement it in the conformal prediction library MAPIE and the benefits of doing so. An appropriate non conformity score helps to get more insightful prediction intervals (with good local coverages over the range of target values).
References
- Confidence interval – Wikipedia
- Prediction interval – Wikipedia
- Prediction Intervals in Machine Learning
- Conformal prediction – Wikipedia
- OpenML
- GitHub – scikit-learn-contrib/MAPIE: A scikit-learn-compatible module for estimating prediction intervals.
Adapted Prediction Intervals by Means of Conformal Predictions and a Custom Non-Conformity Score was originally published in Towards Data Science on Medium, where people are continuing the conversation by highlighting and responding to this story.
Originally appeared here:
Adapted Prediction Intervals by Means of Conformal Predictions and a Custom Non-Conformity Score