Emulating the various PlayStation consoles has been commonplace for years, and developers constantly try to do so on various platforms. On Monday, the developers of PS3 emulator RPCS3 released a teaser on YouTube showing how their emulator runs on arm64 hardware, specifically on a Raspberry Pi 5. In an announcement post, they also showcased the emulator running on Apple M1 chips. All told, the emulator can now run on arm64 chips across Windows, Mac and Linux.
If you aren’t familiar with RPCS3, it’s the emulator Atlus tried to take down around Persona 5’s release in 2017. In Atlus’ defense, the developers name-dropped Persona on its Patreon page. Patreon took the RPCS3 developers’ side but asked them to remove all references to Persona titles.
It’s surprising that a PS3 emulator even runs on a Raspberry Pi 5, which isn’t a gaming powerhouse. Through some wizardry, the RPCS3 team was able to push the hardware to its limit. The framerate is locked to a maximum of 30FPS, and the graphics look like they come straight out of a PlayStation Portable screen, which is a 480p display from 20 years ago. The developers weren’t able to render those games at the PS3’s native 720p resolution. Naturally, the more powerful Apple Silicon chips will render games at a higher resolution.
Think of it this way, though. If you traveled back in time to tell people that a PSP could run PS3 games, nobody would’ve believed you. But the proof is now right here, and the teaser showed how the games didn’t experience severe frame drops. While impressive, RPCS3 isn’t the first emulator running natively on arm64 hardware, as that honor goes to Dolphin, the famous Wii and GameCube emulator.
This article originally appeared on Engadget at https://www.engadget.com/gaming/pc/ps3-emulator-rpcs3-now-runs-on-a-raspberry-pi-5-142224432.html?src=rss
Three Zero-Cost Solutions That Take Hours, Not Months
A ‘data quality’ certified pipeline. Source: unsplash.com
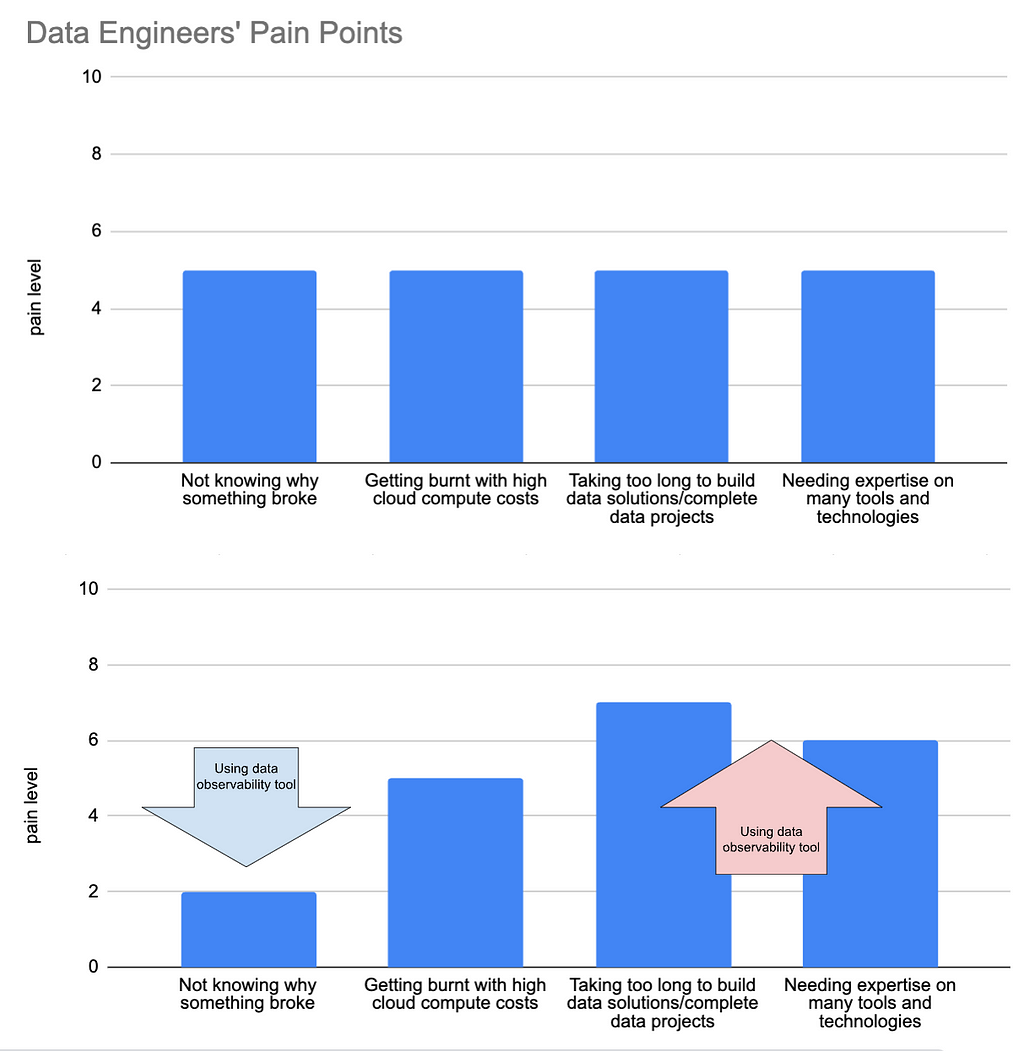
In my career, data quality initiatives have usually meant big changes. From governance processes to costly tools to dbt implementation — data quality projects never seem to want to be small.
What’s more, fixing the data quality issues this way often leads to new problems. More complexity, higher costs, slower data project releases…
Some of the most effective methods to cut down on data issues are also some of the most simple.
In this article, we’ll delve into three methods to quickly improve your company’s data quality, all while keeping complexity to a minimum and new costs at zero. Let’s get to it!
TL;DR
Take advantage of old school database tricks, like ENUM data types, and column constraints.
Create a custom dashboard for your specific data quality problem.
Generate data lineage with one small Python script.
Take advantage of old school database tricks
In the last 10–15 years we’ve seen massive changes to the data industry, notably big data, parallel processing, cloud computing, data warehouses, and new tools (lots and lots of new tools).
Consequently, we’ve had to say goodbye to some things to make room for all this new stuff. Some positives (Microsoft Access comes to mind), but some are questionable at best, such as traditional data design principles and data quality and validation at ingestion. The latter will be the subject of this section.
Firstly, what do I mean by “data quality and validation at ingestion”? Simply, it means checking data before it enters a table. Think of a bouncer outside a nightclub.
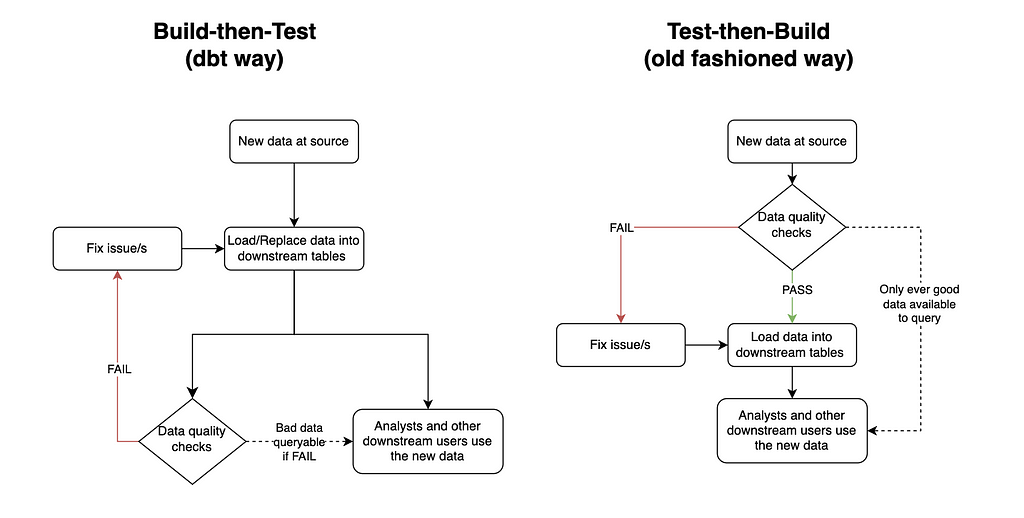
What it has been replaced with is build-then-test, which means putting new data in tables first, and then checking it later. Build-then-test is the chosen method for many modern data quality tools, including the most popular, dbt.
Dbt runs the whole data transformation pipeline first, and only once all the new data is in place, it checks to see if the data is good. Of course, this can be the optimal solution in many cases. For example, if the business is happy to sacrifice quality for speed, or if there is a QA table before a production table (coined by Netflix as Write-Audit-Publish). However, engineers who only use this method of data quality are potentially missing out on some big wins for their organization.
Testing before vs after generating tables. Created by the author using draw.io
Test-then-build has two main benefits over build-then-test.
The first is that it ensures the data in downstream tables meets the data quality standards expected at all times. This gives the data a level of trustworthiness, so often lacking, for downstream users. It can also reduce anxiety for the data engineer/s responsible for the pipeline.
I remember when I owned a key financial pipeline for a company I used to work for. Unfortunately, this pipeline was very prone to data quality issues, and the solution in place was a build-then-test system, which ran each night. This meant I needed to rush to my station early in the morning each day to check the results of the run before any downstream users started looking at their data. If there were any issues I then needed to either quickly fix the issue or send a Slack message of shame announcing to the business the data sucks and to please be patient while I fix it.
Of course, test-then-build doesn’t totally fix this anxiety issue. The story would change from needing to rush to fix the issue to avoid bad data for downstream users to rushing to fix the issue to avoid stale data for downstream users. However, engineering is all about weighing the pros and cons of different solutions. And in this scenario I know old data would have been the best of two evils for both the business and my sanity.
The second benefit test-then-build has is that it can be much simpler to implement, especially compared to setting up a whole QA area, which is a bazooka-to-a-bunny solution for solving most data quality issues. All you need to do is include your data quality criteria when you create the table. Have a look at the below PostgreSQL query:
CREATE TYPE currency_code_type AS ENUM ( 'USD', -- United States Dollar 'EUR', -- Euro 'GBP', -- British Pound Sterling 'JPY', -- Japanese Yen 'CAD', -- Canadian Dollar 'AUD', -- Australian Dollar 'CNY', -- Chinese Yuan 'INR', -- Indian Rupee 'BRL', -- Brazilian Real 'MXN' -- Mexican Peso );
CREATE TYPE payment_status AS ENUM ( 'pending', 'completed', 'failed', 'refunded', 'partially_refunded', 'disputed', 'canceled' );
CREATE TABLE daily_revenue ( id INTEGER PRIMARY KEY, date DATE NOT NULL, revenue_source revenue_source_type NOT NULL, gross_amount NUMERIC(15,2) NOT NULL CHECK (gross_amount >= 0), net_amount NUMERIC(15,2) NOT NULL CHECK (net_amount >= 0), currency currency_code_type, transaction_count INTEGER NOT NULL CHECK (transaction_count >= 0), notes TEXT,
These 14 lines of code will ensure the daily_revenue table enforces the following standards:
id
Primary key constraint ensures uniqueness.
date
Cannot be a future date (via CHECK constraint).
Forms part of a unique constraint with revenue_source.
revenue_source
Cannot be NULL.
Forms part of a unique constraint with date.
Must be a valid value from revenue_source_type enum.
gross_amount
Cannot be NULL.
Must be >= 0.
Must be >= processing_fees + tax_amount.
Must be >= net_amount.
Precise decimal handling.
net_amount
Cannot be NULL.
Must be >= 0.
Must be <= gross_amount.
Precise decimal handling.
currency
Must be a valid value from currency_code_type enum.
transaction_count
Cannot be NULL.
Must be >= 0.
It’s simple. Reliable. And would you believe all of this was available to us since the release of PostgreSQL 6.5… which came out in 1999!
Of course there’s no such thing as a free lunch. Enforcing constraints this way does have its drawbacks. For example, it makes the table a lot less flexible, and it will reduce the performance when updating the table. As always, you need to think like an engineer before diving into any tool/technology/method.
Create a custom dashboard
I have a confession to make. I used to think good data engineers didn’t use dashboard tools to solve their problems. I thought a real engineer looks at logs, hard-to-read code, and whatever else made them look smart if someone ever glanced at their computer screen.
I was dumb.
It turns out they can be really valuable if executed effectively for a clear purpose. Furthermore, most BI tools make creating dashboards super easy and quick, without (too) much time spent learning the tool.
Back to my personal pipeline experiences. I used to manage a daily aggregated table of all the business’ revenue sources. Each source came from a different revenue provider, and as such a different system. Some would be via API calls, others via email, and others via a shared S3 bucket. As any engineer would expect, some of these sources fell over from time-to-time, and because they came from third parties, I couldn’t fix the issue at source (only ask, which had very limited success).
Originally, I had only used failure logs to determine where things needed fixing. The problem was priority. Some failures needed quickly fixing, while others were not important enough to drop everything for (we had some revenue sources that literally reported pennies each day). As a result, there was a build up of small data quality issues, which became difficult to keep track of.
Enter Tableau.
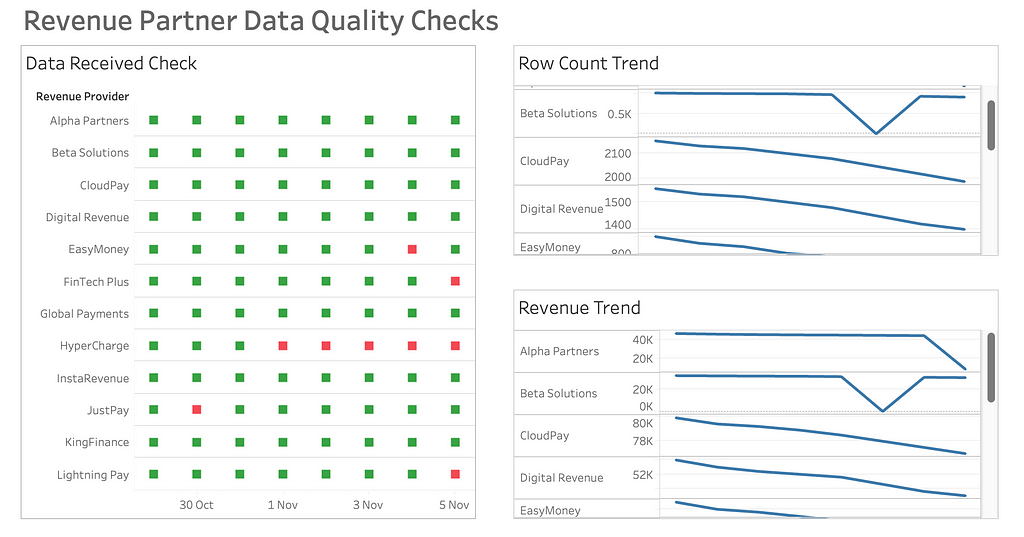
I created a very basic dashboard that highlighted metadata by revenue source and date for the last 14 days. Three metrics were all I needed:
A green or red mark indicating whether data was present or missing.
The row count of the data.
The sum of revenue of the data.
A simple yet effective dashboard. Created by the author using Tableau
This made the pipeline’s data quality a whole lot easier to manage. Not only was it much quicker for me to glance at where the issues were, but it was user-friendly enough for other people to read from too, allowing for shared responsibility.
After implementing the dashboard, bug tickets reported by the business related to the pipeline dropped to virtually zero, as did my risk of a stroke.
Map your data with a lineage chart
Simple data observability solutions don’t just stop at dashboards.
Data lineage can be a dream for quickly spotting what tables have been affected by bad data upstream.
However, it can also be a mammoth task to implement.
The number one culprit for this, in my opinion, is dbt. A key selling point of the open-source tool is its data lineage capabilities. But to achieve this you have to bow down to dbt’s framework. Including, but not limited to:
Set up a development and testing process e.g. development environment, version control, CI/CD.
Infrastructure set-up e.g. hosting your own server or purchasing a managed version (dbtCloud).
Yeah, it’s a lot.
But it doesn’t have to be. Ultimately, all you need for dynamic data lineage is a machine that scans your SQL files, and something to output a user-friendly lineage map. Thanks to Python, this can be achieved using a script with as few as 100 lines of code.
If you know a bit of Python and LLM prompting you should be able to hack the code in an hour. Alternatively, there’s a lightweight open-source Python tool called SQL-WatchPup that already has the code.
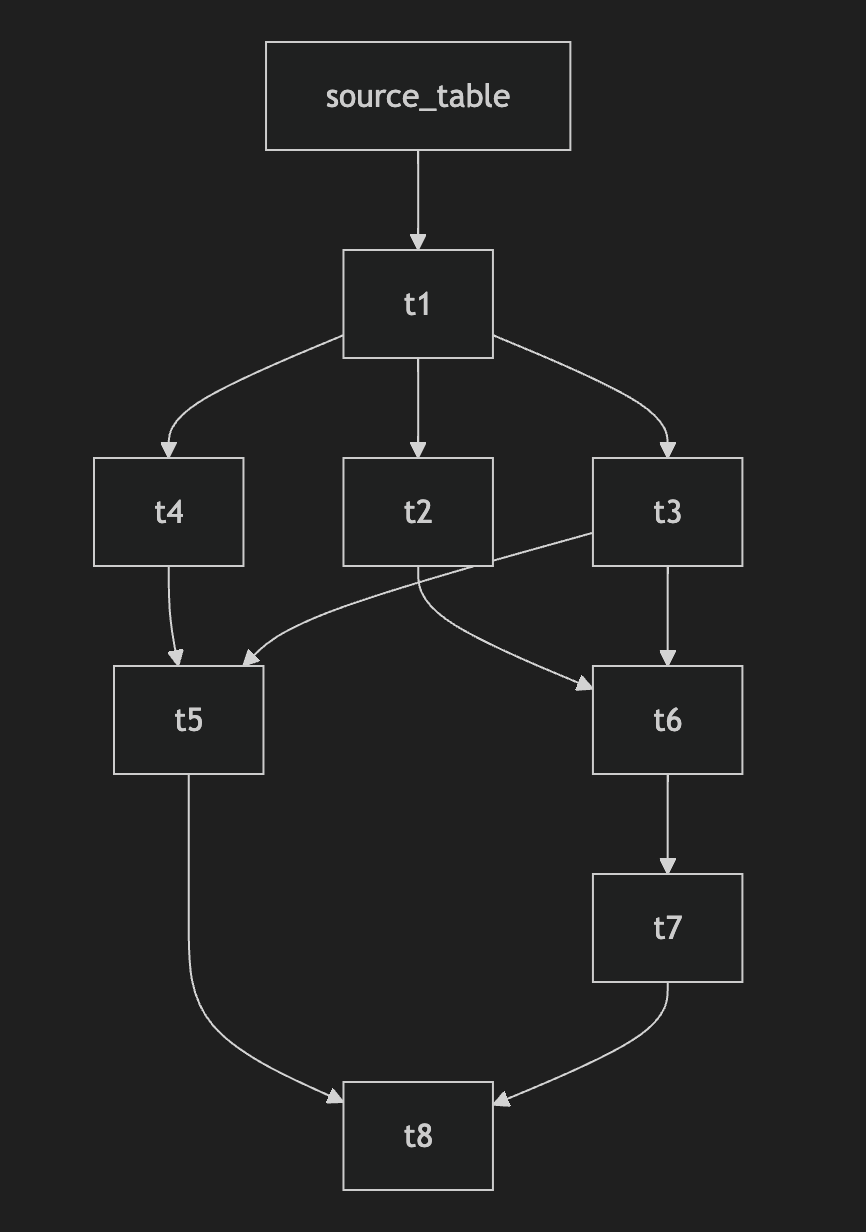
Provided you have all your SQL files available, in 15 minutes of set up you should be able to generate dynamic data lineage maps like so:
Example data lineage map output. Created by the author using SQL-WatchPup
That’s it. No server hosting costs. No extra computer languages to learn. No restructuring of your files. Just running one simple Python script locally.
Conclusion
Let’s face it — we all love shiny new in-vogue tools, but sometimes the best solutions are old, uncool, and/or unpopular.
The next time you’re faced with data quality headaches, take a step back before diving into that massive infrastructure overhaul. Ask yourself: Could a simple database constraint, a basic dashboard, or a lightweight Python script do the trick?
Your sanity will thank you for it. Your company’s budget will too.
December is a good time to think about your next career move. Your colleagues may be on a go-slow when it comes to getting projects over the line ahead of the Christmas holiday period, but for those with an eye on 2025’s job-hunting prize, this month can be a really fruitful time to look for a new opportunity. Bonnie Dilber, who is a recruiting leader at Zapier and an HR influencer on TikTok, explains why, based on her nine-plus years of hiring experience. “Basically you have a situation at the end of the year where companies may have fewer roles…
UK and Luxembourg-based startup Uplift360 has landed €1mn in pre-seed funding to scale up a greener method for recycling advanced materials like Kevlar. Uplift360’s patent-pending process breaks down Kevlar and other composites without compromising the integrity of the fibres and resins. These raw materials can then be reused to make new products. It does this using safe chemicals and at room temperature — making it greener and more energy-efficient than traditional methods, the startup claims. “It’s a game-changer,” Sam Staincliffe, Uplift360’s co-founder and CTO, told TNW in an interview. “It means we can lower costs and recycle a wide range…
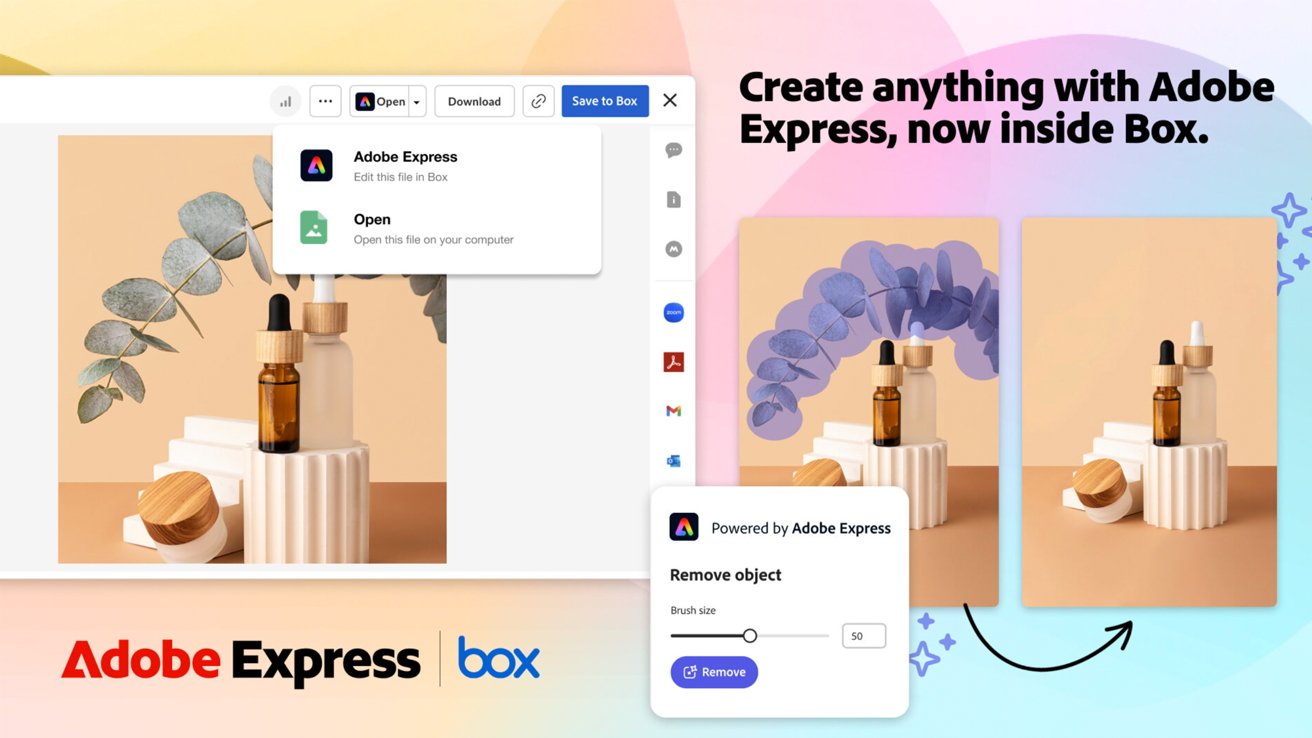
Adobe and Box have partnered to simplify business workflows for users by providing Firefly AI image editing within the Box content management environment.
Adobe teams up with Box
Users already had the option to access Box files from Adobe Creative Cloud and similar tools, but the new partnership brings an all-in-one workflow to the storage platform. Instead of exporting documents to external apps, Box users can use Adobe Express tools without leaving the app.
Box and Adobe encourage business users to take advantage of the new system with confidence. The Adobe Firefly generative AI integration claims to have been designed to be safe.
Popular Science has crowned Apple’s Apple Vision Pro as 2024’s greatest innovation, in a report that also honors everything from a transparent TV to AI-formulated vegan cheese.
Apple Vision Pro
It’s expensive to buy — and to build, too — and Apple hasn’t sold very many, plus developers are cautious about supporting it. But despite all of this, Popular Sciencehas crowned the headset the innovation of year, topping its report of 50 greatest innovations of 2024.
“In reality, 2024’s big breakthrough came from Apple in the form of its long-rumored Vision Pro headset,” says PopSci online. “The device has its own hurdles to clear, but after just a few minutes of using it, it was clear that it’s something different, important, and honestly pretty amazing.”
We use cookies on our website to give you the most relevant experience by remembering your preferences and repeat visits. By clicking “Accept”, you consent to the use of ALL the cookies.
This website uses cookies to improve your experience while you navigate through the website. Out of these, the cookies that are categorized as necessary are stored on your browser as they are essential for the working of basic functionalities of the website. We also use third-party cookies that help us analyze and understand how you use this website. These cookies will be stored in your browser only with your consent. You also have the option to opt-out of these cookies. But opting out of some of these cookies may affect your browsing experience.
Necessary cookies are absolutely essential for the website to function properly. These cookies ensure basic functionalities and security features of the website, anonymously.
Cookie
Duration
Description
cookielawinfo-checkbox-analytics
11 months
This cookie is set by GDPR Cookie Consent plugin. The cookie is used to store the user consent for the cookies in the category "Analytics".
cookielawinfo-checkbox-functional
11 months
The cookie is set by GDPR cookie consent to record the user consent for the cookies in the category "Functional".
cookielawinfo-checkbox-necessary
11 months
This cookie is set by GDPR Cookie Consent plugin. The cookies is used to store the user consent for the cookies in the category "Necessary".
cookielawinfo-checkbox-others
11 months
This cookie is set by GDPR Cookie Consent plugin. The cookie is used to store the user consent for the cookies in the category "Other.
cookielawinfo-checkbox-performance
11 months
This cookie is set by GDPR Cookie Consent plugin. The cookie is used to store the user consent for the cookies in the category "Performance".
viewed_cookie_policy
11 months
The cookie is set by the GDPR Cookie Consent plugin and is used to store whether or not user has consented to the use of cookies. It does not store any personal data.
Functional cookies help to perform certain functionalities like sharing the content of the website on social media platforms, collect feedbacks, and other third-party features.
Performance cookies are used to understand and analyze the key performance indexes of the website which helps in delivering a better user experience for the visitors.
Analytical cookies are used to understand how visitors interact with the website. These cookies help provide information on metrics the number of visitors, bounce rate, traffic source, etc.
Advertisement cookies are used to provide visitors with relevant ads and marketing campaigns. These cookies track visitors across websites and collect information to provide customized ads.