If you look up the history of Fourier analysis, you’ll see that Jean-Baptiste Joseph Fourier formalized the series that would bear his name while working on the heat flow problem.
A Fourier series represents a periodic signal as a sum of sinusoids whose frequencies are integer multiple of the fundamental frequency.
We intuitively know that a hot spot in a conductive medium will spread heat in all directions until the temperature is uniform. There is no visible oscillatory behavior in this phenomenon, neither in space nor time. Why then introduce a series of sinusoids?
The initial temperature profile, the governing differential equation, and the boundary conditions determine the evolution of the temperature function u(x, t) in the problem of a one-dimensional conductive medium such as a thin metal bar. As it turns out, the spatial frequency components of the initial temperature profile will be damped by a decaying exponential over time, with an exponential factor that grows like the square of the spatial frequency. In other words, high frequencies in the initial temperature profile decay much faster than the low frequencies, which explains the smoothing of the temperature distribution.
In this story, we will review the basics of Fourier series for a function defined on a finite domain. We’ll cast the problem such that the resulting Fourier series has some desirable properties at the domain boundaries. This approach will pay off when we apply the Fourier series to solve a problem involving differential equations with some constraints at the boundaries.
Fourier series: a tool to represent periodic functions
Fourier series can approximate periodic functions. Let g(x) be a periodic function with period 2L.
Why a period of 2L?
We are interested in functions defined on the finite domain [0, L]. We can construct a periodic function g(x) whose period is 2L from the function f(x) defined over [0, L] with some padding chosen to have desirable properties. We’ll get back to this point later.
Assuming a Fourier series exists, we can write g(x) as:
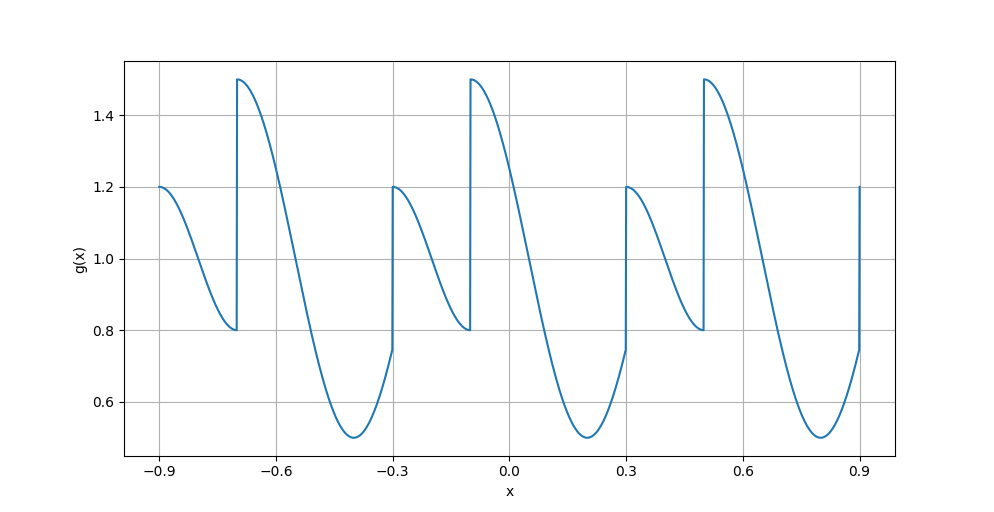
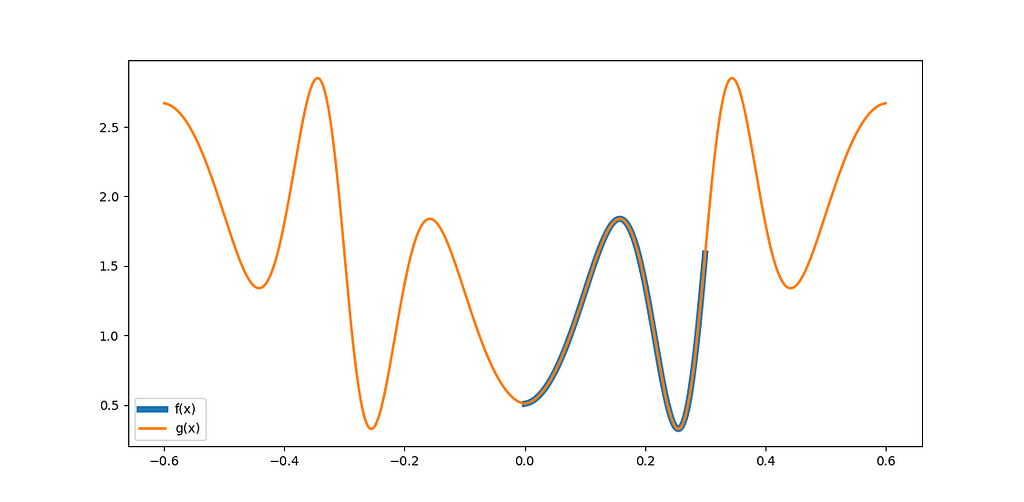
As an example, let’s consider the following periodic function g(x), with period 2L = 0.6:
Figure 1: The periodic function g(x). Image by the author.
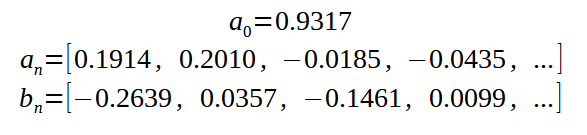
Applying equations (2), (3), (4) and using Simpson numerical integration gives the following values for a₀, aₙ, and bₙ:
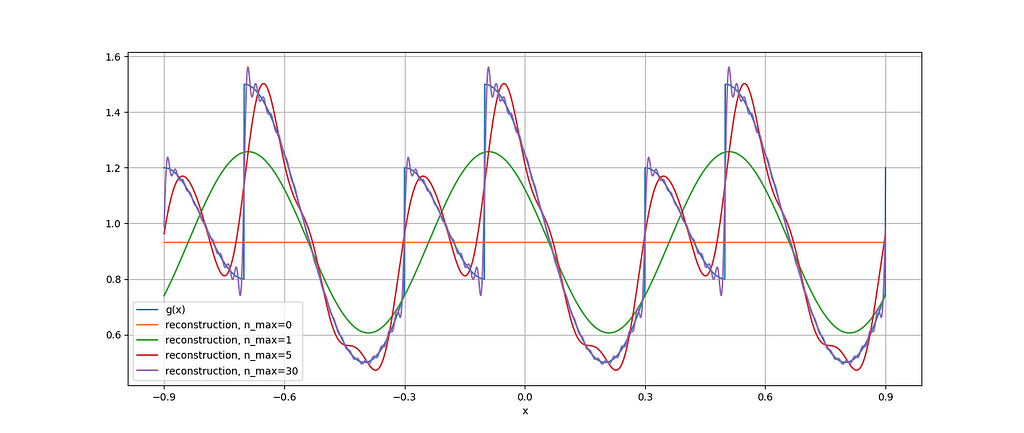
These values, the Fourier coefficients, allow us to build an approximation of g(x) with equation (1). The more terms we include in the summation, the more precise will be the approximation. Figure 2 shows a few approximations with various numbers of terms from the summation in equation (1).
Figure 2: Reconstructions of g(x) with various numbers of terms in the Fourier series. Image by the author.
We can already formulate a few observations:
Finite discontinuities in the signal are tolerable, but they generate wiggling in the reconstructed approximation. We refer to these oscillations in the neighborhood of discontinuities as the Gibbs phenomenon.
The Fourier series is the sum of an infinite number of terms, but we can truncate the summation and still have a reasonable approximation of the original function.
The original signal could be a sample of discrete points. The Fourier series can interpolate the function anywhere on the x-axis.
Functions defined on a finite domain
In engineering problems, we often encounter functions defined on a finite domain. For example, in the case of the one-dimensional temperature distribution of a conductive medium, the temperature function is defined over the [0, L] range, where L is the length of the thin metal bar. How can the Fourier series be used in this setting?
To answer this question, we first acknowledge that any periodic function g(x) that coincides with the function on interest f(x) over the range [0, L] is a valid candidate for a Fourier series representation of f(x). After all, we don’t care how the Fourier series behaves outside the [0, L] range.
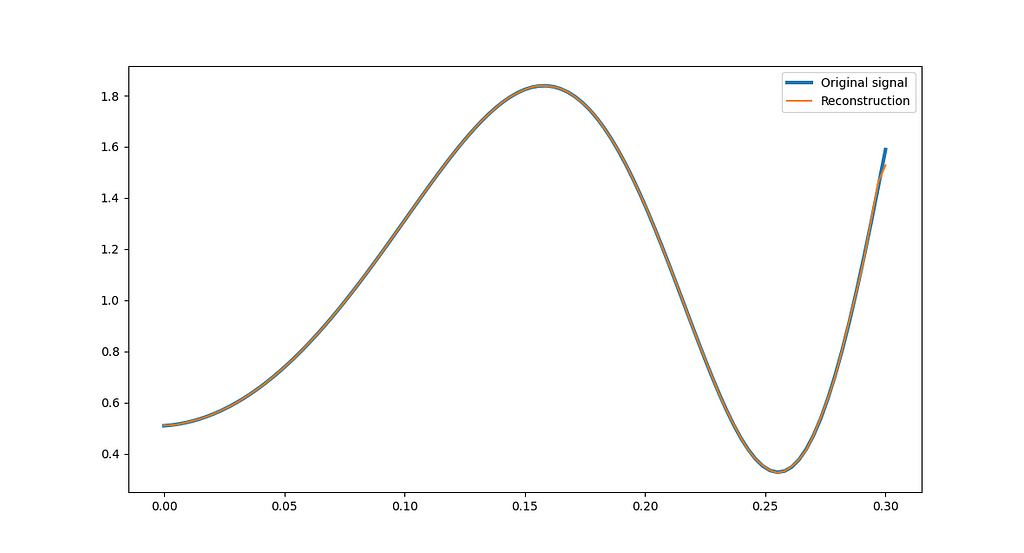
The naive periodic replication of f(x)
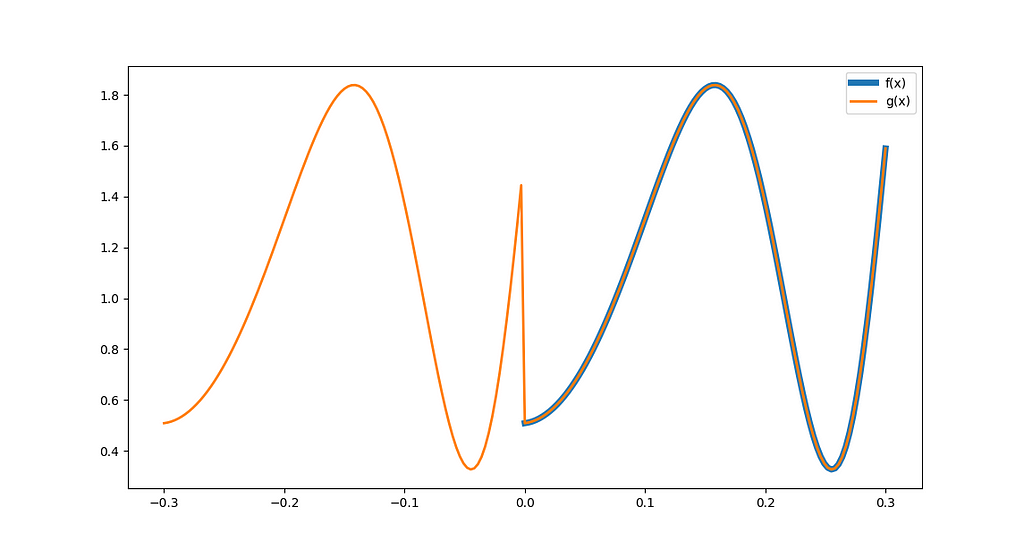
The most straightforward way to build g(x) is to replicate f(x) in the interval [-L, 0], as in figure 3:
Figure 3: f(x) defined over [0, 0.3] is replicated in the range [-0.3, 0] to build the periodic function g(x) with period 0.6. Image by the author.
The Fourier integration for the naive periodic replication of f(x) yields equations (5) to (7):
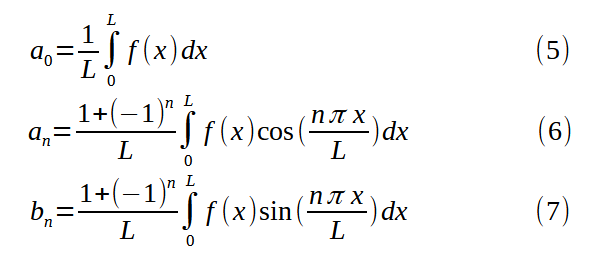
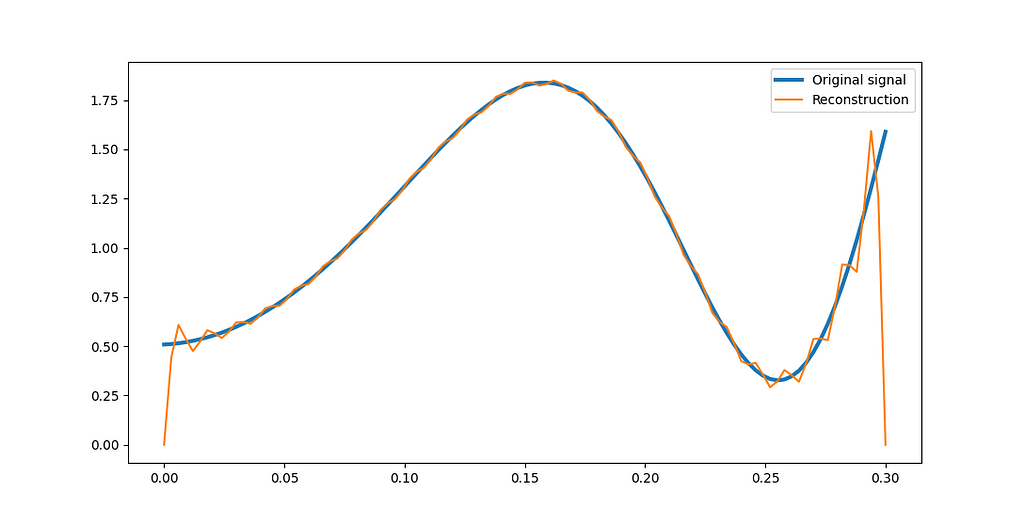
By inserting (5), (6), (7) in equation (1) to f(x) from Figure 3, we obtain the Fourier series reconstruction shown in Figure 4:
Figure 4: The function f(x) (the original signal) from Figure 3 and the Fourier series, displayed as the signal reconstruction. Image by the author.
The Fourier series closely matches the original signal, except at the range boundaries, where the reconstruction oscillates and jumps. Since we explicitly constructed a periodic signal of period L, the Fourier series interprets the transitions at x=0 and x=L as finite discontinuities.
Finite discontinuities are allowed by the Fourier series, but the Gibbs phenomenon degrades the reconstruction around the discontinuities.
For many engineering cases, this is problematic. For example, in the case of heat transfer in a thin metal bar, what happens at the bar extremities (a.k.a. the boundary conditions) is an intrinsic part of the problem description. We could have an isolated bar, which implies the temperature gradient must be 0 at both ends. Alternatively, we could have arbitrary set temperatures at x=0 and x=L. In these common scenarios, we cannot use the naive periodic replication of f(x) because the Gibbs phenomenon corrupts the signal at the ends of the range.
Even half-range expansion
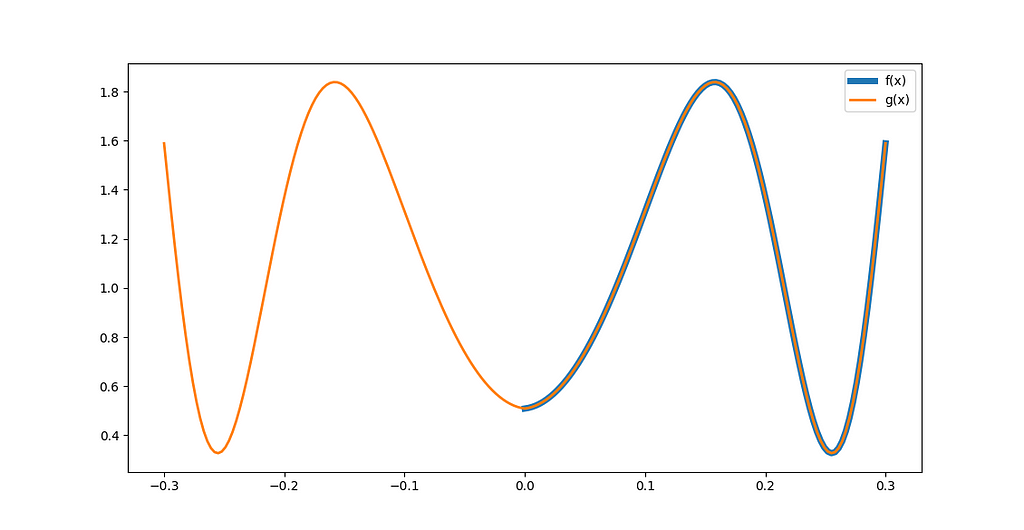
Instead of replicating f(x), we could have a flipped version of f(x) in the range [-L, 0], like in Figure 5:
Figure 5: g(x) = f(-x) in the range [-L, 0]. Image by the author.
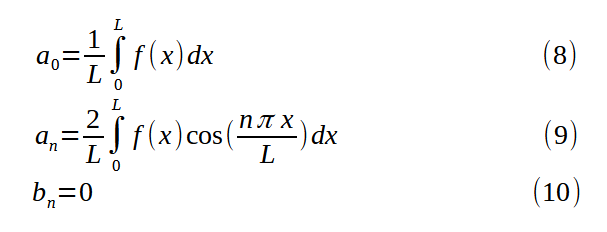
This approach eliminates the discontinuities at x=0 and x=L. The Fourier integration for the even half-range expansion of f(x) yields equations (8) to (10):
Figure 6 shows the Fourier series reconstruction of f(x):
Figure 6: The original signal and its reconstruction with even half-range expansion. Image by the author.
A feature of the even half-range expansion is the fact that g(x) being even, all bₙ coefficients (Cf. equation (10)) are 0, and thus its Fourier series is exclusively made of cosine terms. As a consequence, the derivative of the Fourier series is zero at x=0 and x=L. You can verify this by differentiating equation (1) with respect to x, with all bₙ terms set to 0.
That is what we want in a scenario where, for example, the metal bar is isolated, so there is no heat leakage at the extremities.
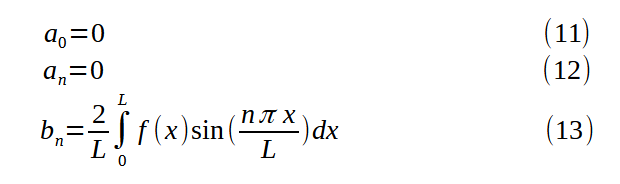
Odd half-range expansion
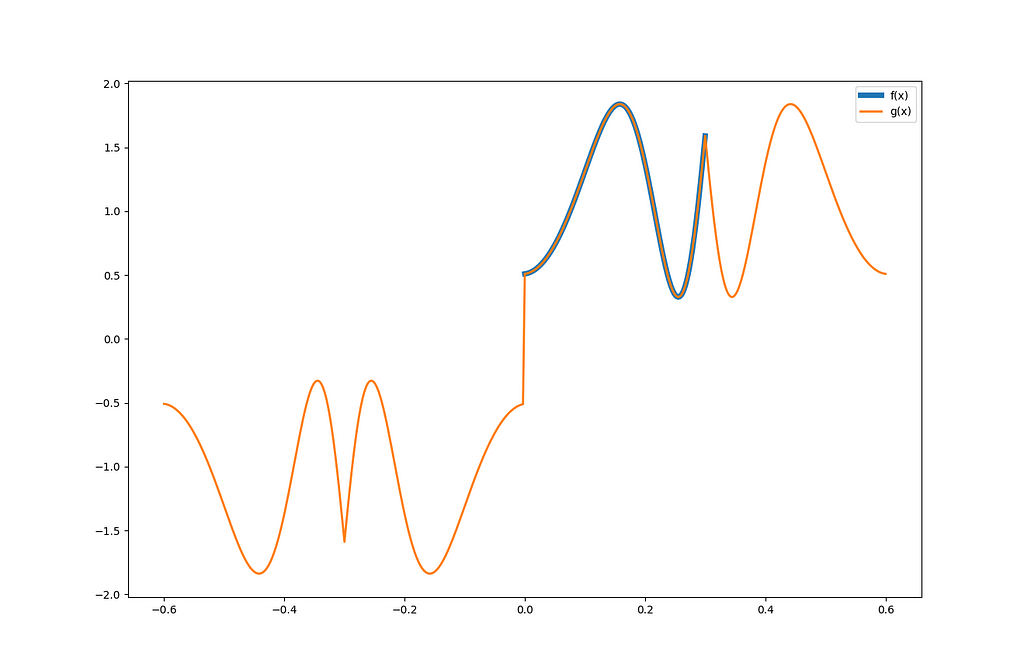
What if we created an odd function instead? This can be accomplished by pasting a rotated version of f(x) in the interval [-L, 0], like in Figure 7:
Figure 7: g(x) = -f(-x) in the range [-L, 0]. Image by the author.
The Fourier integration for the odd half-range expansion of f(x) yields equations (11) to (13):
Figure 8 shows the Fourier series reconstruction of f(x):
Figure 8: The original signal and its reconstruction with odd half-range expansion. Image by the author.
g(x) being odd, the Fourier series is made exclusively of sine terms. For this reason, the Fourier series is zero at x=0 and x=L. This property can be exploited, for example, when we simulate the shape of an oscillating guitar string. The string height is constrained to 0 at x=0 and x=L, so we would naturally model the initial condition with odd half-expansion.
We can be even more creative and design a periodic function with a period of 4L. If we want a derivative of exactly 0 at x=0 and a smooth transition, both in value and in derivative, at x=L, we can append a rotated copy of f(x) in the [L, 2L] interval and make this function even. Figure 9 shows an example:
Figure 9: g(x) = 2f(L) – f(2L+x) in the range[-2L, -L]; f(-x) in the range [-L, 0]; f(x) in the range [0, L]; 2f(L)-f(2L-x) in the range [L, 2L]. Image by the author.
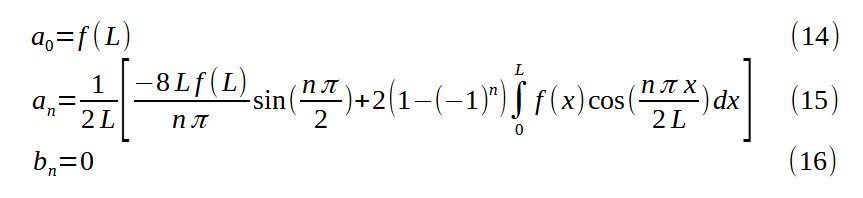
The Fourier integration for the even quarter-range expansion of f(x) yields equations (14) to (16):
Figure 10 shows the Fourier series reconstruction of f(x):
Figure 10: Original signal and Fourier series reconstruction with even quarter-range expansion. Image by the author.
Although it is not visible from the figure, the derivative of the Fourier series reconstruction is 0 at x=0 and identical to the original signal at x=L.
Odd quarter-range expansion
The last case we’ll consider is when we want a value of 0 at x=0 and a derivative of 0 at x=L. We build g(x) by appending a flipped version of f(x) in the [L, 2L] range and make this function odd.
Figure 11: g(x) = -f(x+2L) in the range[-2L, L]; -f(-x) in the range [-L, 0]; f(x) in the range [0, L]; f(2L-x) in the range [L, 2L]. Image by the author.
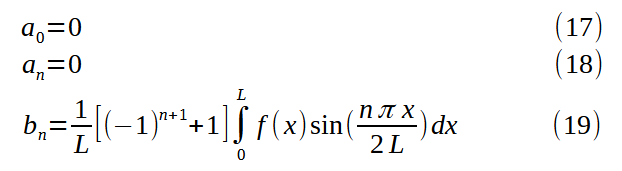
The Fourier integration for the odd quarter-range expansion of f(x) yields equations (17) to (19):
Figure 12 shows the Fourier series reconstruction of f(x):
Figure 12: Original signal and Fourier series reconstruction with odd quarter-range expansion. Image by the author.
We can see that the reconstruction goes through 0 at x=0. The derivative is zero at x=L, even if the original signal derivative is not.
Conclusion
We considered the problem of finding a suitable Fourier series expansion for a signal f(x) defined over the finite interval [0, L]. Fourier series apply to periodic functions, so we had to build a periodic function that matches f(x) over the defined domain. We observed four methods to define the periodic function g(x). Each guarantees specific properties at the range boundaries:
Even half-range expansion: The Fourier series has a derivative of 0 at x=0 and x=L
Odd half-range expansion: The Fourier series has a value of 0 at x=0 and x=L
Even quarter-range expansion: The Fourier series has a derivative of 0 at x=0 and smooth value and derivative at x=L
Odd quarter-range expansion: The Fourier series has a value of 0 at x=0 and a derivative of 0 at x=L
In a future story, we will examine how heat is transferred in a thin metal bar. The solution involves converting the initial temperature profile to a Fourier series. We’ll observe that the choice for the type of Fourier series expansion is naturally dictated by the boundary conditions (e.g., the bar is isolated at x=0 and held to a fixed temperature at x=L). The seemingly arbitrary periodic functions we created in this post will suddenly make sense!
References
(R1) Advanced Engineering Mathematics, Erwin Kreyszig, John Wiley and Sons, 1988
Available for iOS and Android and on the web, Threads is accessible to Instagram users who’d like to try a social network other than X, aka Twitter. Here’s how to dive in.
After numerous delays across many years, NASA is closer than ever to launching its first astronauts aboard the Boeing-made CST-100 Starliner spacecraft.
I tested a hunch and stumbled on something beautiful and mysterious inside GPT.
Part I of this post hypothesized that ChatGPT is a tour guide leading us through a high-dimensional version of the computer game Minecraft.
Outrageous? Absolutely, but I tested the hypothesis anyway and stumbled on something beautiful and mysterious inside GPT. Here’s what I found and the steps I took to uncover it.
To begin, we’ll clarify what we mean by “high-dimensional.” Then we’ll collect dimensional data from GPT-4 and compare it to Minecraft. Finally, just for fun, we’ll create a Minecraft world that uses actual GPT-4 data structures and see how it looks.
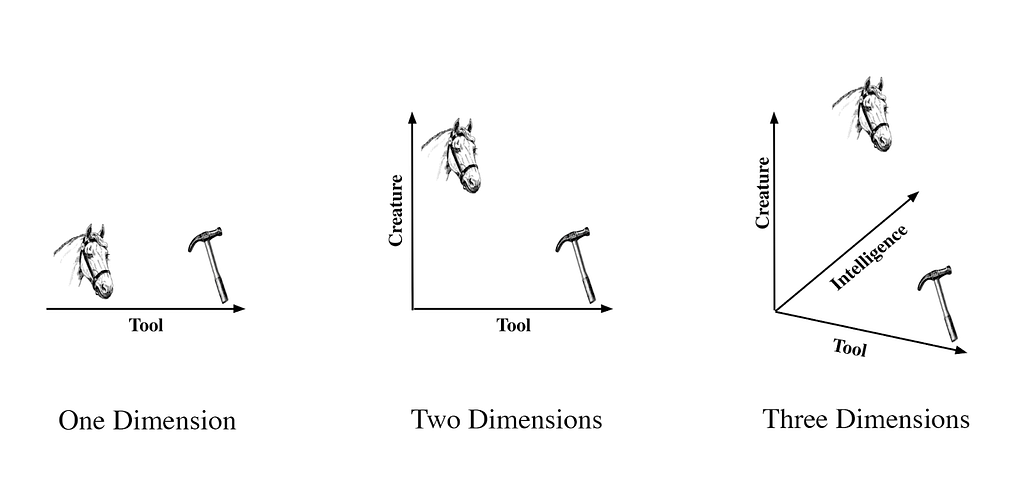
To clarify ‘dimension,’ consider this quote:
“I think it’s important to understand and think about GPT-4 as a tool, not a creature, which is easy to get confused…” — Sam Altman, CEO of OpenAI, testimony before the Senate Judiciary Subcommittee on Privacy, Technology (May 16, 2023)
Horse or hammer? We could just ask ChatGPT. However, the answer will hinge on ChatGPT’s level of self-awareness, which itself depends on how creature-like it is, creating a catch-22.
Instead, we’ll use our intuition and look at the problem in different dimensions. Dimensions are a measurable extent of some kind. For example in a “tool” dimension, a hammer seems more “tool-like” than a horse. In two dimensions, it’s a similar story. Horses are both more creature-like and less tool-like than hammers.
Where does GPT fit in? Probably closer to the hammer in both cases.
What if we add a third dimension called “intelligence?” Here’s where things get interesting. Horses are smarter than a bag of hammers and GPT seems pretty smart too. So, in these three dimensions GPT may actually be somewhere between a horse and a hammer.
Visualizing two dimensions is easy, three dimensions is a little harder but there’s no reason we couldn’t describe horses and hammers in thousands of dimensions. In fact there are good reasons to do this because measuring things across multiple dimensions enhances understanding. The marvel of GPT is it seems to have plotted not just horses and hammers but almost everything there is in thousands of dimensions!
But how does GPT represent things in thousands of dimensions?
With something called embeddings.
Embeddings are a way to convert words, pictures and other data into a list of numbers so computers can grasp their meanings and make comparisons.
Let’s say we wanted to have a computer grasp the meaning of apples and lemons. Assigning a number to each fruit might work, but fruits are more complex than a single number. So, we use a list of numbers, where each number says something like how it looks, how it tastes, and the nutritional content. These lists are embeddings and they help ChatGPT know that apples and lemons are both fruits but taste different.
Sadly, GPT embeddings defy human comprehension and visualization. For example, three thousand embeddings for just the word “apple” look like this:
Is it possible to reduce the number of dimensions without compromising the overall structure? Fortunately, this sort of thing happens all the time — on a sunny day, your shadow is a two-dimensional representation of your three-dimensional body. There are fancy ways of performing reductions mathematically, but we’re going to keep things really simple and just take the first three embeddings that OpenAI gives us and throw away the rest.
Could this possibly work?
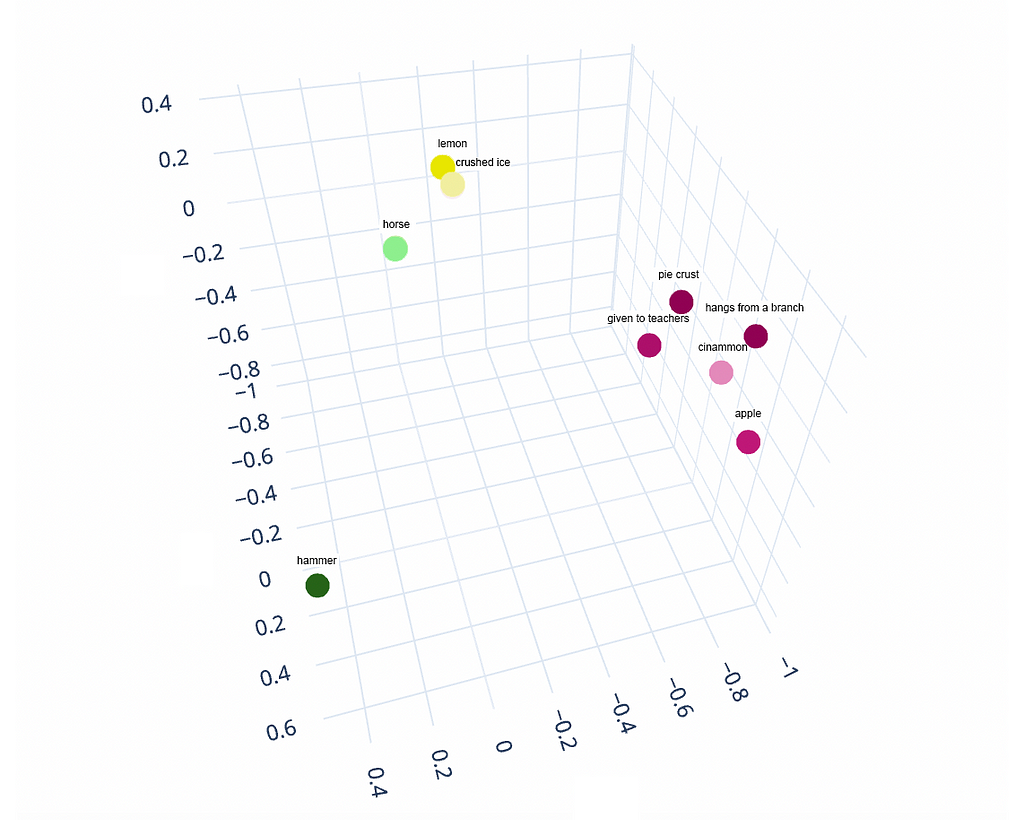
Let’s find out. We’ll kick things off by selecting a few words to experiment with: horse, hammer, apple, and lemon. Then, to keep things interesting, we’ll also pick a few words and phrases that may (or may not) be semantically connected: “cinnamon,” “given to teachers,” “pie crust,” “hangs from a branch,” and “crushed ice.”
Next, we’ll look up their embeddings. OpenAI makes this easy with something called an embedding engine. You give it a word or phrase and it returns a list of three thousand embeddings (3,072 to be exact).
Using a snippet of code we’ll take the first three embeddings for each word and discard the rest. Here’s the result:
What exactly are these numbers? If we’re being honest, nobody really knows; they seem to pinpoint the location of each word and phrase within a specific, somewhat mysterious dimension inside GPT. For our purposes, let’s treat the embeddings as though they were x, y, z coordinates. This approach requires an astoundingly audacious leap of faith, but we won’t dwell on that — instead, we’ll plot them on a graph and see what emerges.
Image created with Plotly.com
Do you see it?!
John Firth would be proud. Apple-ish things seem to be neighbors (ready to make a pie). Crushed ice and lemons are next to each other (ready to make lemonade). Hammer is off in a corner.
If you’re not completely blown away by this result, maybe it’s because you’re a data scientist who’s seen it all before. For me, I can’t believe what just happened: we looked up the embeddings for nine words and phrases, discarded 99.9% of the data, and then plotted the remaining bits on a 3D graph — and amazingly, the locations make intuitive sense!
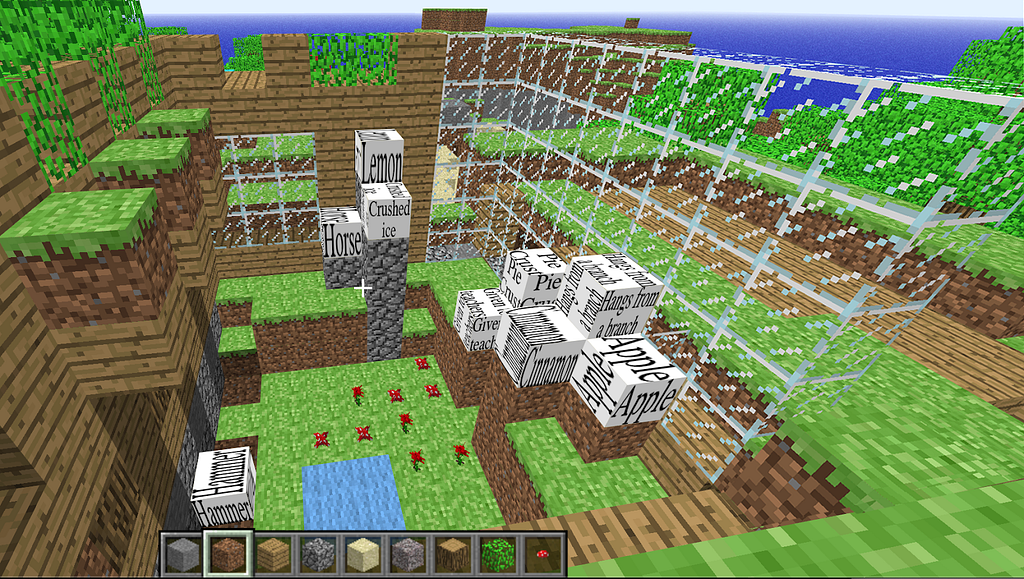
Still not astonished? Then perhaps you’re wondering how all this relates to Minecraft. For the gamers, we’re about to take the analysis one step further.
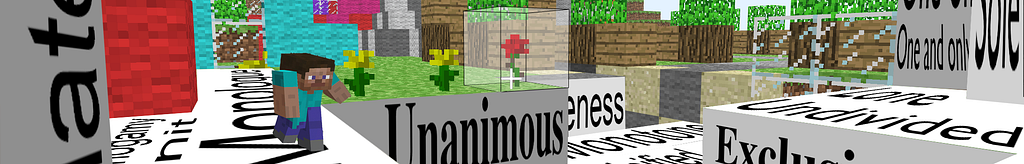
Using Minecraft Classic, we’ll build an 8 x 8 x 8 walled garden, then “plot” the words and phrases just like we did in the 3D graph. Here’s what that looks like:
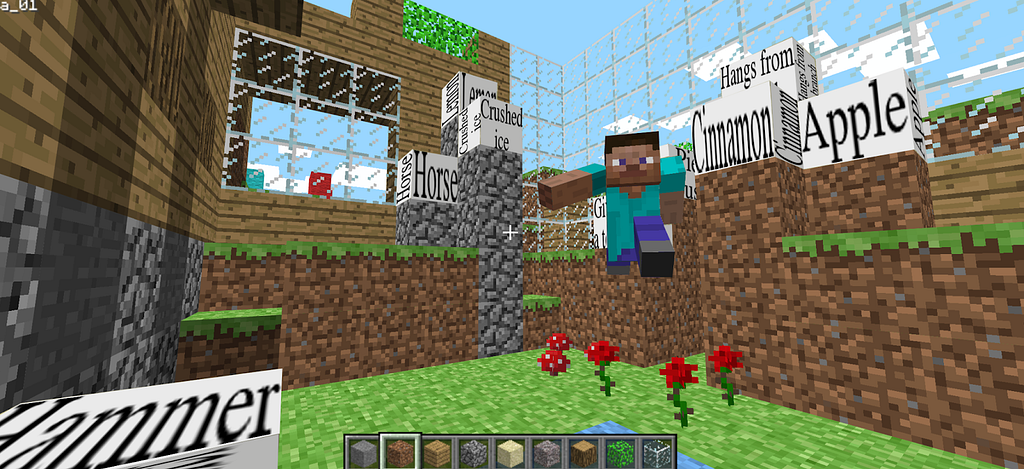
Notice that the positions of the words and phrases in the garden match those in the 3D graph. That’s because embeddings act like location coordinates in a virtual world — in this case, Minecraft. What we’ve done is take a 3,072-dimensional embedding space and reduce it down to a three-dimensional ‘shadow’ space in Minecraft, which can then be explored like this:
Who’s the explorer leaping through our garden? That’s ChatGPT, the high-dimensional docent, fluent in complex data structures — our emissary to the elegant and mysterious world of GPT. When we submit a prompt, it is ChatGPT who discerns our intent (no small feat, using something called attention mechanisms), then glides effortlessly through thousands of dimensions to lead us to exactly the right spot in the GPT universe.
Does all this mean ChatGPT is actually a tour guide from another world? Is it actually operating inside a high-dimensional game space? While we can’t say for certain, GPT does seem more game-like than either a horse or a hammer:
Sadeghi, Zahra, James L. McClelland, and Paul Hoffman. “You shall know an object by the company it keeps: An investigation of semantic representations derived from object co-occurrence in visual scenes.” Neuropsychologia 76 (2015): 52–61.
Balikas, Georgios. “Comparative Analysis of Open Source and Commercial Embedding Models for Question Answering.” Proceedings of the 32nd ACM International Conference on Information and Knowledge Management. 2023.
Hoffman, Paul, Matthew A. Lambon Ralph, and Timothy T. Rogers. “Semantic diversity: A measure of semantic ambiguity based on variability in the contextual usage of words.” Behavior research methods 45 (2013): 718–730.
Brunila, Mikael, and Jack LaViolette. “What company do words keep? Revisiting the distributional semantics of JR Firth & Zellig Harris.” arXiv preprint arXiv:2205.07750 (2022).
Gomez-Perez, Jose Manuel, et al. “Understanding word embeddings and language models.” A Practical Guide to Hybrid Natural Language Processing: Combining Neural Models and Knowledge Graphs for NLP (2020): 17–31
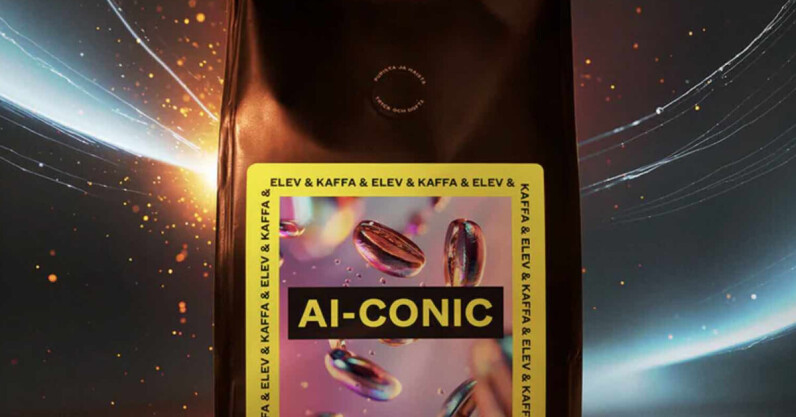
I am really into (my friends might say somewhat obsessed with) coffee. Not just for the hits of caffeine that fuel our productivity-enthralled capitalist society, but also for the taste, as well as different styles of brewing (although my Swedish roots make me partial to a pour-over). Sadly, I do not often get to write about it, as — even though coffee roasting and brewing rely on technological engineering — tech startups and coffee hardly ever intersect in the news. Enter Helsinki-based Kaffa Roastery, and its new blend of beans called AI-conic. The blend for the coffee (which costs €12.90…
We will all face the consequences of runaway climate change. Unless, maybe, you live in one of Elon Musk’s new homes on Mars. But for the rest of us poor souls, tackling global heating is pretty much the top priority. The bad news is that we are not on track to limit global temperature rise to 1.5°C. A new report has also revealed that temperatures in Europe are rising twice as fast as the rest of the world. We need to make drastic cuts in emissions. We also need to pull out some of the carbon we’ve already put in.…
Apple’s Vision Pro headset is gaining traction, so Meta has opened up its VR operating system to other manufacturers to maintain its lead in a market it previously dominated.
Meta Quest 3
As a newcomer in the virtual reality space, Apple’s Vision Pro brings with it the formidable reputation of its creator. Established companies like Meta have been on high alert to compete with Apple.
The latest move from Meta is the Monday announcement of Meta Horizon OS. It’s an attempt to open the Meta Quest platform to third-party hardware makers.
The European Central Bank is opposed to Apple’s proposed changes to the iPhone’s near-field communication at the core of Apple Pay, and has complained about it to the European Commission.
Apple could have to make additional changes to its NFC APIs
Pietro Cipollone, a member of the executive board of the ECB, expressed the bank’s concerns over Apple’s proposal. Cipollone explained that Apple’s proposed changes would be insufficient in several ways:
The letter argues that by not providing third parties with full access to the Secure Element of its NFC technology, Apple Pay maintains an unfair advantage against third-party payment apps on iPhone. Because of these limitations, contactless payments made through third-party apps on iPhone would be less user-friendly and ultimately be slower than Apple’s offering, according to Cipollone.
We use cookies on our website to give you the most relevant experience by remembering your preferences and repeat visits. By clicking “Accept”, you consent to the use of ALL the cookies.
This website uses cookies to improve your experience while you navigate through the website. Out of these, the cookies that are categorized as necessary are stored on your browser as they are essential for the working of basic functionalities of the website. We also use third-party cookies that help us analyze and understand how you use this website. These cookies will be stored in your browser only with your consent. You also have the option to opt-out of these cookies. But opting out of some of these cookies may affect your browsing experience.
Necessary cookies are absolutely essential for the website to function properly. These cookies ensure basic functionalities and security features of the website, anonymously.
Cookie
Duration
Description
cookielawinfo-checkbox-analytics
11 months
This cookie is set by GDPR Cookie Consent plugin. The cookie is used to store the user consent for the cookies in the category "Analytics".
cookielawinfo-checkbox-functional
11 months
The cookie is set by GDPR cookie consent to record the user consent for the cookies in the category "Functional".
cookielawinfo-checkbox-necessary
11 months
This cookie is set by GDPR Cookie Consent plugin. The cookies is used to store the user consent for the cookies in the category "Necessary".
cookielawinfo-checkbox-others
11 months
This cookie is set by GDPR Cookie Consent plugin. The cookie is used to store the user consent for the cookies in the category "Other.
cookielawinfo-checkbox-performance
11 months
This cookie is set by GDPR Cookie Consent plugin. The cookie is used to store the user consent for the cookies in the category "Performance".
viewed_cookie_policy
11 months
The cookie is set by the GDPR Cookie Consent plugin and is used to store whether or not user has consented to the use of cookies. It does not store any personal data.
Functional cookies help to perform certain functionalities like sharing the content of the website on social media platforms, collect feedbacks, and other third-party features.
Performance cookies are used to understand and analyze the key performance indexes of the website which helps in delivering a better user experience for the visitors.
Analytical cookies are used to understand how visitors interact with the website. These cookies help provide information on metrics the number of visitors, bounce rate, traffic source, etc.
Advertisement cookies are used to provide visitors with relevant ads and marketing campaigns. These cookies track visitors across websites and collect information to provide customized ads.