Threads users may soon have a new way to clean up their timelines. The app is testing a new archive feature that can be used to manually archive individual posts or automatically hide posts after a set period of time, Adam Mosseri shared.
As on Instagram, archiving a post on Threads will hide it from public view, though the post will be available to the original author to view or undo. The Instagram head said the feature will be available to a “small number of people” to start. Though optional, Mosseri has made no secret that his preference is for all posts on the service to be somewhat ephemeral. “I think we should move to automatically archive posts on Threads after a month or so,” he wrote in a post back in February.
But, in a poll shared with that earlier post, Threads users overwhelmingly said they would “never” want their posts automatically hidden from public view. In his latest update, Mosseri noted that “the resounding feedback was not to make this the default” so the company will try out archiving “as an option” to start.
While archiving old posts is popular on Instagram, the feature could be somewhat more controversial on Threads. As the service grows and adds more features geared toward real-time information, posts that automatically archive could make it harder to go back and revisit the original source of an update. (If Mosseri, for example, were to automatically archive all his old posts, it would be much more difficult to track his evolving thoughts on Threads, which he often shares publicly on the platform.) At the same time, allowing posts to be ephemeral often encourages users to share more often, which is even more important for Threads’ continued growth.
This article originally appeared on Engadget at https://www.engadget.com/threads-is-testing-automatic-archiving-for-posts-184243484.html?src=rss
Several months after Meta brought WhatsApp passkey logins to Android, it’s doing the same on iOS. The company is rolling out the feature now, and it will be available to all users in the coming weeks.
Passkeys are seen as a more secure login method as (for one thing) it mitigates the risk of scammers convincing users to share their SMS passcode. Instead, you can log in by verifying a passkey using facial recognition, biometrics or a PIN stored on Apple’s passkey manager. Passkeys work by securely storing an authentication credential on your device that pairs with one saved by the service you want to log into.
To turn on passkeys for WhatsApp on iOS, go to the Account section of the app’s Settings, and then tap Passkeys. “Passkey verification will make logging back into WhatsApp easier and more secure. We’re excited to launch this on WhatsApp and give users an added layer of security,” Alice Newton-Rex, WhatsApp’s head of product, said in a statement.
This article originally appeared on Engadget at https://www.engadget.com/whatsapp-is-enabling-passkey-support-on-ios-182527962.html?src=rss
The Biden administration is tackling the monumental task of making America’s industrial freight system more environmentally friendly. The White House said on Wednesday that it aims to have 30 percent of industrial truck sales produce zero emissions by 2030 and 100 percent by 2040.
In addition to those non-binding targets, the White House is meeting on Wednesday with stakeholders from the commercial vehicle, shipping and infrastructure industries to help execute its agenda. The roundtable is designed to advance the Biden Administration’s goal of “supercharging the buildout of the infrastructure necessary to make a zero-emissions freight ecosystem a reality in the United States.”
Unsurprisingly, the freight industry uses a lot of energy and produces a lot of pollution to match. Bloombergnotes that the transportation sector emits about 29 percent of US greenhouse gas emissions, and freight (including shipping, trucking and trains) makes up about a third of that figure. So, you can ballpark that the American freight industry is responsible for roughly 10 percent of the country’s carbon emissions.
As part of the election-year rollout, the Biden Administration plans to ask the public to comment on charging infrastructure for heavy-duty vehicles, signaling that the specifics of the plan aren’t yet finalized. The White House wants to avoid a fragmented industrial EV charging system without a universally agreed-upon standard. The industry has seemingly settled on Tesla’s NACS as the de facto choice in the lightweight consumer sector.
Alongside the newly announced industrial goals, the Biden Administration’s Environmental Protection Agency (EPA) is opening up about $1 billion in Inflation Reduction Act (IRA) funding to replace Class 6 and 7 vehicles (school buses, garbage trucks and delivery trucks) with electric equivalents.
The IRA requires that at least $400 million of that funding goes to local communities hit the hardest by industrial pollution. The White House says 72 million Americans live near truck freight routes and bear the brunt of their short-term output. Sadly but unsurprisingly (given the nation’s history), people of color and those from low-income households are most likely to be heavily affected by high environmental toxin levels.
The White House’s goals are admirable, given the urgency of the global climate crisis and the freight industry’s role. However, one significant problem remains: These are voluntary, non-binding resolutions that could — and, given public comments, almost certainly would — be undone by a second Trump Administration, should the serial napper return to office next year. As with many other aspects of the nation’s and world’s future, US voters will decide the outcome this November.
This article originally appeared on Engadget at https://www.engadget.com/the-white-house-wants-a-zero-emission-freight-industry-by-2040-180401537.html?src=rss
How to improve your ML model with three lines of code
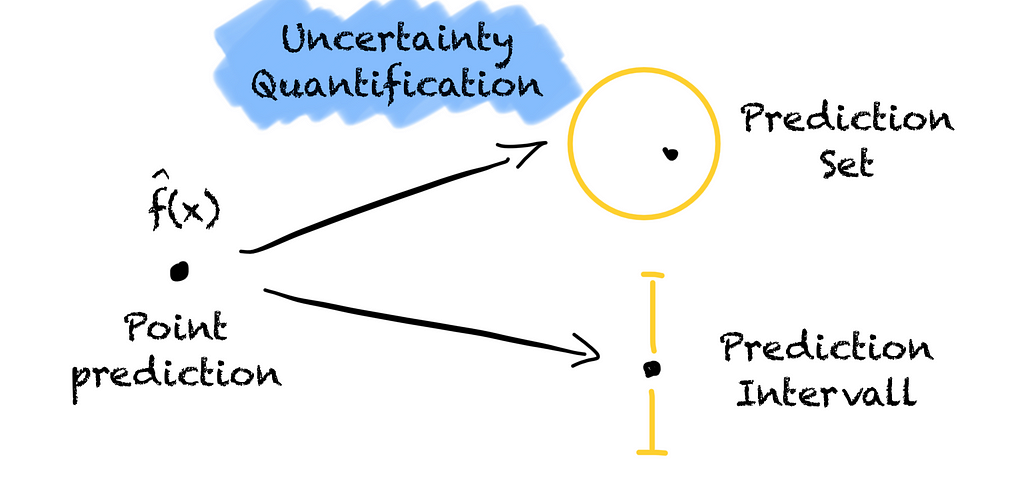
Turning a point prediction into a prediction region to quantify the model’s uncertainty to give us more information (Image by the author).
Prediction models are trained to predict well and give us point forecasts.
Let’s assume we want to buy a house. Before we do so, we want to verify that the advertised price of 400,000 € is reasonable. For this, we use a model that, based on the number of rooms, the size and the location of the house, predicts that the house is worth 500,232.12 €.
Should we buy this house? It seems like a good deal, doesn’t it? But would our decision be different if the model instead had predicted a price of 340,021.34 €? Probably, right?
Hence, should we trust the model when making the decision to buy this house? What is the probability that the house is worth exactly 500,232.12 € or 340,021.34 €?
As the probability is close to zero, we should rather see the prediction as a best guess of the true outcome. Moreover, there is a risk for us when making a decision based on the model.
In the housing example, we could pay too much, resulting in a financial loss. If a self-driving car does not classify a person crossing the street as an obstacle, the result might be deadly.
Hence, we should not trust the model’s prediction and we need to consider the risk associated with wrong predictions.
What would help us to take a better informed decision and gain trust in our model?
We need more information.
What about if our housing price model gives us an interval instead of a point prediction? The model tells us the house is worth between 400k € to 550k € with a 95 % probability. That would help, right?
An interval from 400k € to 550k € is better than from 200k € to 600k €. Based on the interval we can see how certain the model is. We quantify the model’s uncertainty. The wider the interval, the less certain the model.
By knowing how certain the model is about its prediction, we can make better-informed decisions and assess the risk. Without quantifying the model’s uncertainty, an accurate prediction and a wild guess look the same.
How does a good prediction region look like?
We want a prediction region that
is efficient,
is adaptive,
is valid / has guaranteed coverage.
Efficiency means that the prediction region should be as small as possible. If the prediction region is unnecessarily large, we loose important information about the model’s uncertainty. Is the region large because the model is uncertain or because our uncertainty quantification method does not work well? Only an efficient prediction region is helpful.
Adaptability means that the prediction region should be smaller for easier predictions and wider for difficult predictions. We can easily see when we can trust the model and when we should be careful.
Validity and guaranteed coverage mean that the true label lies in the prediction region at least x % of the time. If we choose a probability of 90%, we want to have the true label in the prediction region in 9 out of 10 cases. Not more, not less. However, usually we are fine if the coverage is only guaranteed to be equal to or higher than our chosen probability.
Why is aiming for guaranteed coverage of 100% a bad idea?
If we want a guaranteed coverage of 100 %, it leaves no room for error in our uncertainty quantification method. We must ensure that the prediction set always contains the true label.
This is only possible if the prediction region contains all possible values, such as all possible classes or infinite prediction intervals. But then the prediction region is not efficient anymore. It becomes useless. There is no information for us.
Hence, we must give the uncertainty quantification method some room for error. Depending on how the method makes the error, we can get three different types of coverage:
no coverage
marginal coverage
conditional coverage
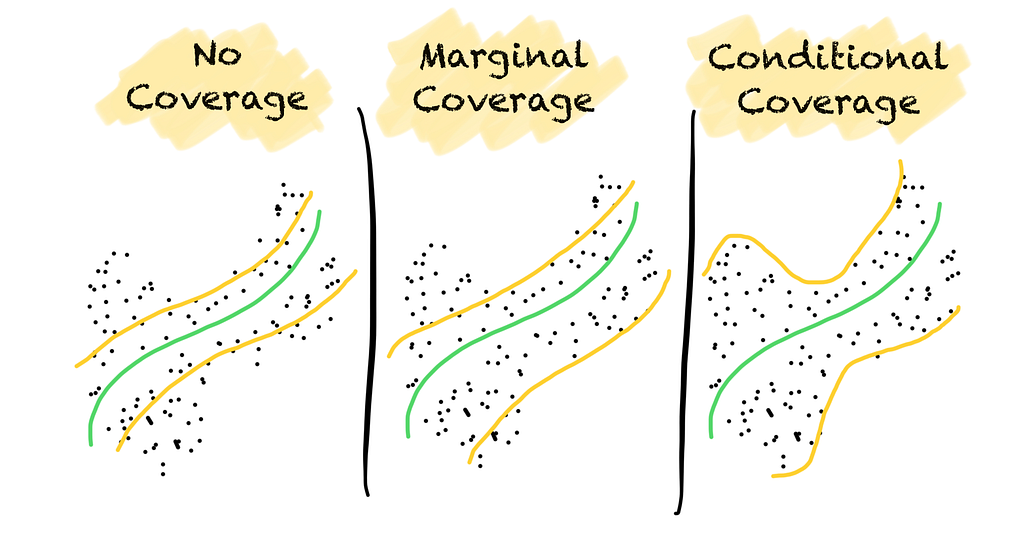
No coverage, marginal coverage, and conditional coverage for classification (left) and regression (right) problems. (Image by the author).
No coverage means that coverage is not guaranteed. The prediction region does not hold the true label with a predefined probability.
Marginal coverage means that coverage is guaranteed over all data points on average. The prediction region contains the true label at least with the stated probability. As coverage is only guaranteed over all data points, more errors may occur in one part of the space than in another. For example, the coverage might be small for minority classes in an imbalanced classification problem.
Conditional coverage means that coverage is guaranteed over all classes or data points. Errors occur in a balanced way. Conditional coverage, however, can only be approximated but not guaranteed.
Now we know why we need uncertainty quantification for ML and how helpful prediction regions look like.
But how can we quantify the uncertainty of a ML model?
Let’s assume we work for a company that classifies pictures of animals to understand how often a certain species appears in a given region. In the past, a person looked at each picture to identify the animal. This process took a long time. Hence, we build a model that classifies the animal in each picture. To be helpful, the model must be right in at least 90 % of the cases.
But the task is tricky. Our multiclass classification model only reaches an accuracy of 85% on our test set.
Hence, we want the model to tell us how certain it is about a picture. If the model is certain that its prediction is correct with a probability of more than 90 %, we use the model’s predicted class. Otherwise, we will have a human look at the picture.
But how can we tell if the model is certain or not? Let’s start with a naïve approach first.
Many classification models output the probability score of each class. Let’s take these and trust them. Every time, the model classifies a picture with a probability larger than 0.9 we trust the model. If the probability is lower, we give the picture to a human.
We give the model a picture of a dog. The model thinks this is a dog with a probability of 0.95. The model seems to be very certain. So, we trust the model.
For a picture of a cat the model, however, thinks the picture shows a giraffe with a probability of 0.8. Since the model’s probability is below our target of 90% probability, we discard the picture and give it to a human.
We do this with many pictures the model has not seen before.
Finally, we test the coverage of this approach for all pictures we classified. Unfortunately, we must realize that we have a smaller coverage than our aim of 90%. There are too many wrong predictions.
What did we do wrong?
Well, we trusted the probability score of the model.
But the score is not calibrated and does not guarantee the correct coverage for new data. The score would be calibrated if all classifications with a score of 0.9 would contain the true class 90% of the time. But this is not the case for the “probability” score of classification models.
Many approaches have the same problem, e.g., Platt scaling, isotonic regression, Bayesian predictive intervals, or bootstrapping. These are either not calibrated or rely on strong distribution assumptions.
But how can we achieve guaranteed coverage?
It seems like we only need to choose a better threshold.
Hence, we keep using the model’s “probability” score. But this time we change the score into a measure of uncertainty. In this case, one minus the model’s “probability” score for a class, i.e., 1 — s(x). The smaller the value, the more certain the model is about its prediction being the true class.
To determine the threshold, we use data the model has not seen during training. We calculate the non-conformity score of the true class for each sample in the set. Then we sort these scores from low (the model being certain) to high (the model being uncertain).
Sorting non-conformity scores of the true class for all samples in the calibration set (Image by the author).
Note that in this stage we only calculate the non-conformity score for the true class. We do not care about wether the model was rigth or wrong.
We use the resulting distribution to compute the threshold q_hat where 90% of the scores are lower. Our 90th percentile of the distribution. A score below this threshold will cover the true class with a probability of 90 %.
The threshold is determined by the 0.9 quantile of the distribution of non-conformity scores (Image by the author).
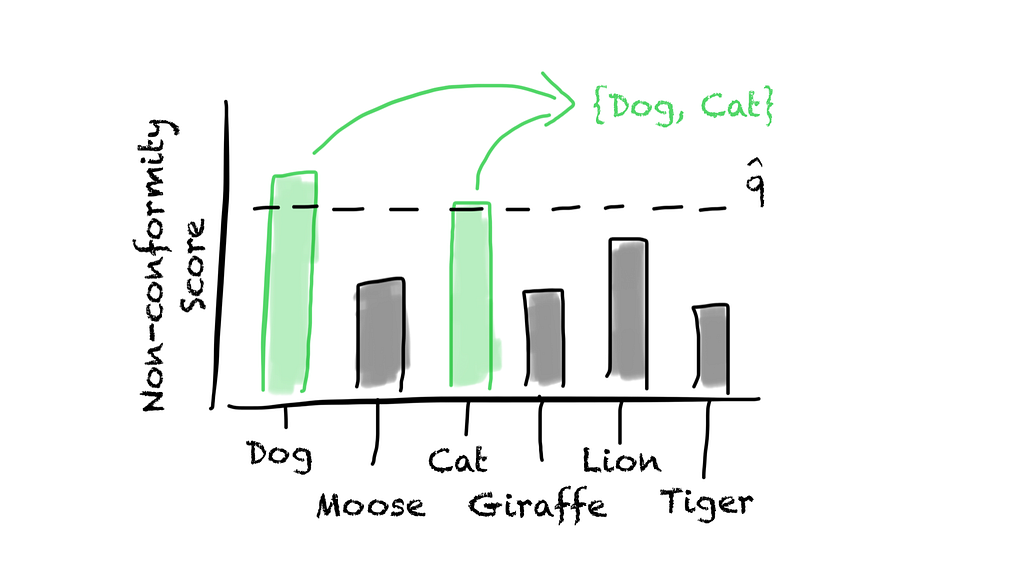
Now, every time we make a new prediction, we calculate the non-conformity score for all classes. Then we put all classes with a score lower than the threshold into our prediction set. That’s it.
With this, we can guarantee that the true class will be in the prediction set with a probability of 90 %.
All classes that have a non-conformity score above the threshold are put into the prediction set (Image by the author).
For our animal classification, we trust all predictions that only contain one animal in the prediction set. If the prediction set contains more than one class, we let a person check our classification.
Turning the theory into code
Not only is the approach easy to understand. The approach is also straightforward to implement. It only takes us three lines of code. It is that simple.
We follow the same steps, we did above.
We calculate the probability score for every sample in a calibration set that the model has not seen during training.
We determine the probability score of the true class for every sample.
We derive the threshold q_hat of our non-conformity score 1-s(x) based on the 0.9 quantile.
The only thing we have to account for is that we have a finite calibration set. Thus, we need to apply finite sample correction and multiply the 0.9 with (n+1)/n, in which n is the number of samples we use to calibrate out model.
Now, every time we run the model on unseen data, we can quantify the uncertainty of our model. This knowledge helps us in assessing the risk we are taking when making decisions based on our model.
In this article, I have shown you why you should care about quantifying your model’s uncertainty. I have also shown you how easy it is. However, I have only touched on the surface of uncertainty quantification. There is much more to learn.
Thus, I will dive deeper into uncertainty quantification in future articles. In the meantime, please feel free to leave some comments. Otherwise, see you in my next article.
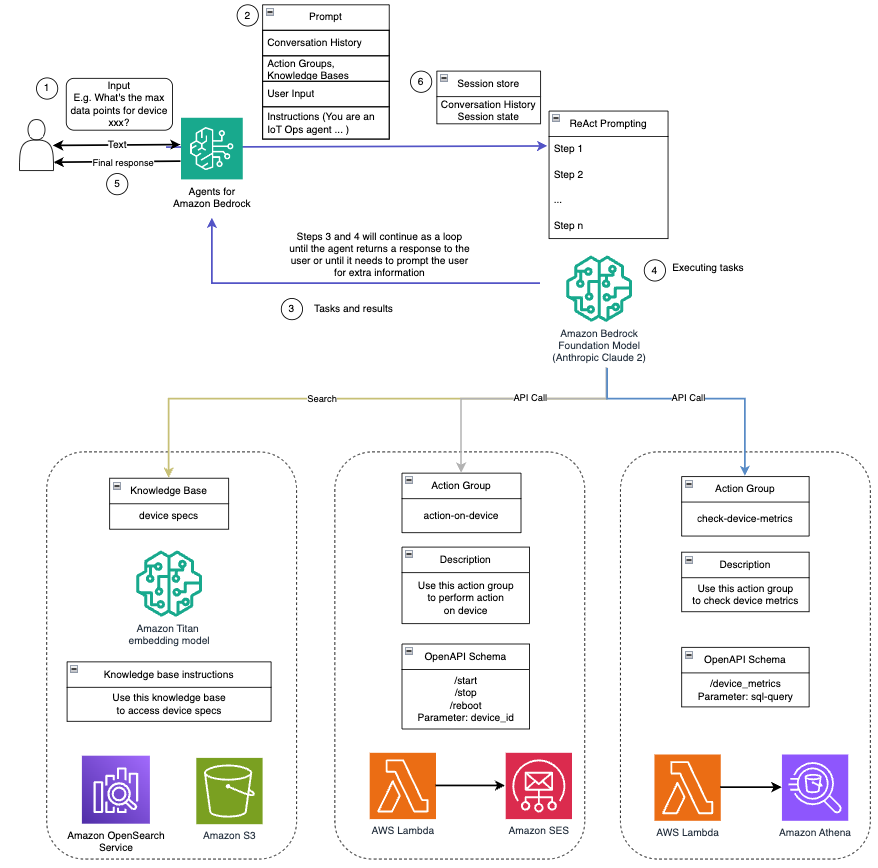
Conversational artificial intelligence (AI) assistants are engineered to provide precise, real-time responses through intelligent routing of queries to the most suitable AI functions. With AWS generative AI services like Amazon Bedrock, developers can create systems that expertly manage and respond to user requests. Amazon Bedrock is a fully managed service that offers a choice of […]
The Amazon EU Design and Construction (Amazon D&C) team is the engineering team designing and constructing Amazon warehouses. The team navigates a large volume of documents and locates the right information to make sure the warehouse design meets the highest standards. In the post A generative AI-powered solution on Amazon SageMaker to help Amazon EU […]
We use cookies on our website to give you the most relevant experience by remembering your preferences and repeat visits. By clicking “Accept”, you consent to the use of ALL the cookies.
This website uses cookies to improve your experience while you navigate through the website. Out of these, the cookies that are categorized as necessary are stored on your browser as they are essential for the working of basic functionalities of the website. We also use third-party cookies that help us analyze and understand how you use this website. These cookies will be stored in your browser only with your consent. You also have the option to opt-out of these cookies. But opting out of some of these cookies may affect your browsing experience.
Necessary cookies are absolutely essential for the website to function properly. These cookies ensure basic functionalities and security features of the website, anonymously.
Cookie
Duration
Description
cookielawinfo-checkbox-analytics
11 months
This cookie is set by GDPR Cookie Consent plugin. The cookie is used to store the user consent for the cookies in the category "Analytics".
cookielawinfo-checkbox-functional
11 months
The cookie is set by GDPR cookie consent to record the user consent for the cookies in the category "Functional".
cookielawinfo-checkbox-necessary
11 months
This cookie is set by GDPR Cookie Consent plugin. The cookies is used to store the user consent for the cookies in the category "Necessary".
cookielawinfo-checkbox-others
11 months
This cookie is set by GDPR Cookie Consent plugin. The cookie is used to store the user consent for the cookies in the category "Other.
cookielawinfo-checkbox-performance
11 months
This cookie is set by GDPR Cookie Consent plugin. The cookie is used to store the user consent for the cookies in the category "Performance".
viewed_cookie_policy
11 months
The cookie is set by the GDPR Cookie Consent plugin and is used to store whether or not user has consented to the use of cookies. It does not store any personal data.
Functional cookies help to perform certain functionalities like sharing the content of the website on social media platforms, collect feedbacks, and other third-party features.
Performance cookies are used to understand and analyze the key performance indexes of the website which helps in delivering a better user experience for the visitors.
Analytical cookies are used to understand how visitors interact with the website. These cookies help provide information on metrics the number of visitors, bounce rate, traffic source, etc.
Advertisement cookies are used to provide visitors with relevant ads and marketing campaigns. These cookies track visitors across websites and collect information to provide customized ads.