Whether you’re looking to make a few tweaks to the game or want a completely new world to explore, there’s a Stardew Valley mod that will suit your needs.
Threads is giving users more control over who can quote their posts (as in, reposting with commentary). If you don’t want just anyone to be able to quote your posts, you now have the option to allow only people you follow to do so. Or, you can make it so no one can quote your posts at all. Head of Instagram Adam Mosseri announced the update this weekend, saying he hopes it will “help keep Threads a more positive place.” The platform tested the feature among a group of Threads users last month, but it’s now rolling out to everyone.
Threads, which now has over 150 million monthly users, has been slowly adding more features to improve safety and the overall user experience, borrowing some tools from Instagram. Last month, it introduced the Hidden Words feature, so users can designate certain terms that they want to be filtered out of their feeds. Threads also recently started testing options for archiving posts, either manually or automatically after a chosen expiration date.
This article originally appeared on Engadget at https://www.engadget.com/threads-now-lets-you-control-who-can-quote-your-posts-184754374.html?src=rss
Parrots are innately social creatures. In captivity, where they typically don’t have a flock to interact with, that can present some real challenges for keeping them happy and healthy. But recent research suggests technology may be able to help them meet more of their social needs. A new (very small) study led by researchers at the University of Glasgow and Northeastern University compared parrots’ responses when given the option to video chat with other birds via Meta’s Messenger versus watching pre-recorded videos. And it seems they’ve got a preference for real-time conversations.
The research builds on findings from a series of small studies over the last few years, including one in which the team trained pet parrots to make video calls to each other (with human assistance) and another where they were taught to play tablet games. In the latest, nine parrot owners were given tablets to set up for their pets, who were then observed over a period of six months. During that time, the parrots — who’d been introduced to each other at the beginning over video chat — were able to engage in calls amongst themselves of up to three hours long over a total of 12 sessions. Half of these sessions featured pre-recorded videos, while the other half were live Messenger video chats.
Their caregivers, who recorded the sessions, reported that the birds seemed more engaged during the live interactions. They initiated more calls in those scenarios, and spent more time on average engaging with the birds on the other end.
In each session, the parrots were allowed to make up to two calls, and the researchers found that those chatting over Messenger hit this limit 46 percent of the time, compared to almost half that when they were watching pre-recorded videos. Overall, they spent a combined 561 minutes video-chatting on Messenger compared to just 142 minutes watching the pre-recorded videos.
“The appearance of ‘liveness’ really did seem to make a difference to the parrots’ engagement with their screens,” said Dr. Ilyena Hirskyj-Douglas, though noting that further study would be needed before definite conclusions can be drawn. “Their behavior while interacting with another live bird often reflected behaviors they would engage in with other parrots in real life, which wasn’t the case in the pre-recorded sessions.” Still, the caregivers mostly reported that the live and pre-recorded calls both seemed to have a positive impact on the birds.
“The internet holds a great deal of potential for giving animals agency to interact with each other in new ways, but the systems we build to help them do that need to be designed around their specific needs and physical and mental abilities,” said Dr. Hirskyj-Douglas. “Studies like this could help to lay the foundations of a truly animal-centered internet.”
This article originally appeared on Engadget at https://www.engadget.com/parrots-in-captivity-seem-to-enjoy-video-chatting-with-their-friends-on-messenger-165911437.html?src=rss
6-screen laptop manufacturer is very much alive — Acme Portable’s Megapac L3 is the original hexadisplay mobile powerstation and is still on sale, shame that it is still using old dual CPU tech from AMD and Intel
Originally appeared here:
6-screen laptop manufacturer is very much alive — Acme Portable’s Megapac L3 is the original hexadisplay mobile powerstation and is still on sale, shame that it is still using old dual CPU tech from AMD and Intel
This Costco deal gets you a free $40 gift card with your annual Costco Gold Star membership, effectively cutting down the price to just $20. (I even bought it myself.)
This post describes some interesting processes for transforming the map boundaries in vector datasets using QGIS and geopandas in Python.
Recently, for one of my projects, I had to define the composition of countries in a region, make the region distinct, and highlight it on the map of a continent. Let’s take an example of the South Asia region in Asia. The South Asia region is comprised of eight countries: Afghanistan, Bangladesh, Bhutan, India, Maldives, Nepal, Pakistan and Sri Lanka. From the map of Asia, I wanted to clip off the South Asia region and highlight it distinctly in the continental map. Furthermore, I wanted to go one step ahead and dissolve the boundaries of the countries in the region so that the region could be demonstrated as a single unit.
I was able to achieve this using both Quantum-GIS (QGIS) and geopandas package in Python. In this process, I utilized the clipping feature which I was already familiar with, and I learned about the dissolve feature which I found very fascinating. In this post, I am going to share my learning about these features and how I achieved my objectives. Let’s get started.
Image by Author.
1. QGIS
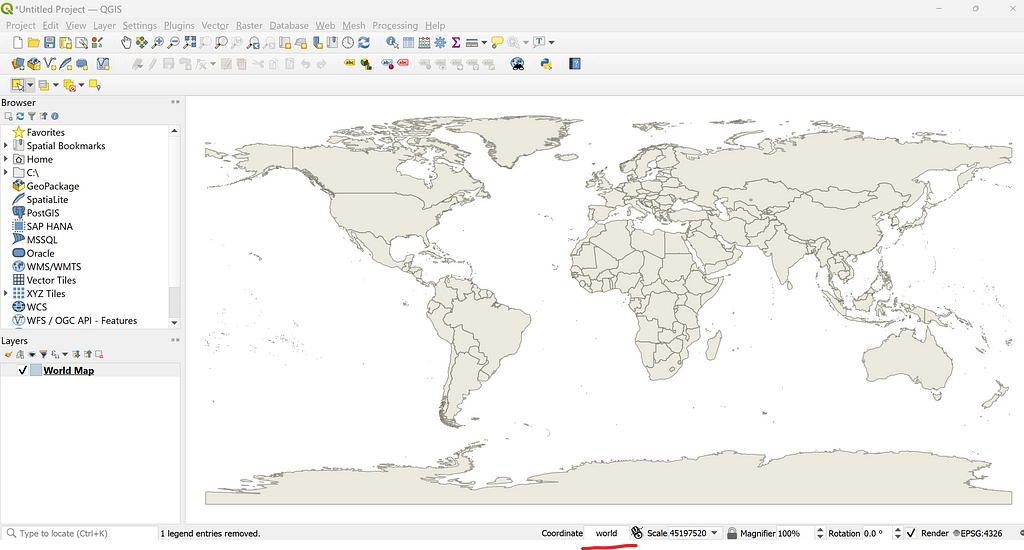
In an empty QGIS project, by typing world in the coordinate space in the bottom of the page, I could call an in-built map of the world with administrative boundaries of all the countries as shown below.
Getting a world map in QGIS. Image by Author.
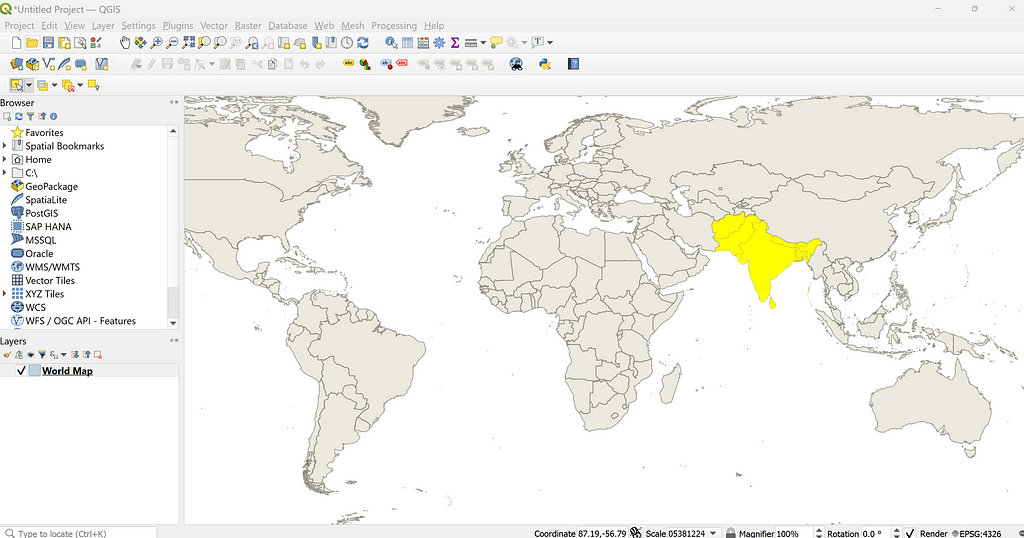
Next, by using the select feature, I selected the 8 countries of South Asia as highlighted in the map below. QGIS offers the option to select countries by hand, by polygon, by radius, and by individually selecting or deselecting countries with a mouse click.
Selecting countries from the world map. Image by Author.
Clipping in QGIS
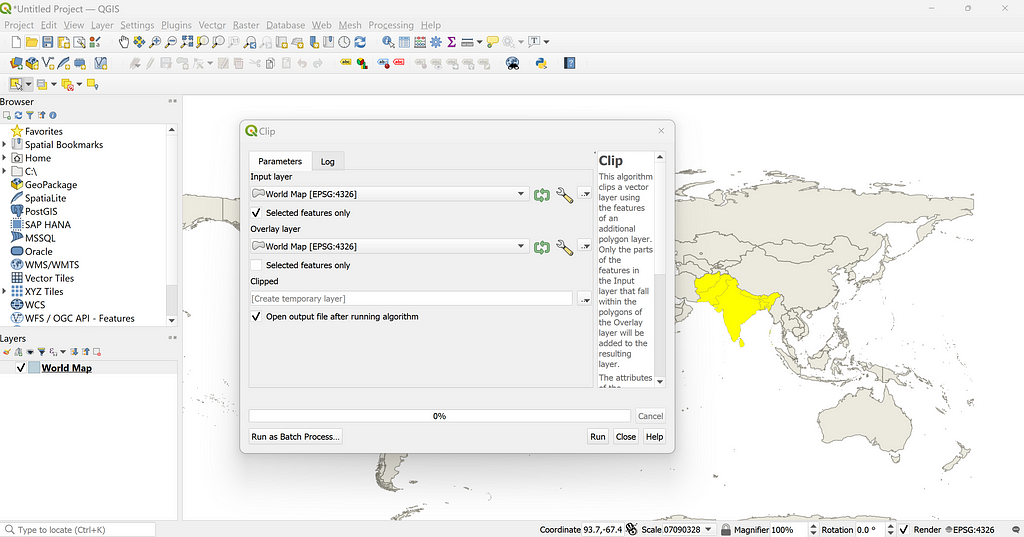
Clipping these countries off of the world map is straightforward in QGIS. One needs to go to Vector in the menu-> Select Geoprocessing tools -> Select Clip. In the options, I ticked on the check box for the Selected features only in the Input layer and ran the process.
Running Clipping algorithm. Image by Author.
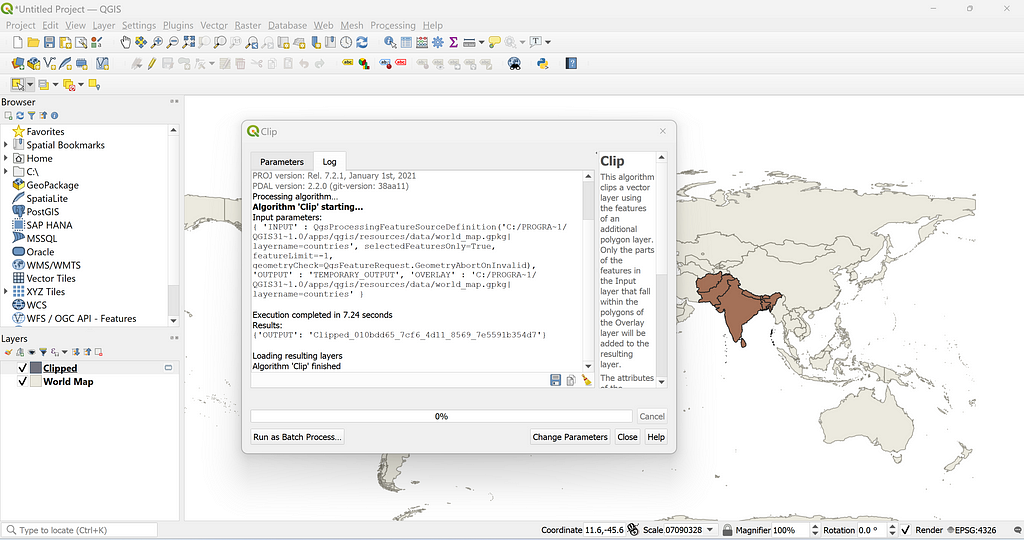
The clipping action was completed in 7.24 seconds alone and I got a new layer called “Clipped”. This is depicted by the brown color in the screenshot below. By going to Properties of the layer, one can use different coloring options in QGIS in the Symbology option.
New Clipped layer is created. Image by Author.
Dissolving boundaries in QGIS
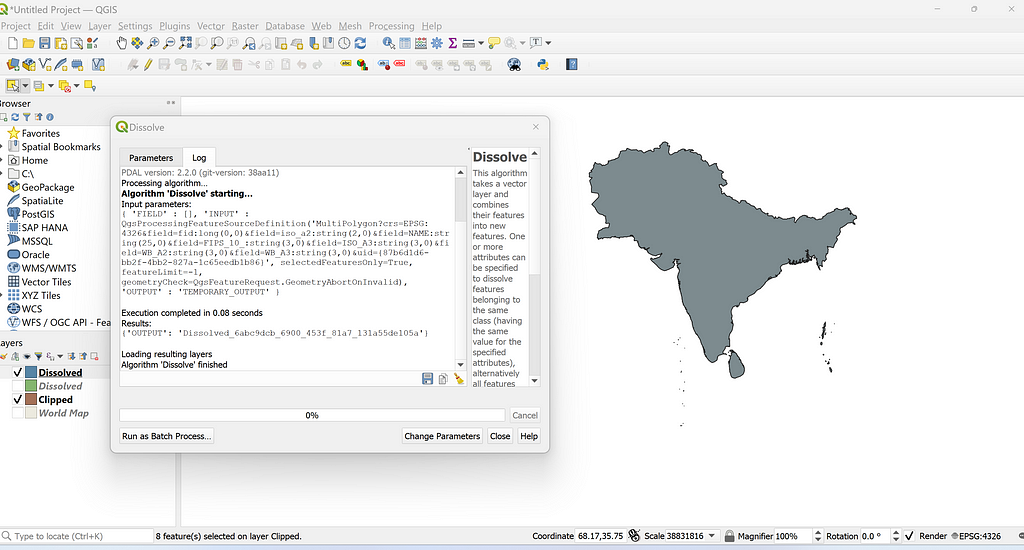
Next, I wanted to dissolve the boundaries between countries in South Asia. For this, I selected all the countries in South Asia. I went to the Vector Menu -> Select Geoprocessing Tools ->Dissolve. Similar to the previous step, I selected “Selected featured only” in the input layer and ran the algorithm which took just 0.08 seconds. A new layer called “Dissolved” was created where the administrative boundaries between countries were dissolved and appeared as a single unit as shown below:
New Dissolved layer is created. Image by Author.
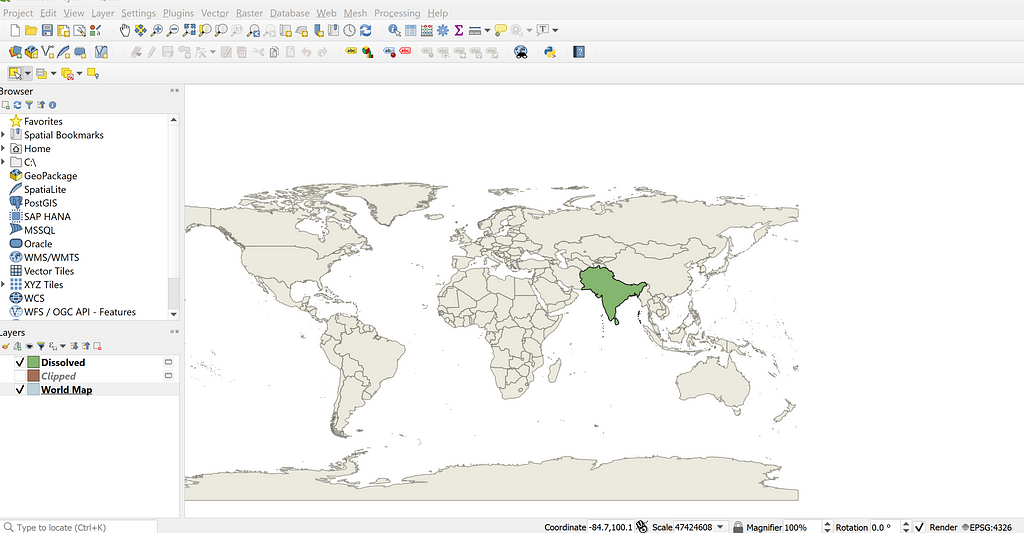
Visualizing both the world layer and Dissolved layer at the same time looks as shown below:
Dissolved layer and world layer. Image by Author.
2. Geopandas
In this section, I am going to demonstrate how I could the same objective in Python using the geopandas package.
In the first step, I read the in-built dataset of the world map within the geopandas package. It contains the vector data of the world with the administative boundaries of all counntries. This is obtained from the Natural Earth dataset, which is free to use.
import pandas as pd import geopandas as gpd import matplotlib.pyplot as plt import numpy as np
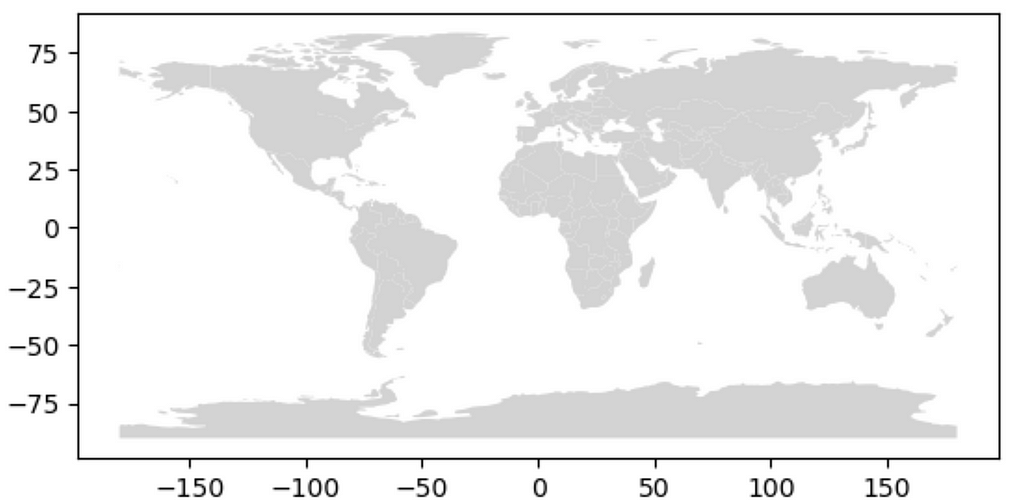
world = gpd.read_file(gpd.datasets.get_path('naturalearth_lowres')) world.plot(color = "lightgrey")
Plotting world map in geopandas. Image by Author.
Clipping with geopandas
In my very first post, I demonstrated how it is possible to clip off a custom Polygon geometry as a mask from the original geopandas dataframe or layer. However, for simplicity, I just used the filter options to obtain the required layers for Asia and South Asia.
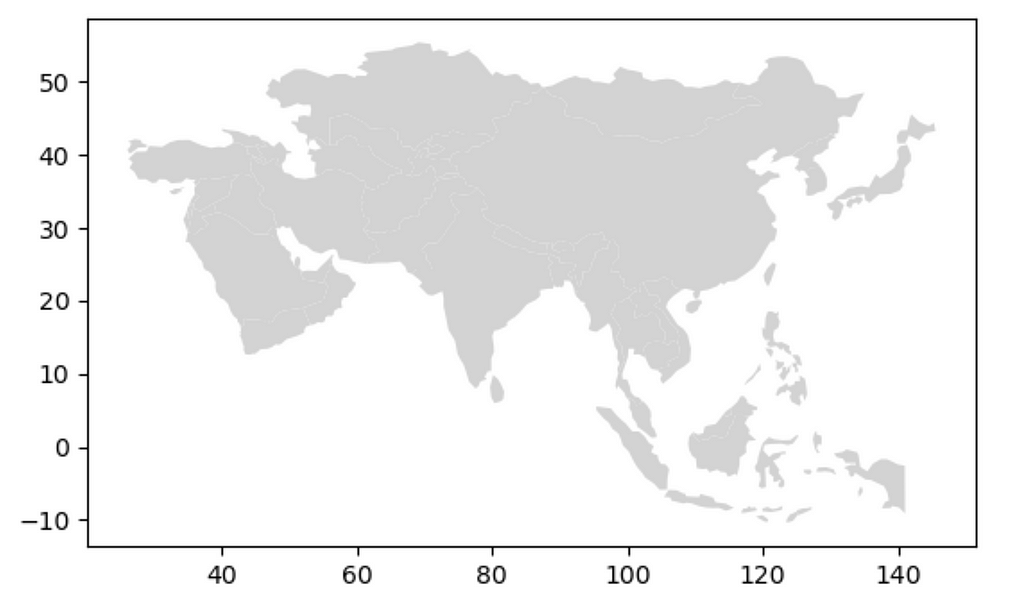
asia = world[world.continent == "Asia"]
asia.plot(color = "lightgrey")
Filtering Asia continent from world. Image by Author.
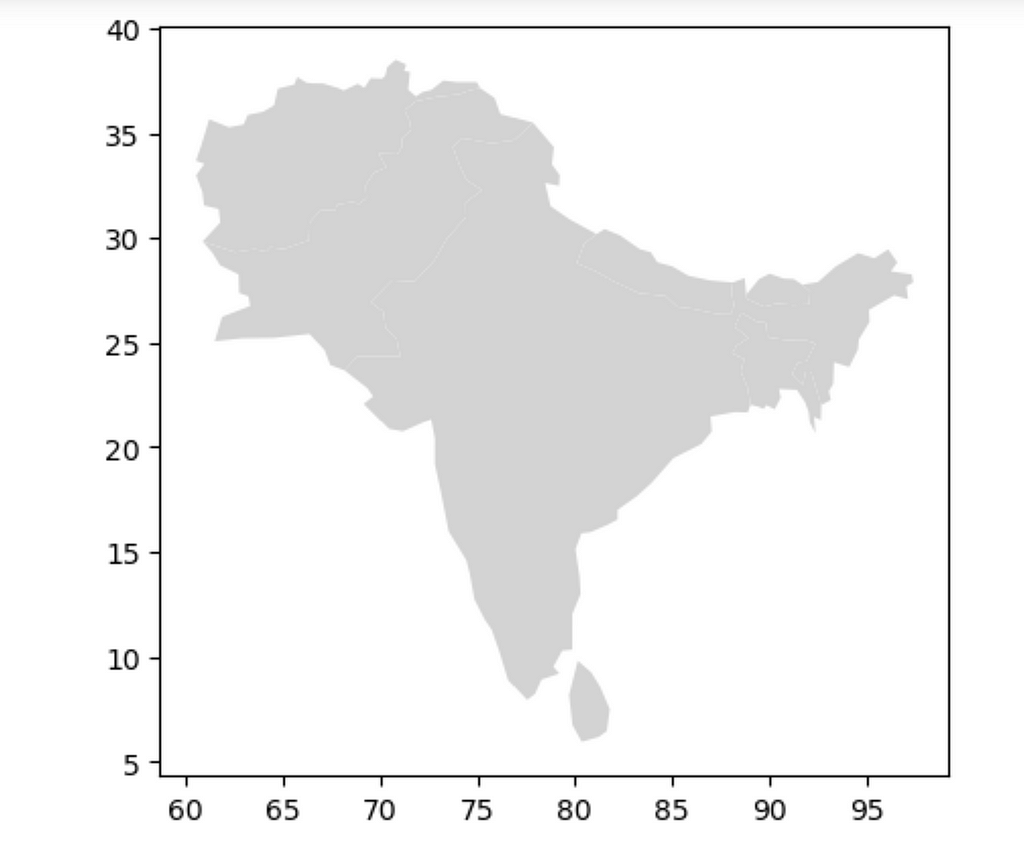
To filter the South Asia region, I used a list containing the name of each country as a reference.
Filtering South Asia region from Asia. Image by Author.
Dissolve boundaries between countries in South Asia using geopandas
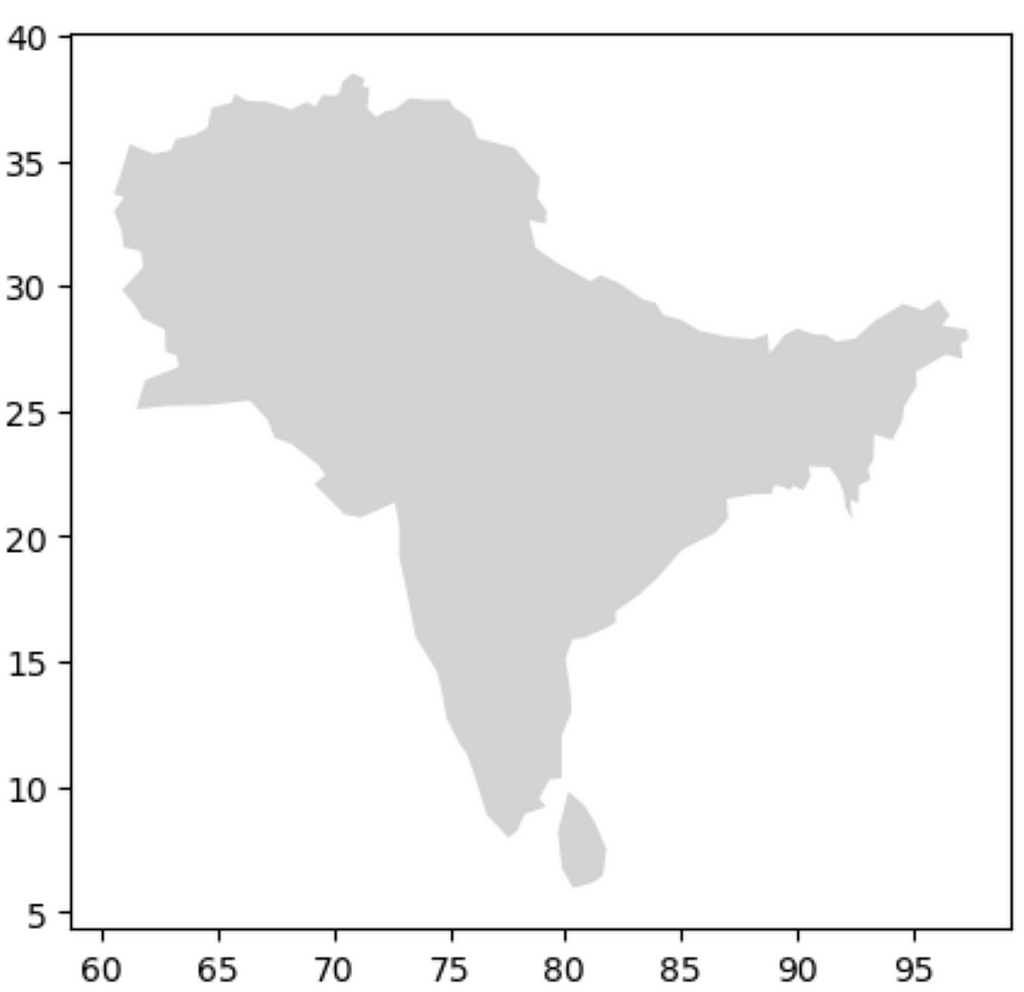
To dissolve the boundaries between countries in South Asia, I used the dissolve feature in geopandas. I passed None as an argument, and specified parameters to apply certain aggregate functions, in which the population and GDP in the resulting dissolved dataframe would sum up the population and GDP in all countries in South Asia. I am yet to figure out how the aggregate function can also be applied in QGIS.
Administrative boundaries between countries in South Asia are dissolved. Image by Author.
Dissolving boundaries between countries within a continent in the world
Using the same procedure as above, I wanted to dissolve the boundaries between countries within a continent and show different continents distinct from each other in a world map based on the number of countries in each continent.
For this purpose, first I added a new column called num_countries in the world geodataframe containing 1 as a value. Then I dissolved the world map using the continent column as a reference.
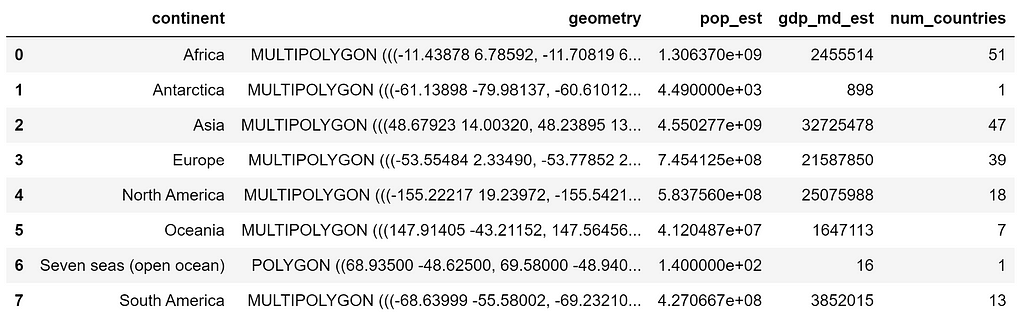
I used the aggregate function to sum up the population and GDP in all countries in the continent and count the number of countries in each continent. The resulting geodataframe continents_dissolved look as shown:
We see that Asia has the largest population and GDP of all continents. Similarly, we see that Africa has the most countries (51) followed by Asia (47), Europe (39), North America (18), South America (13), and Oceania (7). Antarctica and Seven seas (open ocean) are also regarded as continents in this dataset.
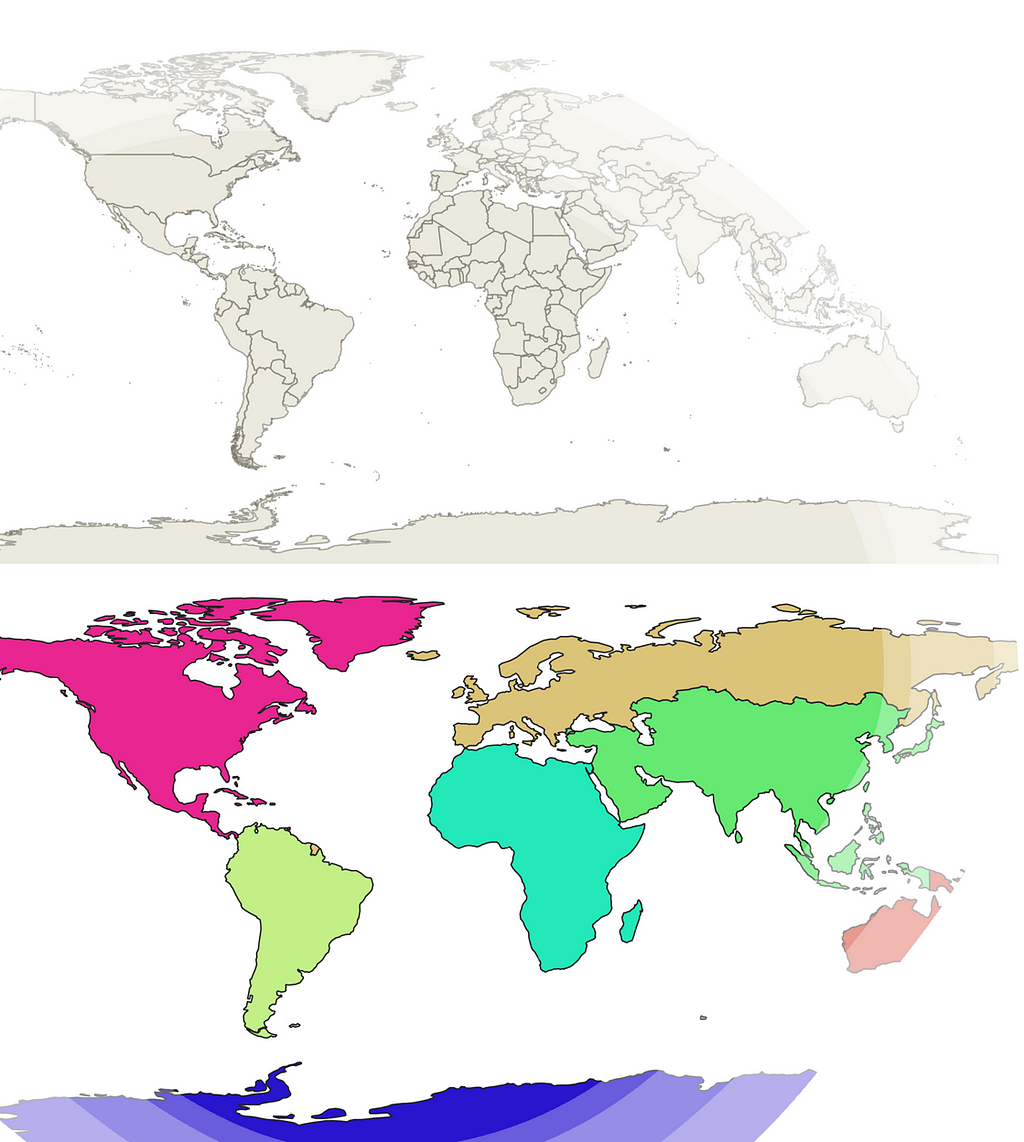
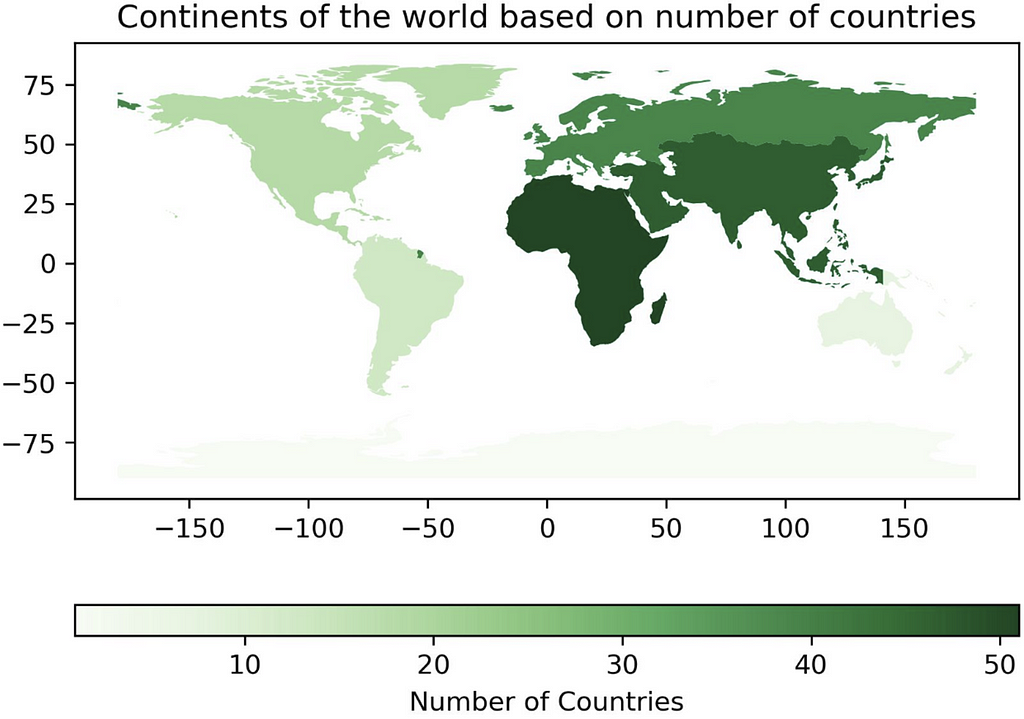
Finally, I wanted to plot the world map highlighting the number of countries in each continent with the help of a color map. I achieved this using the following code:
# Add a horizontal colorbar cbar = plt.colorbar(map.get_children()[0], ax=ax, orientation='horizontal', aspect = 30 #control the width of color bar. higher value= lower width. )
# Set a label for the colorbar cbar.set_label('Number of Countries')
plt.title("Continents of the world based on number of countries")
Map of the world where the color reflects number of countries in each continent. Image by Author.
Conclusion
In this post, I described ways to dissolve map boundaries using QGIS and geopandas in Python. In the process, I also explained the clipping process and the possibility of using aggregate function while dissolving the map boundaries in geopandas. These processes could be very useful for the manipulation, processing, and transformation of geographical maps in the form of vector datasets. The code and the QGIS project file for this post are available in this GitHub repository. Thank you for reading!
We use cookies on our website to give you the most relevant experience by remembering your preferences and repeat visits. By clicking “Accept”, you consent to the use of ALL the cookies.
This website uses cookies to improve your experience while you navigate through the website. Out of these, the cookies that are categorized as necessary are stored on your browser as they are essential for the working of basic functionalities of the website. We also use third-party cookies that help us analyze and understand how you use this website. These cookies will be stored in your browser only with your consent. You also have the option to opt-out of these cookies. But opting out of some of these cookies may affect your browsing experience.
Necessary cookies are absolutely essential for the website to function properly. These cookies ensure basic functionalities and security features of the website, anonymously.
Cookie
Duration
Description
cookielawinfo-checkbox-analytics
11 months
This cookie is set by GDPR Cookie Consent plugin. The cookie is used to store the user consent for the cookies in the category "Analytics".
cookielawinfo-checkbox-functional
11 months
The cookie is set by GDPR cookie consent to record the user consent for the cookies in the category "Functional".
cookielawinfo-checkbox-necessary
11 months
This cookie is set by GDPR Cookie Consent plugin. The cookies is used to store the user consent for the cookies in the category "Necessary".
cookielawinfo-checkbox-others
11 months
This cookie is set by GDPR Cookie Consent plugin. The cookie is used to store the user consent for the cookies in the category "Other.
cookielawinfo-checkbox-performance
11 months
This cookie is set by GDPR Cookie Consent plugin. The cookie is used to store the user consent for the cookies in the category "Performance".
viewed_cookie_policy
11 months
The cookie is set by the GDPR Cookie Consent plugin and is used to store whether or not user has consented to the use of cookies. It does not store any personal data.
Functional cookies help to perform certain functionalities like sharing the content of the website on social media platforms, collect feedbacks, and other third-party features.
Performance cookies are used to understand and analyze the key performance indexes of the website which helps in delivering a better user experience for the visitors.
Analytical cookies are used to understand how visitors interact with the website. These cookies help provide information on metrics the number of visitors, bounce rate, traffic source, etc.
Advertisement cookies are used to provide visitors with relevant ads and marketing campaigns. These cookies track visitors across websites and collect information to provide customized ads.