We recently announced the general availability of cross-account sharing of Amazon SageMaker Model Registry using AWS Resource Access Manager (AWS RAM), making it easier to securely share and discover machine learning (ML) models across your AWS accounts. In this post, we will show you how to use this new cross-account model sharing feature to build your own centralized model governance capability, which is often needed for centralized model approval, deployment, auditing, and monitoring workflows.
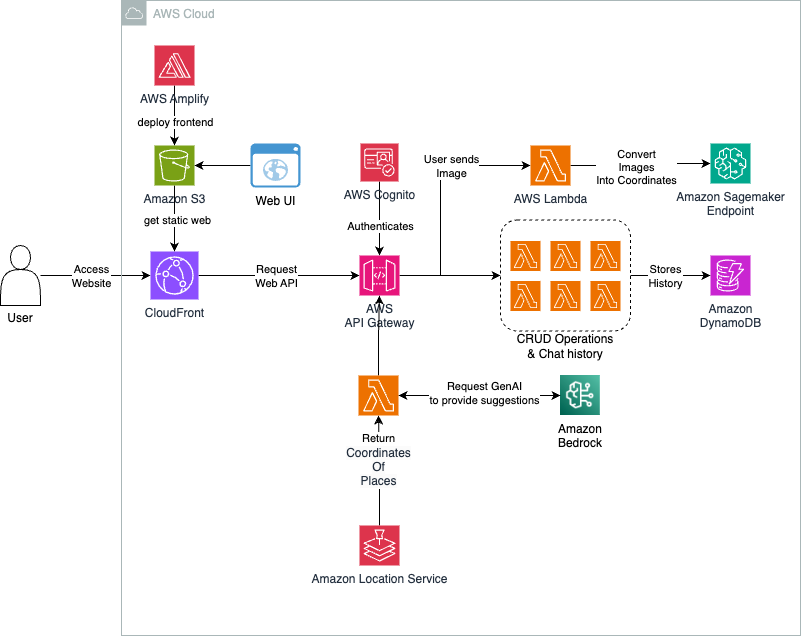
In this post, we show you how to build a generative AI-powered trip-planning service that revolutionizes the way travelers discover and explore destinations. By using advanced AI technology and Amazon Location Service, the trip planner lets users translate inspiration into personalized travel itineraries. This innovative service goes beyond traditional trip planning methods, offering real-time interaction through a chat-based interface and maintaining scalability, reliability, and data security through AWS native services.
Once upon a time I used to study Petroleum Engineering. Honestly, I was enrolled in a bachelor’s degree almost by accident. At school I liked Physics and Math, thus I definitely wanted to study STEM at the university. At that time, I didn’t know anything about the petroleum industry and, like many other people, I thought that oil was extracted from underground lakes. But because I was successfully accepted to this program I decided to try.
I cannot say that I regret of my choice, although I must admit that I haven’t worked in the industry, except the time when I was an intern. But what I got is the scientific approach to solving various tasks, and undoubtedly this is a great gift.
In this post I want to emphasize the importance of knowing the scientific principles and laws. In most cases, they were formulated based on cumulative experience and long-term observations, and therefore have a high variety of applications in very different aspects of human lives. Data Science is not an exception, and even if not applying this accumulated wisdom directly, having an analogy with major scientific methods helps me to solve the challenging data-related tasks in a more effective way.
Case # 1: Decomposition and the Fourier transform
The Fourier transform is a method of decomposing complicated waves or signals into a set of unique sinusoidal components. This decomposition allows us to examine, amplify, attenuate or delete each sinusoidal element.
This is a formal definition of the Fourier transform, from which it is clear that the method is all about decomposition of waves in order to simplify their analysis. Therefore, the Fourier transform is useful in many applications. For instance, music recognition services use the Fourier transform to identify songs. In speech recognition, the Fourier transform and related transforms are used to reconstruct spoken words.
In addition, the Fourier transform is quite useful for image processing. The JPEG compression algorithm is a special case of the Fourier transform used to remove high-frequency components from images.
Personally, I has been applied the fast Fourier transform (or just FFT) for creating image replicas during the reconstruction procedure — this method suits when we don’t have an access to micro-CT scanners, but need some binary images to study main properties of rock samples.
By the way, recently I wrote a post about binary images:
# convert the image to grayscale gray_im = rgb2gray(my_im)
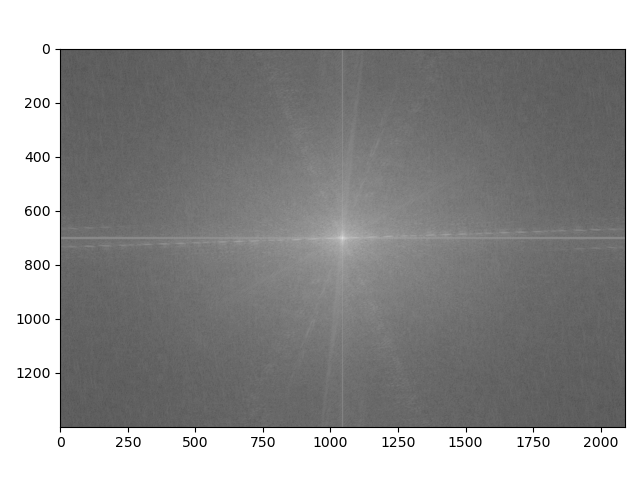
# applying FFT and center shift fourier_im = np.fft.fft2(gray_im) im_shift = np.fft.fftshift(fourier_im) plt.figure('Applying FFT') plt.imshow(np.log(abs(im_shift)), cmap='gray') plt.tight_layout() plt.show()
The output:
Applying FFT. Image by Author.
Here it’s possible to notice two image distortions in a form of crossed lines — they are directly associated to horizontal (clouds) and vertical (street lamp) elements of the photo.
But what if we try to remove the horizontal “noise” associated with clouds in a photograph?
We can use a mask which is created by initializing a zero matrix of the same size as the image in the frequency domain. Central vertical and horizontal strips of ones is set in the mask. Then the mask is applied to the shifted Fourier-transformed image by element-wise multiplication. After filtering, we perform an inverse FFT on the masked frequency data to convert it back to the spatial domain.
# create a mask with ones in the vertical and horizontal strip # let's say width is equal to 100 pixels mask = np.zeros((rows, cols), dtype=np.float32) mask[crow - 50:crow + 50, :] = 1 # vertical strip in the center mask[:, ccol - 50:ccol + 50] = 1 # horizontal strip in the center
# apply the mask to the shifted FFT filtered_im_shift = im_shift * mask
# inverse FFT to get the filtered image back filtered_fourier_im = np.fft.ifftshift(filtered_im_shift) filtered_image = np.fft.ifft2(filtered_fourier_im) filtered_image = np.abs(filtered_image) # Take absolute value
Filtered Image with Vertical and Horizontal Mask. Image by Author.
Case # 2: Superposition principle
The superposition principle is a fundamental concept in physics and engineering, particularly in the fields of wave mechanics, optics, and signal processing. It states that when two or more waves overlap in space, the resultant wave at any point is the sum of the individual waves at that point. This principle applies to linear systems and is crucial for understanding phenomena such as interference and diffraction.
In the context of STEM (Science, Technology, Engineering, and Mathematics), the superposition principle can be applied to analyze various types of waves, including sound waves, electromagnetic waves, and quantum wave functions. It allows engineers and scientists to predict how waves interact with each other, which is essential for designing systems like communication networks, audio equipment, and optical devices.
Mathematical representation
For two sinusoidal waves described by the following equations:
y₁(x, t) = A₁ sin(k₁ x - ω₁ t + φ₁)
y₂(x, t) = A₂ sin(k₂ x - ω₂ t + φ₂)
The resultant wave y(x, t) due to the superposition of these two waves can be expressed as:
y(x, t) = y₁(x, t) + y₂(x, t)
In the above equations A₁ and A₂ are the amplitudes of the waves; k₁ and k₂ are the wave numbers; ω₁ and ω₂ are the angular frequencies; φ₁ and φ₂ are the phase shifts.
Python Script to Calculate Superposition of Two Sinusoidal Waves
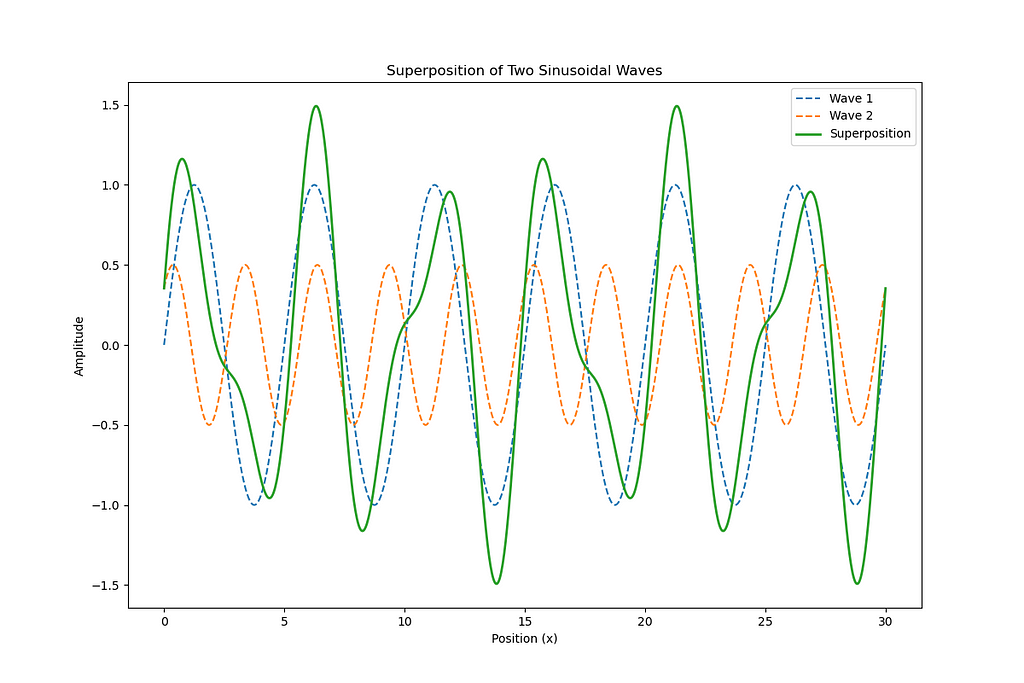
Below is a Python script that calculates and visualizes the superposition of two sinusoidal waves using numpy and matplotlib. The script generates two sinusoidal waves with specified parameters and plots their superposition.
import numpy as np import matplotlib.pyplot as plt
# parameters for the first wave A1 = 1.0 # amplitude k1 = 2 * np.pi / 5 # wave number (2*pi/wavelength) omega1 = 2 * np.pi / 10 # angular frequency (2*pi/period) phi1 = 0 # phase shift
# parameters for the second wave A2 = 0.5 # amplitude k2 = 2 * np.pi / 3 # wave number omega2 = 2 * np.pi / 15 # angular frequency phi2 = np.pi / 4 # phase shift
# create an array of x values x = np.linspace(0, 30, 1000) t = 0 # time at which we calculate the waves
# calculate the individual waves y1 = A1 * np.sin(k1 * x - omega1 * t + phi1) y2 = A2 * np.sin(k2 * x - omega2 * t + phi2)
# calculate the superposition of the two waves y_superposition = y1 + y2
The result of superposition for two sinusoidal waves. Image by Author.
Case # 3: Material balance
The last case of applying scientific methods is a bit ‘theoretical’ one, so I’m not going to insert complicated formulae here at all.
I decided to mention material balance in my post about STEM, because any Data Scientist somehow knows a famous the “garbage in, garbage out” (or just GIGO) formula meaning that low-quality input will produce faulty output, which, I believe, is one of the forms of material balance in Data Science 🙂
Material balance in the GIGO principle. Image by Author.
The GIGO principle in Data Science refers to the idea that the quality of output is determined by the quality of the input. If you provide poor-quality, inaccurate, or irrelevant data (garbage in), the results of your analysis, models, or algorithms will also be flawed or misleading (garbage out). This emphasizes the importance of data quality, cleanliness, and relevance in data science projects, as well as the need for proper data preprocessing and validation to ensure reliable outcomes.
Conclusion
STEM background provides a robust foundation for Data Science, enhancing analytical skills essential for interpreting complex datasets. First, the mathematical principles underpinning statistics and algorithms enable data scientists to develop models that accurately predict trends and behaviors. Second, the scientific method fosters critical thinking and problem-solving abilities, allowing practitioners to formulate hypotheses, conduct experiments, and validate findings systematically. Finally, engineering principles are crucial for building scalable data infrastructures and optimizing performance, ensuring that data solutions are not only effective but also efficient. Together, these STEM disciplines empower Data Scientists to approach challenges with a structured mindset, driving innovation and informed decision-making in an increasingly data-driven world.
I tried to provide 3 simple cases from my personal experience of showing how important STEM education can be for those who want to enter the Data universe. But, of course, much more examples exist in reality, and Noble Prize-2024 in Physics is another bright showcase of STEM importance for DS and ML development. This year’s award was given “for foundational discoveries and inventions that enable machine learning with artificial neural networks.”
Thanks for reading! Although I recommend not just to read about someone else’s experience, but rather to try implement STEM principles in your next Data Science project to see the whole depth behind it 🙂
The articles we feature on our Deep Dives page include detailed walkthroughs of cutting-edge research, explainers on mathematical concepts, and patient tutorials on building and deploying LLM-based tools. Collectively, they represent some of our most thoughtful, in-depth stories.
This week, we invite our community to take a step back from the go-go-go rhythm of daily life and carve out some time to explore a selection of recent Deep Dives—all of which offer nuanced takes on key data science and machine learning topics.
Are you in the mood for tinkering with some code? Would you rather reflect on some of the Big Questions shaping debates around AI? Either way, we’ve got you covered: the lineup we put together in this special edition of the Variable covers a lot of ground, and offers multiple entryways into complex (and fascinating) conversations. Choose your own adventure!
Gen-AI Safety Landscape: A Guide to the Mitigation Stack for Text-to-Image Models “Given the potential risks tied to image generation and inpainting capabilities, it is necessary to establish a robust safety mitigation stack across different stages of the model’s lifecycle.” Trupti Bavalatti unpacks the different approaches currently available to address the inherent risks in generative-AI image tools.
A Gentle Introduction to the DCIN for Decentralized Inference How does a decentralized collaborative intelligence network work? Marcello Politi presents the work he and his team have focused on in recent months: a network of nodes that share computational power to execute inference on open source models, “where computation is distributed dynamically and efficiently, while also maintaining a high level of security and rewarding users for sharing their computation.”
Les Misérables Social Network Analysis Using Marimo Notebooks and the NetworkX Python Library Network analysis has numerous use cases in day-to-day data science workflows—and it can also help us detect patterns and relationships in works of art. Case in point: Maria Mouschoutzi, PhD’s fascinating project, which relies on the NetworkX library and Marimo notebooks to study the intricate social landscape represented in Victor Hugo’s Les Misérables. Whether you’re team Valjean or team Javert—or just into learning about new data science tools—you should add it to your reading list.
Let There Be Light! Diffusion Models and the Future of Relighting Diffusion models made a splashy entrance a few years ago, and researchers have devoted a lot of time and energy into optimizing their performance ever since. Pulkit Gera offers a comprehensive review of recent work on one key aspect for these models: relighting, “the task of rendering a scene under a specified target lighting condition, given an input scene.”
Lessons in Decision Making from the Monty Hall Problem It’s always rewarding to approach a well-known topic from a fresh, thought-provoking angle. That’s exactly what you’ll find in Eyal Kazin’s accessible and comprehensive primer on the the classic Monty Hall problem, looking at it from three distinct perspectives and digging into its underlying math and real-world applications.
A Critical Look at AI Image Generation “The point I want to make is that these are not free of influence from culture and society — whether that influence is good or bad.” Stephanie Kirmer reflects on image-generation models holistically, taking into account the limitations of their aesthetics and the potential biases they reflect.
Paper Walkthrough: Attention Is All You Need It’s likely that no recent ML paper has generated as many guides, explainers, and tutorials as Vaswani et al.’s 2017 landmark contribution. Why share another one, you might ask? Read Muhammad Ardi’s terrific deep dive and we suspect you’ll see the point: it does an excellent job unpacking the Transformer’s key components and balancing theory with hands-on implementation.
SQL and Data Modelling in Action: A Deep Dive into Data Lakehouses For anyone taking their first steps working with databases, complex data architectures, and/or SQL, we highly recommend Sarah Lea’s beginner-friendly—but detailed and meticulous—primer, which tackles the basics of SQL and data modeling for cloud applications.
Thank you for supporting the work of our authors! As we mentioned above, we love publishing articles from new authors, so if you’ve recently written an interesting project walkthrough, tutorial, or theoretical reflection on any of our core topics, don’t hesitate to share it with us.
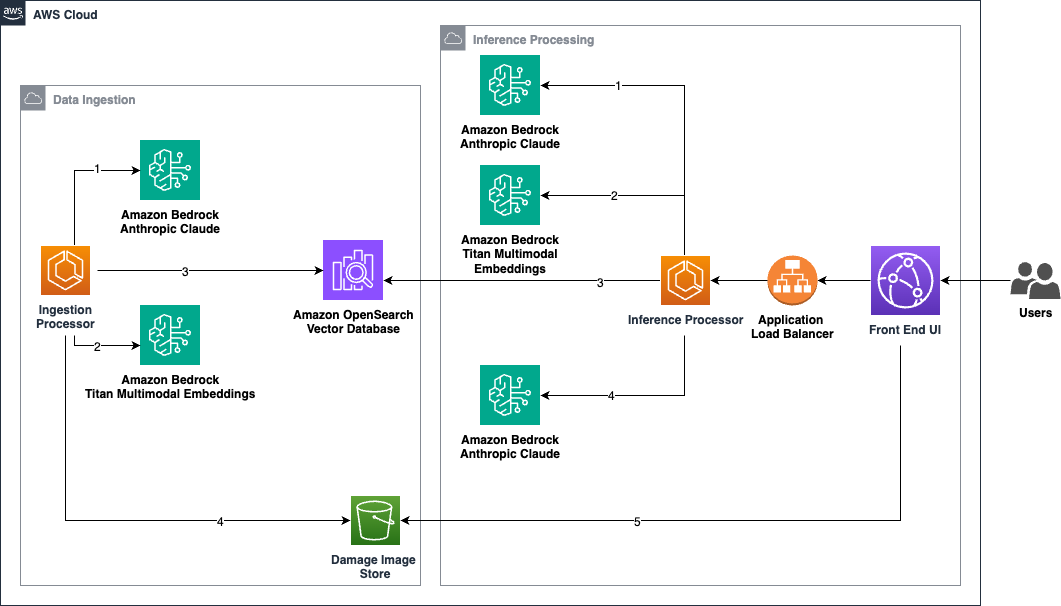
This post explores a solution that uses the power of AWS generative AI capabilities like Amazon Bedrock and OpenSearch vector search to perform damage appraisals for insurers, repair shops, and fleet managers.
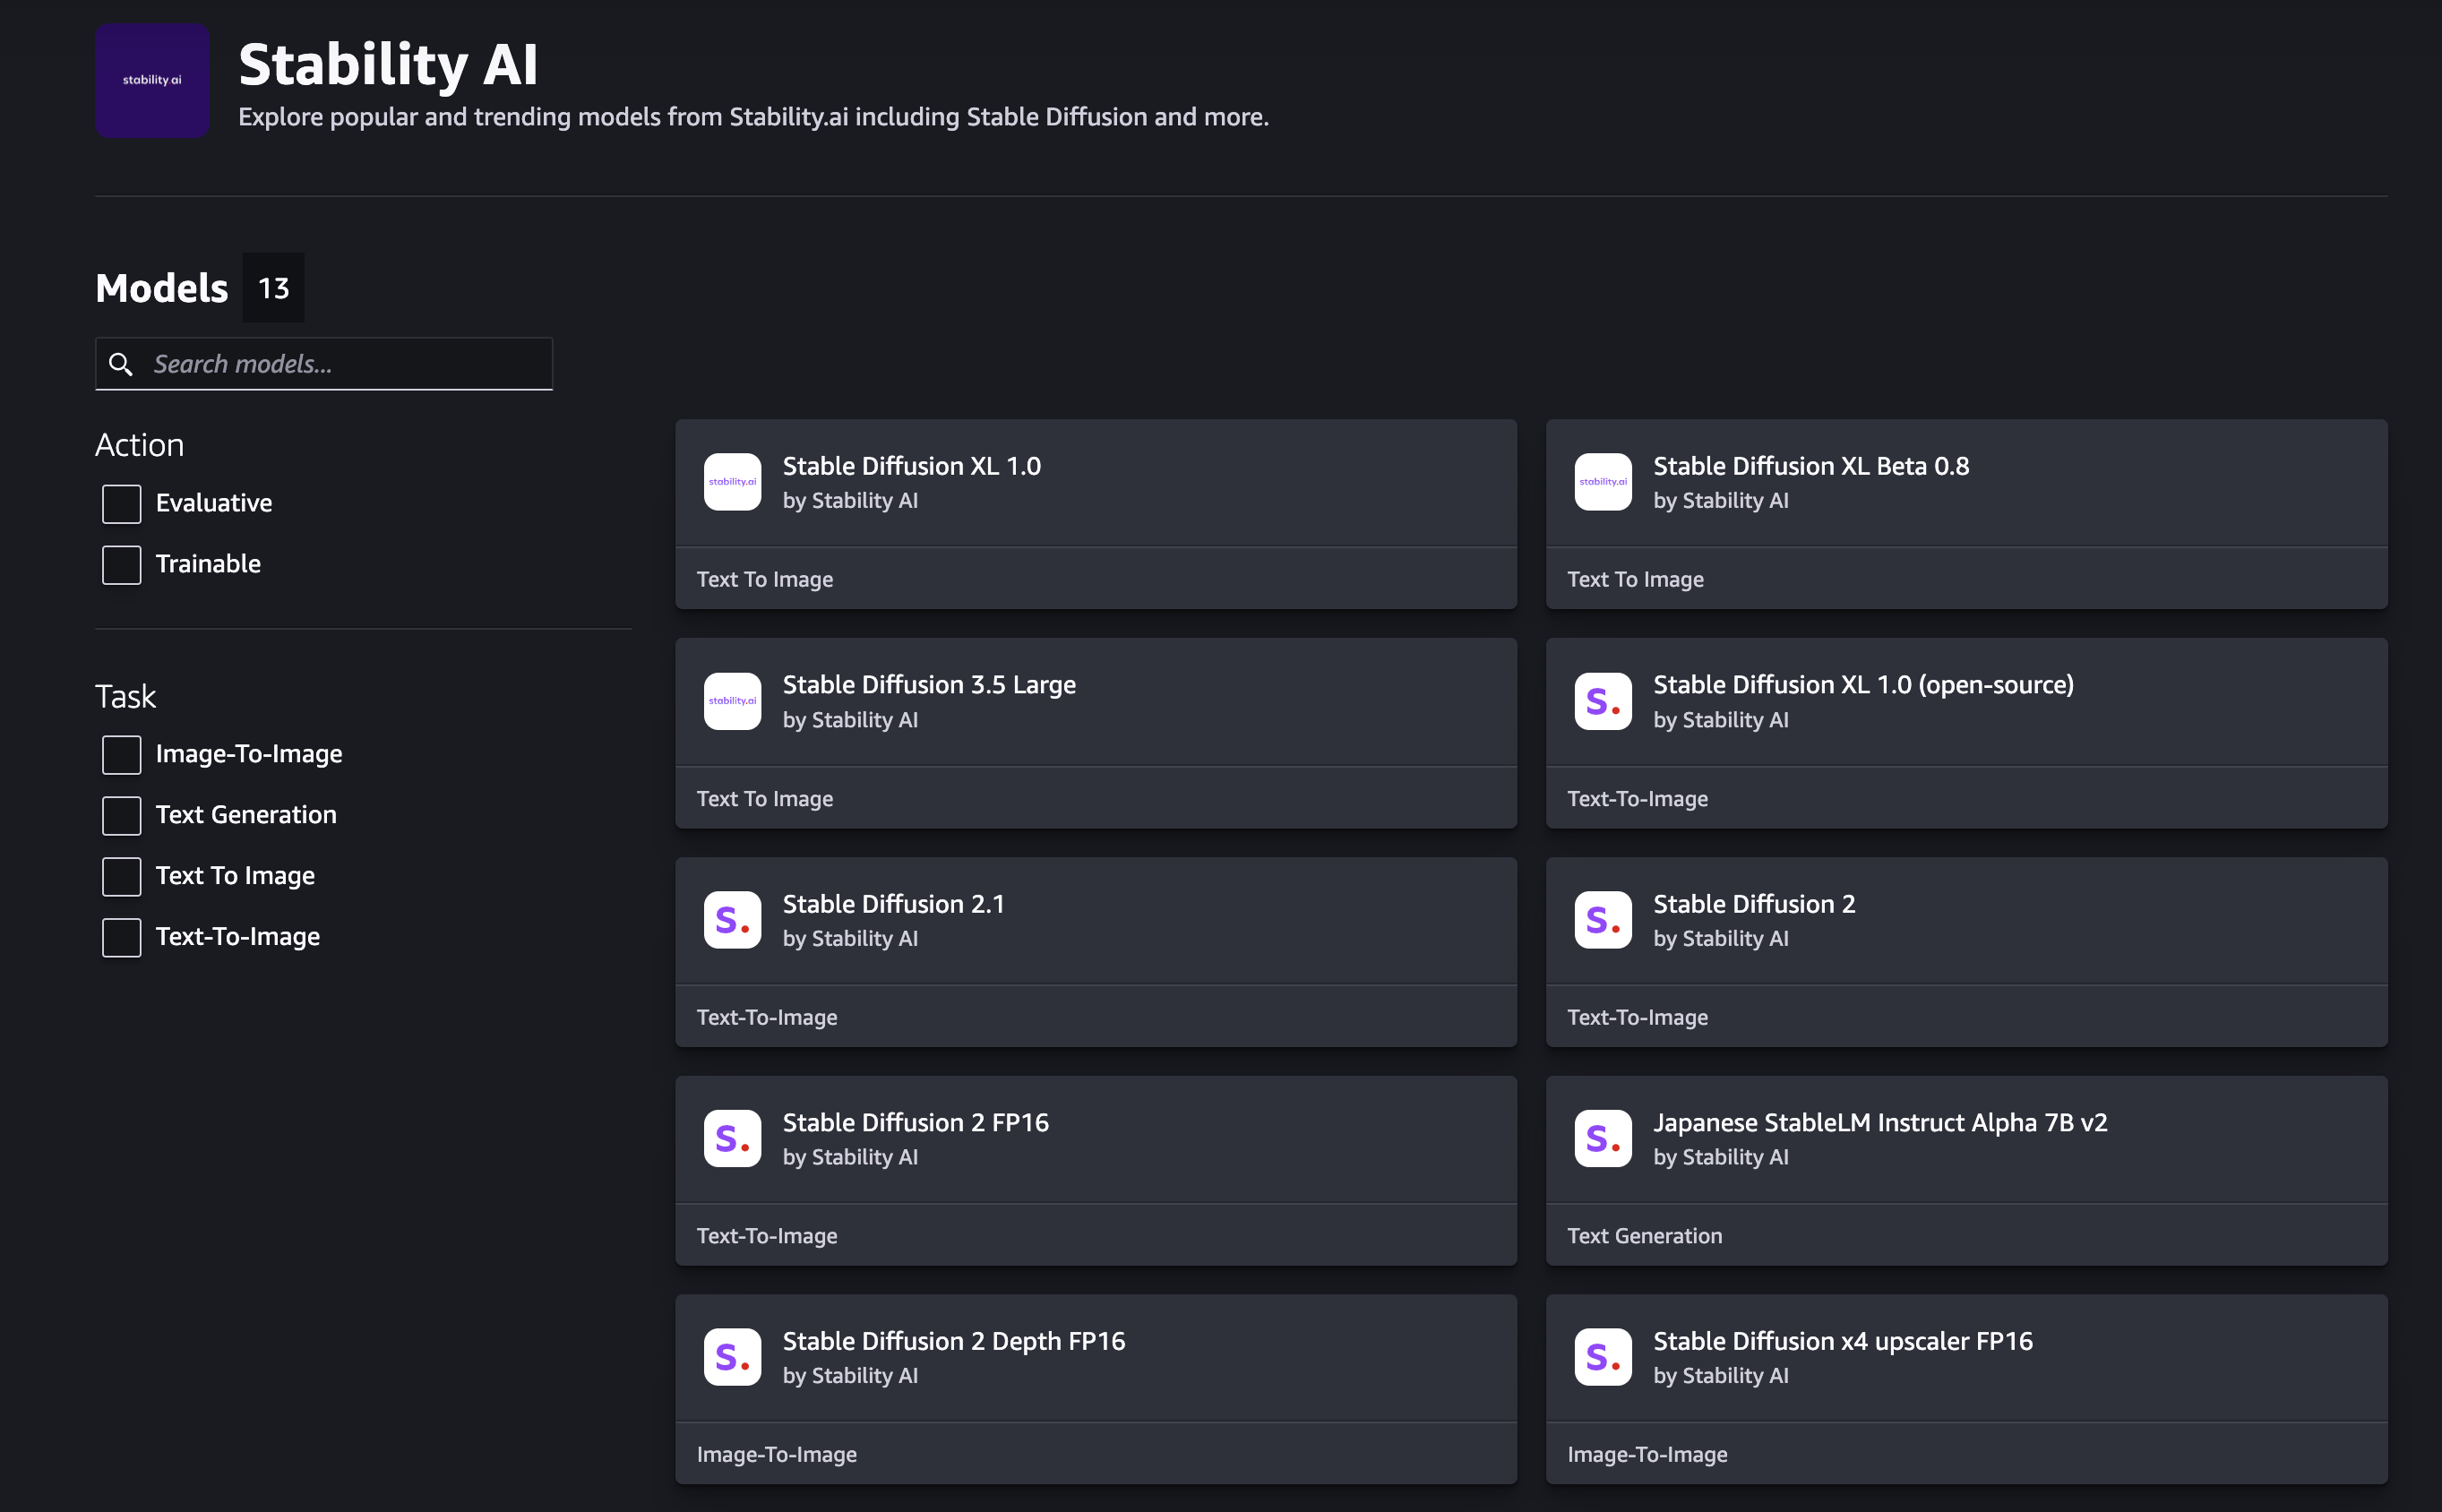
Stability AI’s newest launch of Stable Diffusion 3.5 Large (SD3.5L) on Amazon SageMaker JumpStart enhances image generation, human anatomy rendering, and typography by producing more diverse outputs and adhering closely to user prompts, making it a significant upgrade over its predecessor. In this post, we explore advanced prompt engineering techniques that can enhance the performance of these models and facilitate the creation of compelling imagery through text-to-image transformations.
We are excited to announce the availability of Stability AI’s latest and most advanced text-to-image model, Stable Diffusion 3.5 Large, in Amazon SageMaker JumpStart. In this post, we provide an implementation guide for subscribing to Stable Diffusion 3.5 Large in SageMaker JumpStart, deploying the model in Amazon SageMaker Studio, and generating images using text-to-image prompts.
We use cookies on our website to give you the most relevant experience by remembering your preferences and repeat visits. By clicking “Accept”, you consent to the use of ALL the cookies.
This website uses cookies to improve your experience while you navigate through the website. Out of these, the cookies that are categorized as necessary are stored on your browser as they are essential for the working of basic functionalities of the website. We also use third-party cookies that help us analyze and understand how you use this website. These cookies will be stored in your browser only with your consent. You also have the option to opt-out of these cookies. But opting out of some of these cookies may affect your browsing experience.
Necessary cookies are absolutely essential for the website to function properly. These cookies ensure basic functionalities and security features of the website, anonymously.
Cookie
Duration
Description
cookielawinfo-checkbox-analytics
11 months
This cookie is set by GDPR Cookie Consent plugin. The cookie is used to store the user consent for the cookies in the category "Analytics".
cookielawinfo-checkbox-functional
11 months
The cookie is set by GDPR cookie consent to record the user consent for the cookies in the category "Functional".
cookielawinfo-checkbox-necessary
11 months
This cookie is set by GDPR Cookie Consent plugin. The cookies is used to store the user consent for the cookies in the category "Necessary".
cookielawinfo-checkbox-others
11 months
This cookie is set by GDPR Cookie Consent plugin. The cookie is used to store the user consent for the cookies in the category "Other.
cookielawinfo-checkbox-performance
11 months
This cookie is set by GDPR Cookie Consent plugin. The cookie is used to store the user consent for the cookies in the category "Performance".
viewed_cookie_policy
11 months
The cookie is set by the GDPR Cookie Consent plugin and is used to store whether or not user has consented to the use of cookies. It does not store any personal data.
Functional cookies help to perform certain functionalities like sharing the content of the website on social media platforms, collect feedbacks, and other third-party features.
Performance cookies are used to understand and analyze the key performance indexes of the website which helps in delivering a better user experience for the visitors.
Analytical cookies are used to understand how visitors interact with the website. These cookies help provide information on metrics the number of visitors, bounce rate, traffic source, etc.
Advertisement cookies are used to provide visitors with relevant ads and marketing campaigns. These cookies track visitors across websites and collect information to provide customized ads.