Tag: AI

  • Building an Explainable Reinforcement Learning Framework

    Building an Explainable Reinforcement Learning Framework

    Dani Lisle

    Explainable Results Through Symbolic Policy Discovery

    Symbolic genetic algorithms, action potentials, and equation trees

    We’ve learned to train models that can beat world champions at a games like Chess and Go, with one major limitation: explainability. Many methods exist to create a black-box model that knows how to play a game or system better than any human, but creating a model with a human-readable closed-form strategy is another problem altogether.

    The potential upsides of being better at this problem are plentiful. Strategies that humans can quickly understand don’t stay in a codebase — they enter the scientific literature, and perhaps even popular awareness. They could contribute a reality of augmented cognition between human and computer, and reduce siloing between our knowledge as a species and the knowledge hidden, and effectively encrypted deep in a massive high-dimensional tensors.

    But if we had more algorithms to provide us with such explainable results from training, how would we encode them in a human-readable way?

    One of the most viable options is the use of differential equations (or difference equations in the discrete case). These equations, characterized by their definition of derivatives, or rates of change of quantities, give us an efficient way to communicate and intuitively understand the dynamics of almost any system. Here’s a famous example that relates the time and space derivatives of heat in a system:

    Heat Equation in ‘n’ Dimensions (Wikipedia: “Heat Equation”)

    In fact, work has been done in the way of algorithms that operate to evolve such equations directly, rather than trying to extract them (as knowledge) from tensors. Last year I authored a paper which detailed a framework for game theoretic simulations using dynamics equation which evolve symbol-wise via genetic algorithms. Another paper by Chen et al. presented work on a symbolic genetic algorithm for discovering partial differential equations which, like the heat equation, describe the dynamics of a physical system. This group was able to mine such equations from generated datasets.

    But consider again the game of Chess. What if our capabilities in the computational learning of these equations were not limited to mere predictive applications? What if we could use these evolutionary techniques to learn optimal strategies for socioeconomic games in the real world?

    In a time where new human and human-machine relationships, and complex strategies, are entering play more quickly than ever, computational methods to find intuitive and transferable strategic insight have never been more valuable. The opportunities and potential threats are both compelling and overwhelming.

    Let’s Begin

    All Python code discussed in this article are accessible in my running GitHub repo for the project: https://github.com/dreamchef/abm-dynamics-viz.

    In a recent article I wrote about simulating dynamically-behaving agents in a theoretic game. As much as I’d like to approach such multi-agent games using symbolic evolution, it’s wise to work atomically, expand our scope, and take advantage of some previous work. Behind the achievements of groups like DeepMind in creating models with world-class skill at competitive board games is a sub-discipline of ML: reinforcement learning. In this paradigm, agents have an observation space (variables in their environment which they can measure and use as values), an action space (ways to interact with or move/change in the environment), and a reward system. Over time through experimentation, the reward dynamics allow them to build a strategy, or policy, which maximizes reward.

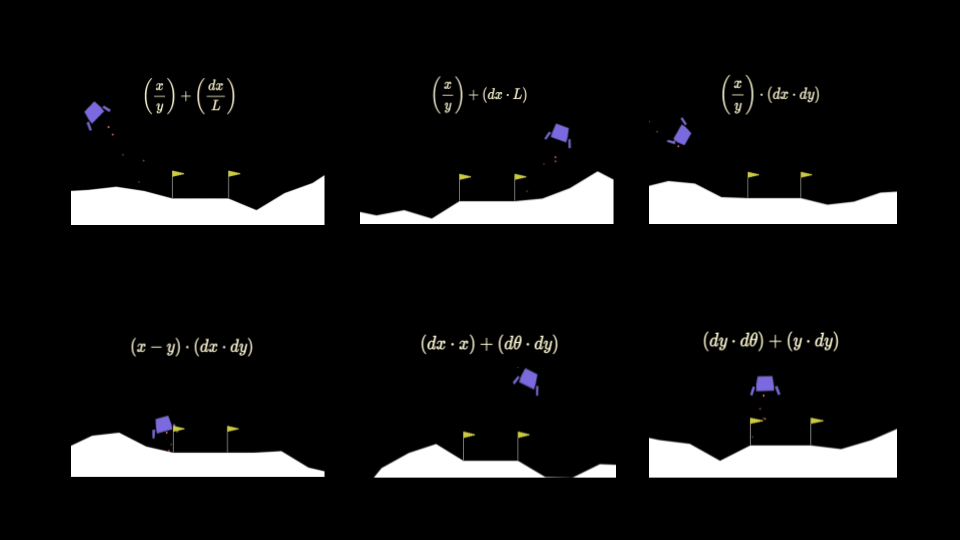
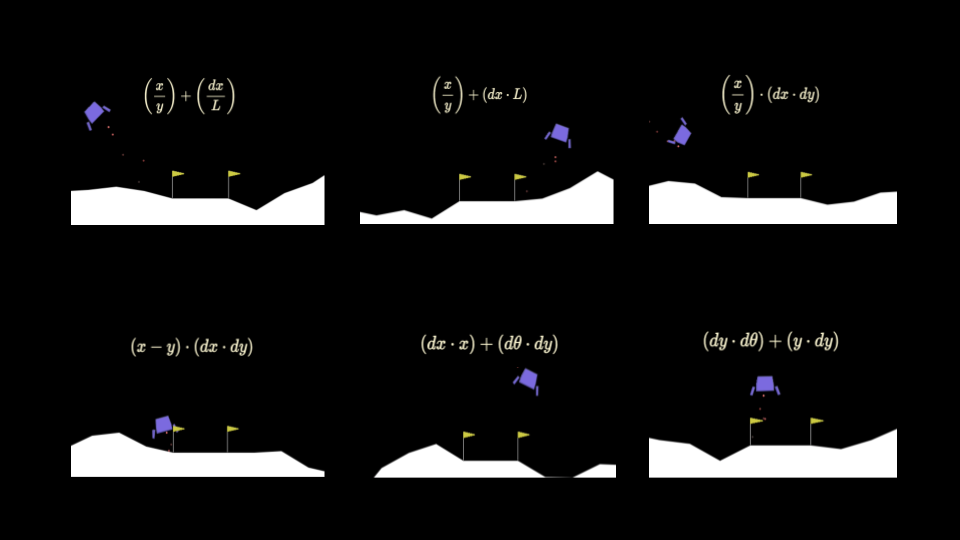
    We can apply our symbolic genetic algorithms to some classic reinforcement learning problems in order to explore and fine tune them. The Gymnasium library provides a collection of games and tasks perfect for reinforcement learning experiments. One such game which I determined to be well-suited to our goals is “Lunar Lander”.
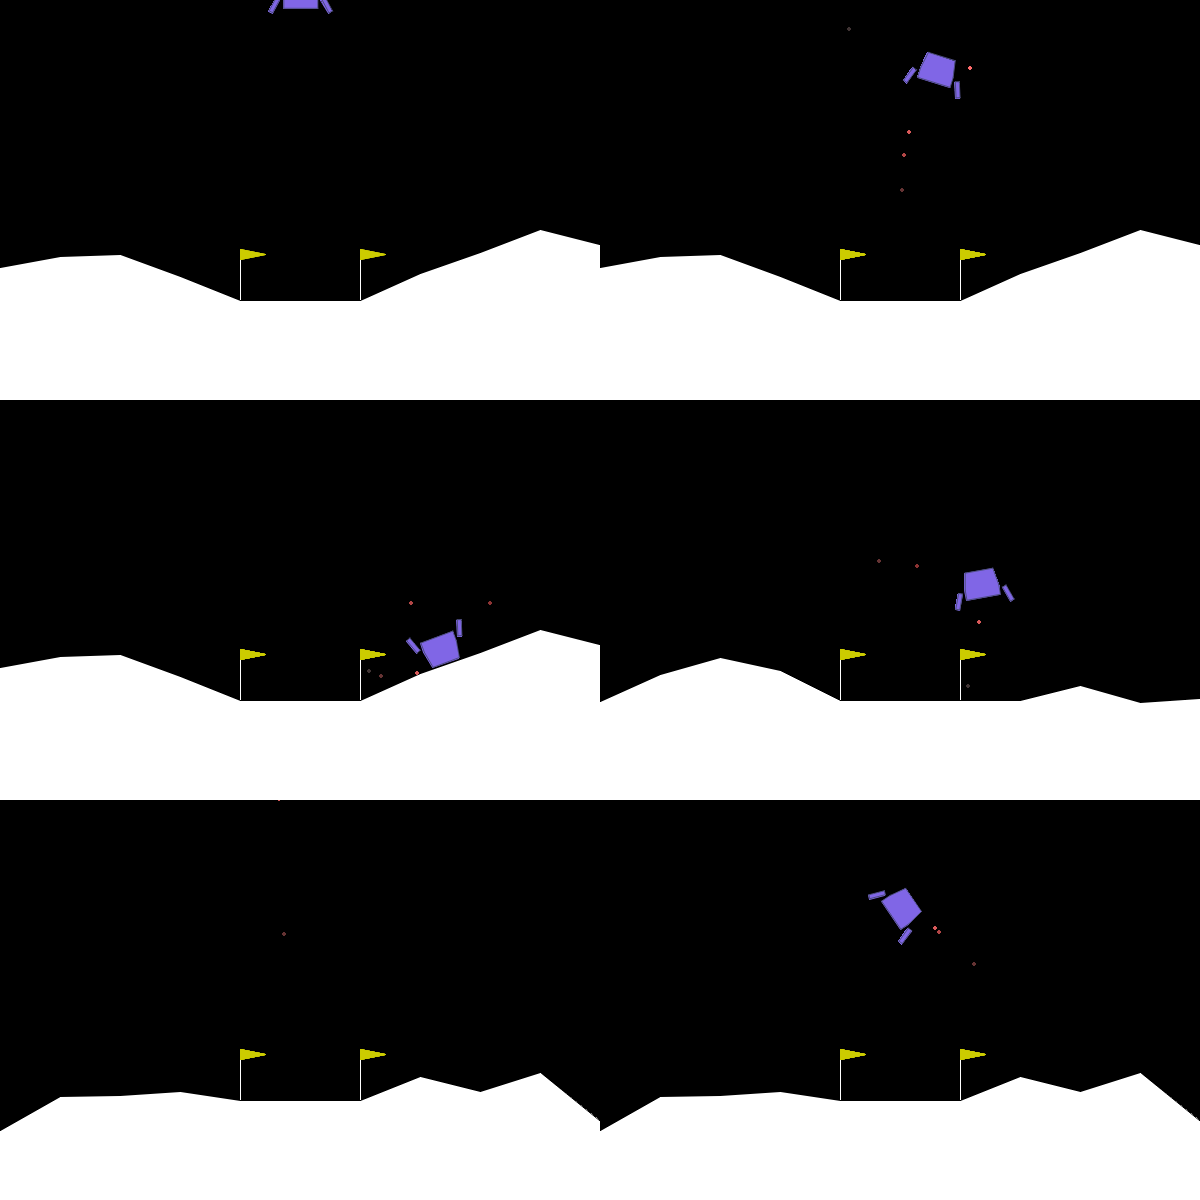
    Lunar Lander (Credit: Gymnasium)

    The game is specified as follows:

    • Observation space (8): x,y position, x, y velocity, angle, angular velocity, left, right foot touching ground. Continuous.
    • Action space (4): no engine, bottom, left, right engine firing. Discrete.

    Learning Symbolic Policies for the Lander Task

    You might have noticed that while the variables like velocity and angle are continuous, action space is discrete. So how do we define a function that takes continuous inputs and outputs, effectively, a classification? In fact this is a well-known problem and the common approach is using an Action Potential function.

    Action Potential Equation

    Named after the neurological mechanism, which operates as a threshold, a typical Action Potential function calculates a continuous value from the inputs, and outputs:

    • True output if the continuous value is at or above a threshold.
    • False is the output is below.

    In our problem, we actually need to get a discrete output in 4 possible values. We could carefully consider the dynamics of the task in devising this system, but I chose a naive approach, as a semi-adversarial effort to put more pressure on our SGA algorithm to ultimately shine through. It uses the general intuition that near the target probably means we shouldn’t use the side thrusters as much:

                
    def potential_to_action(potential):

    if abs(potential-0) < 0.5:
    return 0

    elif abs(potential-0) < 1:
    return 2

    elif potential < 0:
    return 1

    else:
    return 3

    With this figured out, let’s make a roadmap for the rest of our journey. Our main tasks will be:

    1. Evolutionary structure in which families and generations of equations can exist and compete.
    2. Data structure to store equations (which facilitates their genetic modification).
    3. Symbolic mutation algorithm— how and what will we mutate?
    4. Selection method — which and how many candidates will we bring to the next round?
    5. Evaluation method — how will we measure the fitness of an equation?

    Evolutionary Structure

    We start by writing out the code on a high-level and leaving some of the algorithm implementations for successive steps. This mostly takes the form of an array where we can store the population of equations and a main loop that evolves them for the specified number of generations while calling the mutation, selection/culling, and testing algorithms.

    We can also define a set of parameters for the evolutionary model including number of generations, and specifying how many mutations to create and select from each parent policy.

    The following code

    last_gen = [F]

    for i in range(GENS):
    next_gen = []

    for policy in last_gen:
    batch = cull(mutants(policy))

    for policy in batch:
    next_gen.append(policy)

    last_gen = next_gen

    Finally it selects the best-performing policies, and validates them using another round of testing (against Lunar Lander simulation rounds):

    last_gen.sort(key=lambda x: x['score'])

    final_cull = last_gen [-30:]

    for policy in final_cull:

    policy['score'] = score_policy(policy,ep=7)

    final_cull.sort(key=lambda x: x['score'])

    print('Final Popluation #:',len(last_gen))

    for policy in final_cull:
    print(policy['AP'])
    print(policy['score'])
    print('-'*20)

    env.close()

    Data Structure to Store Equations

    We start by choosing a set of binary and unary operators and operands (from the observation space) which we represent and mutate:

    BIN_OPS = ['mult','add','sub', 'div']
    UN_OPS = ['abs','exp','log','sqrt','sin','cos']
    OPNDS = ['x','y','dx','dy','angle','dangle','L','R']

    Then we borrow from Chen et al. the idea of encoding equations int the form of trees. This will allow us to iterate through the equations and mutate the symbols as individual objects. Specifically I chose to do using nested arrays the time being. This example encodes x*y + dx*dy:

    F = {'AP': ['add', 
    ['mult','x','y'],
    ['mult','dx','dy']],
    'score': 0
    }

    Each equation includes both the tree defining its form, and a score object which will store its evaluated score in the Lander task.

    Symbolic Mutation Algorithm

    We could approach the mutation of algorithms in a variety of ways, depending on our desired probability distribution for modifying different symbols in the equations. I used a recursive approach where at each level of the tree, the algorithm randomly chooses a symbol, and in the case of a binary operator, moves down to the next level to choose again.

    The following main mutation function accepts a source policy and outputs an array including the unchanged source and mutated policies.

    def mutants(policy, sample=1):
    children = [policy]
    mutation_target = policy

    for i in range(REPL):
    new_policy = copy.deepcopy(policy)
    new_policy['AP'] = mutate_recursive(new_policy['AP'])
    children.append(new_policy)

    return children

    This helper function contains recursive algorithm:

    def mutate_recursive(target, probability=MUTATE_P):

    # Recursive case
    if isinstance(target, list):
    random_element = random.choice(range(len(target)))
    target[random_element] = mutate_recursive(target[random_element])
    return target

    # Base cases
    elif(target in BIN_OPS):
    new = random.choice(BIN_OPS)
    return new

    elif(target in UN_OPS):
    new = random.choice(UN_OPS)
    return new

    elif(target in OPNDS):
    new = random.choice(OPNDS)
    return new

    Selection Method

    Selecting the best policies will involve testing them to get a score and then deciding on a way to let them compete and progress to further stages of evolution. Here I used an evolutionary family tree structure in which each successive generation in a family, or batch (e.g. the two on the lower left), contains children with one mutation that differentiates them from the parent.

                    +----------+
    | x + dy^2 |
    +----------+
    |
    +----------+----------+
    | |
    +----v----+ +----v----+
    | y + dy^2| | x / dy^2|
    +---------+ +---------+
    | |
    +----+----+ +----+-----+
    | | | |
    +---v--+-+ +--v---+-+ +--v-----+ +--v-----+
    |y - dy^2| |y - dy^2| |x / dx^2| |y - dy^3|
    +--------+ +--------+ +--------+ +--------+

    After scoring of the equations, each batch of equations is ranked and the best N are kept in the running, while the rest are discarded:

    def cull(batch):

    for policy in batch[1:]:
    policy['score'] = score_policy(policy)

    batch.sort(key=lambda x: x['score'], reverse=True)

    return batch[:CULL]

    Scoring Methods Through Simulation Episodes

    To decide which equations encode the best policies, we use the Gymnasium framework for the Lunar Lander task.

    def score_policy(policy, ep=10, render=False):
    observation = env.reset()[0] # Reset the environment to start a new episode
    total_reward = 0
    sample = 0

    for episode in range(ep):

    while True:
    if render:
    env.render()

    values = list(observation)
    values = {'x': values[0],
    'y': values[1],
    'dx': values[2],
    'dy': values[3],
    'angle': values[4],
    'dangle': values[5],
    'L': values[6],
    'R': values[7]
    }

    potential = policy_compute(policy['AP'], values)
    action = potential_to_action(potential)

    sample += 1

    observation, reward, done, info = env.step(action)[:4]
    total_reward += reward

    if done: # If the episode is finished
    break

    return total_reward/EPISODES

    The main loop for scoring runs the number of episodes (simulation runs) specified, and in each episode we see the fundamental reinforcement learning paradigm.

    From a starting observation, the information is used to compute an action via our method, the action interacts with the environment, and the observation for the next step is obtained.

    Since we store the equations as trees, we need a separate method to compute the potential from this form. The following function uses recursion to obtain a result from the encoded equation, given the observation values:

    def policy_compute(policy, values):

    if isinstance(policy, str):
    if policy in values:
    return values[policy]
    else:
    print('ERROR')

    elif isinstance(policy, list):
    operation = policy[0]
    branches = policy[1:]

    if operation in BIN_OPS:

    if len(branches) != 2:
    raise ValueError(f"At {policy}, Operation {operation} expects 2 operands, got {len(branches)}")

    operands = [operand for operand in branches]

    left = policy_compute(operands[0], values)
    right = policy_compute(operands[1], values)

    if operation == 'add':
    return left + right
    elif operation == 'sub':
    return left - right
    elif operation == 'mult':
    if left is None or right is None:
    print('ERROR: left:',left,'right:',right)
    return left * right
    elif operation == 'div':
    if right == 0:
    return 0
    return left / right

    elif operation in UN_OPS:
    if len(branches) != 1:
    raise ValueError(f"Operation {operation} expects 1 operand, got {len(branches)}")

    operand_value = policy_compute(next(iter(branches)), values)

    if operation == 'abs':
    return abs(operand_value)
    elif operation == 'exp':
    return math.exp(operand_value)
    elif operation == 'logabs':
    return math.log(abs(operand_value))
    elif operation == 'sin':
    return math.sin(operand_value)
    elif operation == 'cos':
    return math.cos(operand_value)
    elif operation == 'sqrtabs':
    return math.sqrt(abs(operand_value))

    else:
    raise ValueError(f"Unknown operation: {operation}")

    else:
    print('ERROR')
    return 0

    The code above goes through each level of the tree, checks if the current symbol is an operand or operator, and according either computes the right/left side recursively or returns back in the recursive stack to do the appropriate operator computations.

    Next Steps

    This concluded the implementation. In the next article in this series, I’ll be explaining the results of training, motivating changes in the experimental regime, and exploring pathways to expand the training framework by improving the mutation and selection algorithms.

    In the meantime, you can access here the slides for a recent talk I gave at the 2024 SIAM Front Range Student Conference at University of Colorado Denver which discussed preliminary training results.

    All code for this project is on my repo: https://github.com/dreamchef/abm-dynamics-viz. I’d love to hear what else you may find, or your thoughts on my work, in the comments! Feel free to reach out to me on Twitter and LinkedIn as well.

    All images were created by the author except where otherwise noted.


    Building an Explainable Reinforcement Learning Framework was originally published in Towards Data Science on Medium, where people are continuing the conversation by highlighting and responding to this story.

    Originally appeared here:
    Building an Explainable Reinforcement Learning Framework

    Go Here to Read this Fast! Building an Explainable Reinforcement Learning Framework
  • Towards increased truthfulness in LLM applications

    Towards increased truthfulness in LLM applications

    Marlon Hamm

    Application-oriented methods from current research

    Abstract

    This article explores methods to enhance the truthfulness of Retrieval Augmented Generation (RAG) application outputs, focusing on mitigating issues like hallucinations and reliance on pre-trained knowledge. I identify the causes of untruthful results, evaluate methods for assessing truthfulness, and propose solutions to improve accuracy. The study emphasizes the importance of groundedness and completeness in RAG outputs, recommending fine-tuning Large Language Models (LLMs) and employing element-aware summarization to ensure factual accuracy. Additionally, it discusses the use of scalable evaluation metrics, such as the Learnable Evaluation Metric for Text Simplification (LENS), and Chain of Thought-based (CoT) evaluations, for real-time output verification. The article highlights the need to balance the benefits of increased truthfulness against potential costs and performance impacts, suggesting a selective approach to method implementation based on application needs.

    1. Introduction

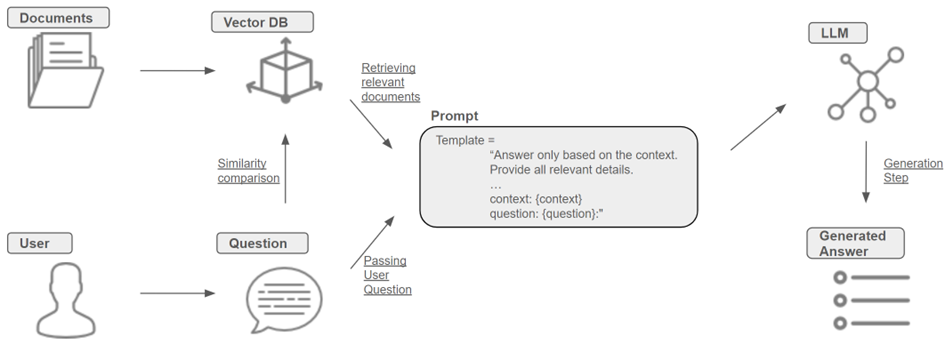
    A widely used Large Language Model (LLM) architecture which can provide insight into application outputs and reduce hallucinations is Retrieval Augmented Generation (RAG). RAG is a method to expand LLM memory by combining parametric memory (i.e. LLM pre-trained) with non-parametric (i.e. document retrieved) memories. To do this, the most relevant documents are retrieved from a vector database and, together with the user question and a customised prompt, passed to an LLM, which generates a response (see Figure 1). For further details, see Lewis et al. (2021).

    Figure 1 — Simplified RAG architecture

    A real-world application can, for instance, connect an LLM to a database of medical guideline documents. Medical practitioners can replace manual look-up by asking natural language questions using RAG as a “search engine”. The application would answer the user’s question and reference the source guideline. If the answer is based on parametric memory, e.g. answering on guidelines contained in the pre-training but not the connected database, or if the LLM hallucinates, this could have drastic implications.

    Firstly, if the medical practitioners verify with the referenced guidelines, they could lose trust in the application answers, leading to less usage. Secondly, and more worryingly, if not every answer is verified, an answer can be falsely assumed to be based on the queried medical guidelines, directly affecting the patient’s treatment. This highlights the relevance of the truthfulness of output in RAG applications.

    In this article assessing RAG, truth is defined as being firmly grounded in factual knowledge of the retrieved document. To investigate this issue, one General Research Question (GRQ) and three Specific Research Questions (SRQ) are derived.

    GRQ: How can the truthfulness of RAG outputs be improved?

    SRQ 1: What causes untruthful results to be generated by RAG applications?

    SRQ 2: How can truthfulness be evaluated?

    SRQ 3: What methods can be used to increase truthfulness?

    To answer the GRQ, the SRQs are analysed sequentially on the basis of literature research. The aim is to identify methods that can be implemented for use cases such as the above example from the medical field. Ultimately two categories of solution methods will be recommended for further analysis and customisation.

    2. Untruthful RAG output

    As previously defined, a truthful answer should be firmly grounded in factual knowledge of the retrieved document. One metric for this is factual consistency, measuring if the summary contains untruthful or misleading facts that are not supported by the source text (Liu et al., 2023). It is used as a critical evaluation metric in multiple benchmarks (Kim et al., 2023; Fabbri et al., 2021; Deutsch & Roth, 2022; Wang et al., 2023; Wu et al., 2023). In the area of RAG, this is often referred to as groundedness (Levonian et al., 2023). Moreover, to take the usefulness of a truthful answer into consideration, its completeness is also of relevance. The following paragraphs give insight into the reason behind untruthful RAG results. This refers to the Generation Step in Figure 1, which summarises the retrieved documents with respect to the user question.

    Firstly, the groundedness of an RAG application is impacted if the LLM answer is based on parametric memory rather than the factual knowledge of the retrieved document. This can, for instance, occur if the answer comes from pre-trained knowledge or is caused by hallucinations. Hallucinations still remain a fundamental problem of LLMs (Bang et al., 2023; Ji et al., 2023; Zhang & Gao, 2023), from which even powerful LLMs suffer (Liu et al., 2023). As per definition, low groundedness results in untruthful RAG results.

    Secondly, completeness describes if an LLM´s answer lacks factual knowledge from the documents. This can be due to the low summarisation capability of an LLM or missing domain knowledge to interpret the factual knowledge (T. Zhang et al., 2023). The output could still be highly grounded. Nevertheless, an answer could be incomplete with respect to the documents. Leading to incorrect user perception of the content of the database. In addition, if factual knowledge from the document is missing, the LLM can be encouraged to make up for this by answering with its own parametric memory, raising the abovementioned issue.

    Having established the key causes of untruthful outputs, it is necessary to first measure and quantify these errors before a solution can be pursued. Therefore, the following section will cover the methods of measurement for the aforementioned sources of untruthful RAG outputs.

    3. Evaluating truthfulness

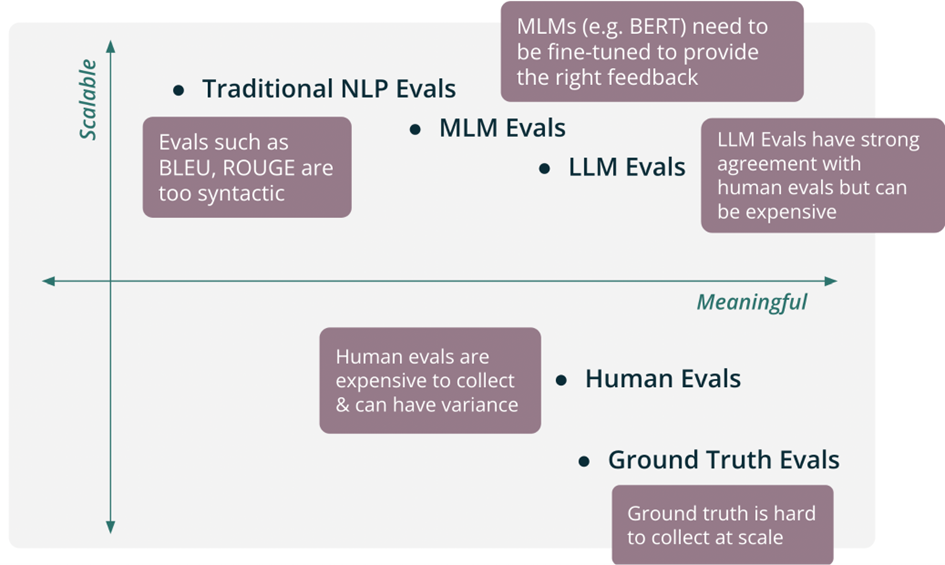
    Having elaborated on groundedness and completeness and their origins, this section intends to guide through their measurement methods. I will begin with the widely known general-purpose methods and continue by highlighting recent trends. TruLens´s Feedback Functions plot serves here as a valuable reference for scalability and meaningfulness (see Figure2).

    When talking about natural language generation evaluations, traditional evaluation metrics like ROUGE (Lin, 2004) and BLEU (Papineni et al., 2002) are widely used but tend to show a discrepancy from human assessments (Liu et al., 2023). Furthermore, Medium Language Models (MLMs) have demonstrated superior results to traditional evaluation metrics, but can be replaced by LLMs in many areas (X. Zhang & Gao, 2023). Lastly, another well-known evaluation method is the human evaluation of generated text, which has apparent drawbacks of scale and cost (Fabbri et al., 2021). Due to the downsides of these methods (see Figure 2), these are not relevant for further consideration in this paper.

    Figure 2 — Feedback functions (Feedback Functions — TruLens, o. J.)

    Concerning recent trends, evaluation metrics have developed with the increase in the popularity of LLMs. One such development are LLM evaluations, allowing another LLM through Chain of Thought (CoT) reasoning to evaluate the generated text (Liu et al., 2023). Through bespoke prompting strategies, areas of focus like groundedness and completeness can be emphasised and numerically scored (Kim et al., 2023). For this method, it has been shown that a larger model size is beneficial for summarisation evaluation (Liu et al., 2023). Moreover, this evaluation can also be based on references or collected ground truth, comparing generated text and reference text (Wu et al., 2023). For open-ended tasks without a single correct answer, LLM-based evaluation outperforms reference-based metrics in terms of correlation with human quality judgements. Moreover, ground-truth collection can be costly. Therefore, reference or ground-truth based metrics are outside the scope of this assessment (Liu et al., 2023; Feedback Functions — TruLens, o. J.).

    Concluding with a noteworthy recent development, the Learnable Evaluation Metric for Text Simplification (LENS), stated to be “the first supervised automatic metric for text simplification evaluation” by Maddela et al. (2023), has demonstrated promising outcomes in recent benchmarks. It is recognized for its effectiveness in identifying hallucinations (Kew et al., 2023). In terms of scalability and meaningfulness this is expected to be slightly more scalable, due to lower cost, and slightly less meaningful than LLM evaluations, placing LENS close to LLM Evals in the right top corner of Figure 2. Nevertheless, further assessment would be required to verify these claims. This would conclude the evaluations methods in scope and the next section is focusing on methods of their application.

    4. Toward increased truthfulness

    Having established in section 1, the relevance of truthfulness in RAG applications, with SRQ1 the causes of untruthful output and with SRQ2 its evaluation, this section will focus on SRQ3. Hence, detailing specific recommended methods improving groundedness and completeness to increase truthful responses. These methods can be categorised into two groups, improvements in the generation of output and validation of output.

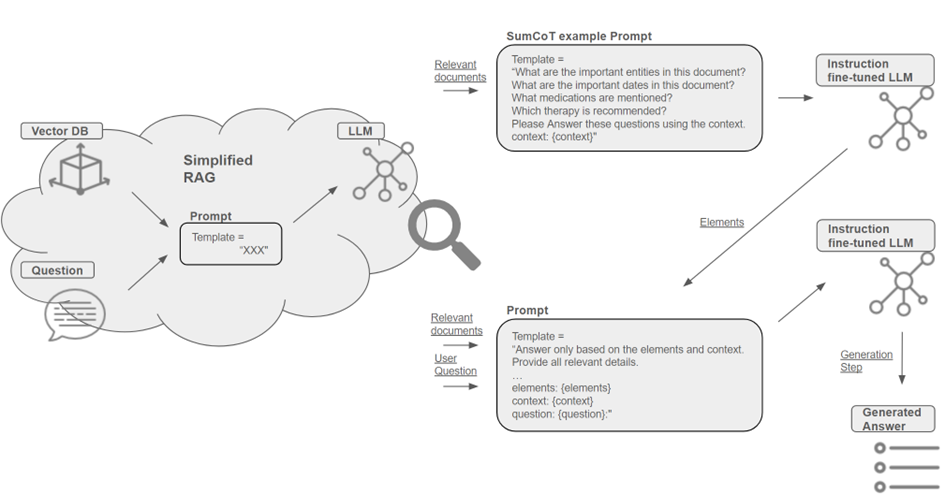
    In order to improve the generation step of the RAG application, this article will highlight two methods. These are visualised in Figure 3, with the simplified RAG architecture referenced on the left. The first methods is fine-tuning the generation LLM. Instruction tuning over model size is critical to the LLM’s zero-shot summarisation capability. Thus, state-of-the-art LLMs can perform on par with summaries written by freelance writers (T. Zhang et al., 2023). The second method focuses on element-aware summarisation. With CoT prompting, like presented in SumCoT, LLMs can generate summaries step by step, emphasising the factual entities of the source text (Wang et al., 2023). Specifically, in an additional step, factual elements are extracted from the relevant documents and made available to the LLM in addition to the context for the summarisation, see Figure 3. Both methods have shown promising results for improving the groundedness and completeness of LLM-generated summaries.

    Figure 3 — Improved generation step

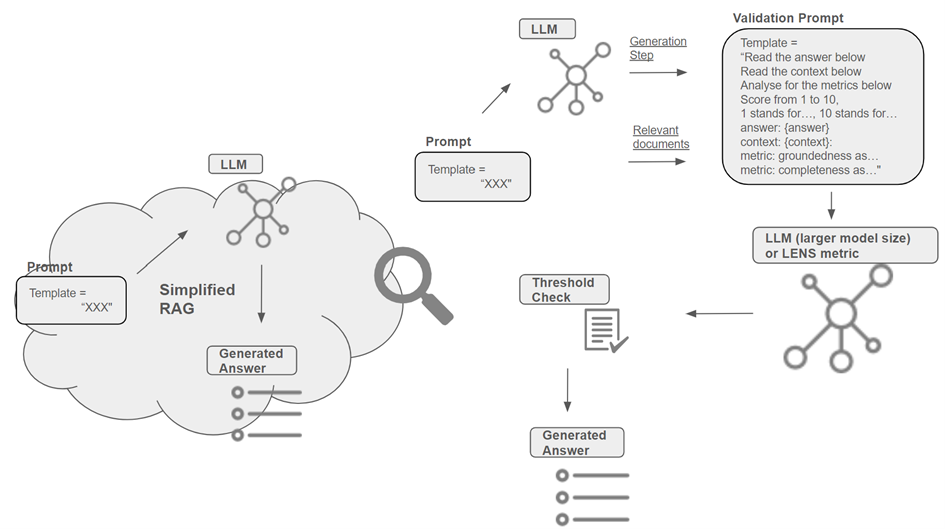
    In validation of the RAG outputs, LLM-generated summaries are evaluated for groundedness and completeness. This can be done by CoT prompting an LLM to aggregate a groundedness and completeness score. In Figure 4 an example CoT prompt is depicted, which can be forwarded to an LLM of larger model size for completion. Furthermore, this step can be replaced or advanced by using supervised metrics like LENS. At last, the generated evaluation is compared against a threshold. In case of not grounded or incomplete outputs, those can be modified, raised to the user or potentially rejected.

    Figure 4 — Output validation

    Before adapting these methods to RAG applications, it should be considered that evaluation at run-time and fine-tuning the generation model will lead to additional costs. Furthermore, the evaluation step will affect the applications’ answering speed. Lastly, no answer due to output rejections and raised truthfulness concerns might confuse application users. Consequently, it is critical to evaluate these methods with respect to the field of application, the functionality of the application and the user´s expectations. Leading to a customised approach increasing outputs truthfulness of RAG applications.

    Unless otherwise noted, all images are by the author.

    List of References

    Bang, Y., Cahyawijaya, S., Lee, N., Dai, W., Su, D., Wilie, B., Lovenia, H., Ji, Z., Yu, T., Chung, W., Do, Q. V., Xu, Y., & Fung, P. (2023). A Multitask, Multilingual, Multimodal Evaluation of ChatGPT on Reasoning, Hallucination, and Interactivity (arXiv:2302.04023). arXiv. https://doi.org/10.48550/arXiv.2302.04023

    Deutsch, D., & Roth, D. (2022). Benchmarking Answer Verification Methods for Question Answering-Based Summarization Evaluation Metrics (arXiv:2204.10206). arXiv. https://doi.org/10.48550/arXiv.2204.10206

    Fabbri, A. R., Kryściński, W., McCann, B., Xiong, C., Socher, R., & Radev, D. (2021). SummEval: Re-evaluating Summarization Evaluation (arXiv:2007.12626). arXiv. https://doi.org/10.48550/arXiv.2007.12626

    Feedback Functions — TruLens. (o. J.). Abgerufen 11. Februar 2024, von https://www.trulens.org/trulens_eval/core_concepts_feedback_functions/#feedback-functions

    Ji, Z., Lee, N., Frieske, R., Yu, T., Su, D., Xu, Y., Ishii, E., Bang, Y., Dai, W., Madotto, A., & Fung, P. (2023). Survey of Hallucination in Natural Language Generation. ACM Computing Surveys, 55(12), 1–38. https://doi.org/10.1145/3571730

    Kew, T., Chi, A., Vásquez-Rodríguez, L., Agrawal, S., Aumiller, D., Alva-Manchego, F., & Shardlow, M. (2023). BLESS: Benchmarking Large Language Models on Sentence Simplification (arXiv:2310.15773). arXiv. https://doi.org/10.48550/arXiv.2310.15773

    Kim, J., Park, S., Jeong, K., Lee, S., Han, S. H., Lee, J., & Kang, P. (2023). Which is better? Exploring Prompting Strategy For LLM-based Metrics (arXiv:2311.03754). arXiv. https://doi.org/10.48550/arXiv.2311.03754

    Levonian, Z., Li, C., Zhu, W., Gade, A., Henkel, O., Postle, M.-E., & Xing, W. (2023). Retrieval-augmented Generation to Improve Math Question-Answering: Trade-offs Between Groundedness and Human Preference (arXiv:2310.03184). arXiv. https://doi.org/10.48550/arXiv.2310.03184

    Lewis, P., Perez, E., Piktus, A., Petroni, F., Karpukhin, V., Goyal, N., Küttler, H., Lewis, M., Yih, W., Rocktäschel, T., Riedel, S., & Kiela, D. (2021). Retrieval-Augmented Generation for Knowledge-Intensive NLP Tasks (arXiv:2005.11401). arXiv. https://doi.org/10.48550/arXiv.2005.11401

    Lin, C.-Y. (2004). ROUGE: A Package for Automatic Evaluation of Summaries. Text Summarization Branches Out, 74–81. https://aclanthology.org/W04-1013

    Liu, Y., Iter, D., Xu, Y., Wang, S., Xu, R., & Zhu, C. (2023). G-Eval: NLG Evaluation using GPT-4 with Better Human Alignment (arXiv:2303.16634). arXiv. https://doi.org/10.48550/arXiv.2303.16634

    Maddela, M., Dou, Y., Heineman, D., & Xu, W. (2023). LENS: A Learnable Evaluation Metric for Text Simplification (arXiv:2212.09739). arXiv. https://doi.org/10.48550/arXiv.2212.09739

    Papineni, K., Roukos, S., Ward, T., & Zhu, W.-J. (2002). Bleu: A Method for Automatic Evaluation of Machine Translation. In P. Isabelle, E. Charniak, & D. Lin (Hrsg.), Proceedings of the 40th Annual Meeting of the Association for Computational Linguistics (S. 311–318). Association for Computational Linguistics. https://doi.org/10.3115/1073083.1073135

    Wang, Y., Zhang, Z., & Wang, R. (2023). Element-aware Summarization with Large Language Models: Expert-aligned Evaluation and Chain-of-Thought Method (arXiv:2305.13412). arXiv. https://doi.org/10.48550/arXiv.2305.13412

    Wu, N., Gong, M., Shou, L., Liang, S., & Jiang, D. (2023). Large Language Models are Diverse Role-Players for Summarization Evaluation (arXiv:2303.15078). arXiv. https://doi.org/10.48550/arXiv.2303.15078

    Zhang, T., Ladhak, F., Durmus, E., Liang, P., McKeown, K., & Hashimoto, T. B. (2023). Benchmarking Large Language Models for News Summarization (arXiv:2301.13848). arXiv. https://doi.org/10.48550/arXiv.2301.13848

    Zhang, X., & Gao, W. (2023). Towards LLM-based Fact Verification on News Claims with a Hierarchical Step-by-Step Prompting Method (arXiv:2310.00305). arXiv. https://doi.org/10.48550/arXiv.2310.00305


    Towards increased truthfulness in LLM applications was originally published in Towards Data Science on Medium, where people are continuing the conversation by highlighting and responding to this story.

    Originally appeared here:
    Towards increased truthfulness in LLM applications

    Go Here to Read this Fast! Towards increased truthfulness in LLM applications

  • Human Pose Tracking with MediaPipe in 2D and 3D: Rerun Showcase

    Andreas Naoum

    How to easily visualise MediaPipe’s human pose tracking with Rerun

    Human Pose Tracking | Image by Author

    Overview

    We explore a use case that leverages the power of MediaPipe for tracking human poses in both 2D and 3D. What makes this exploration even more fascinating is the visualisation aspect powered by the open-source visualisation tool Rerun, which provides a holistic view of human poses in action.

    In this blog post, you’ll be guided to use MediaPipe to track human poses in 2D and 3D, and explore the visualisation capabilities of Rerun.

    Human Pose Tracking

    Human pose tracking is a task in computer vision that focuses on identifying key body locations, analysing posture, and categorising movements. At the heart of this technology is a pre-trained machine-learning model to assess the visual input and recognise landmarks on the body in both image coordinates and 3D world coordinates. The use cases and applications of this technology include but are not limited to Human-Computer Interaction, Sports Analysis, Gaming, Virtual Reality, Augmented Reality, Health, etc.

    It would be good to have a perfect model, but unfortunately, the current models are still imperfect. Although datasets could have a variety of body types, the human body differs among individuals. The uniqueness of each individual’s body poses a challenge, particularly for those with non-standard arm and leg dimensions, which may result in lower accuracy when using this technology. When considering the integration of this technology into systems, it is crucial to acknowledge the possibility of inaccuracies. Hopefully, ongoing efforts within the scientific community will pave the way for the development of more robust models.

    Beyond lack of accuracy, ethical and legal considerations emerge from utilising this technology. For instance, capturing human body poses in public spaces could potentially invade privacy rights if individuals have not given their consent. It’s crucial to take into account any ethical and legal concerns before implementing this technology in real-world scenarios.

    Prerequisites & Setup

    Begin by installing the required libraries:

    # Install the required Python packages 
    pip install mediapipe
    pip install numpy
    pip install opencv-python<4.6
    pip install requests>=2.31,<3
    pip install rerun-sdk

    # or just use the requirements file
    pip install -r examples/python/human_pose_tracking/requirements.txt

    Track Human Pose using MediaPipe

    Image via Pose Landmark Detection Guide by Google [1]

    MediaPipe Python is a handy tool for developers looking to integrate on-device ML solutions for computer vision and machine learning.

    In the code below, MediaPipe pose landmark detection was utilised for detecting landmarks of human bodies in an image. This model can detect body pose landmarks as both image coordinates and 3D world coordinates. Once you have successfully run the ML model, you can use the image coordinates and the 3D world coordinates to visualise the output.

    import mediapipe as mp
    import numpy as np
    from typing import Any
    import numpy.typing as npt
    import cv2


    """
    Read 2D landmark positions from Mediapipe Pose results.

    Args:
    results (Any): Mediapipe Pose results.
    image_width (int): Width of the input image.
    image_height (int): Height of the input image.

    Returns:
    np.array | None: Array of 2D landmark positions or None if no landmarks are detected.
    """
    def read_landmark_positions_2d(
    results: Any,
    image_width: int,
    image_height: int,
    ) -> npt.NDArray[np.float32] | None:
    if results.pose_landmarks is None:
    return None
    else:
    # Extract normalized landmark positions and scale them to image dimensions
    normalized_landmarks = [results.pose_landmarks.landmark[lm] for lm in mp.solutions.pose.PoseLandmark]
    return np.array([(image_width * lm.x, image_height * lm.y) for lm in normalized_landmarks])


    """
    Read 3D landmark positions from Mediapipe Pose results.

    Args:
    results (Any): Mediapipe Pose results.

    Returns:
    np.array | None: Array of 3D landmark positions or None if no landmarks are detected.
    """
    def read_landmark_positions_3d(
    results: Any,
    ) -> npt.NDArray[np.float32] | None:
    if results.pose_landmarks is None:
    return None
    else:
    # Extract 3D landmark positions
    landmarks = [results.pose_world_landmarks.landmark[lm] for lm in mp.solutions.pose.PoseLandmark]
    return np.array([(lm.x, lm.y, lm.z) for lm in landmarks])


    """
    Track and analyze pose from an input image.

    Args:
    image_path (str): Path to the input image.
    """
    def track_pose(image_path: str) -> None:
    # Read the image, convert color to RGB
    image = cv2.imread(image_path)
    image = cv2.cvtColor(image, cv2.COLOR_BGR2RGB)

    # Create a Pose model instance
    pose_detector = mp.solutions.pose.Pose(static_image_mode=True)

    # Process the image to obtain pose landmarks
    results = pose_detector.process(image)
    h, w, _ = image.shape

    # Read 2D and 3D landmark positions
    landmark_positions_2d = read_landmark_positions_2d(results, w, h)
    landmark_positions_3d = read_landmark_positions_3d(results)

    Visualise the output of MediaPipe using Rerun

    Rerun Viewer | Image via Rerun Docs [2]

    Rerun serves as a visualisation tool for multi-modal data. Through the Rerun Viewer, you can build layouts, customise visualisations and interact with your data. The rest part of this section details how you can log and present data using the Rerun SDK to visualise it within the Rerun Viewer

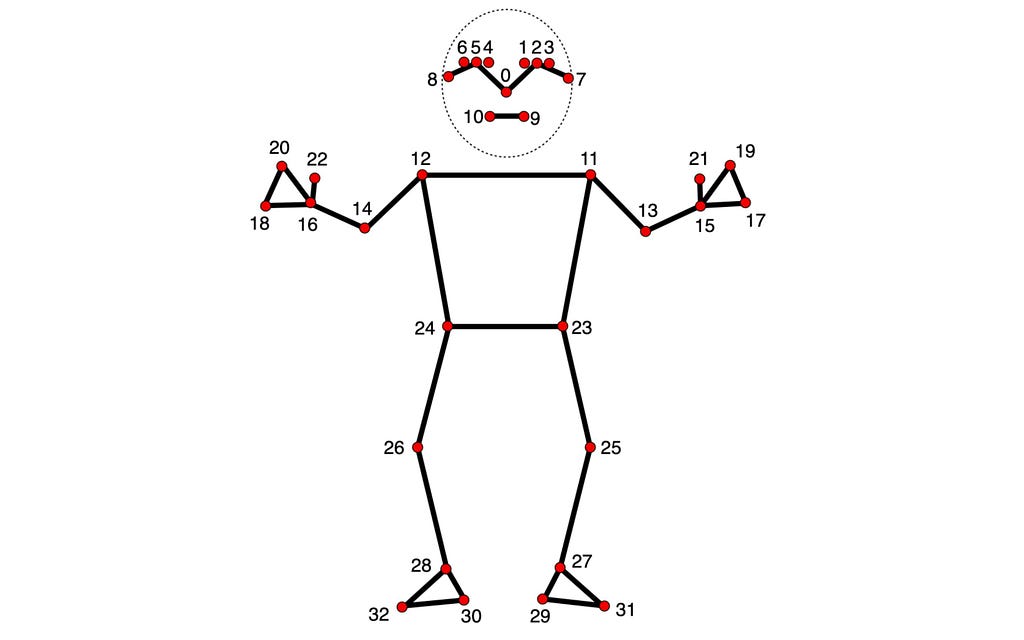
    Pose Landmarker Model | Image via Pose Landmark Detection Guide by Google [1]

    In both 2D and 3D points, specifying connections between points is essential. Defining these connections automatically renders lines between them. Using the information provided by MediaPipe, you can get the pose points connections from the POSE_CONNECTIONS set and then set them as keypoint connections using Annotation Context.

    rr.log(
    "/",
    rr.AnnotationContext(
    rr.ClassDescription(
    info=rr.AnnotationInfo(id=0, label="Person"),
    keypoint_annotations=[rr.AnnotationInfo(id=lm.value, label=lm.name) for lm in mp_pose.PoseLandmark],
    keypoint_connections=mp_pose.POSE_CONNECTIONS,
    )
    ),
    timeless=True,
    )

    Image Coordinates — 2D Positions

    Visualising Human Pose as 2D Points | Image by Author

    Visualising the body pose landmarks on the video appears to be a good choice. To achieve that, you need to follow the rerun documentation for Entities and Components. The Entity Path Hierarchy page describes how to log multiple Components on the same Entity. For example, you can create the ‘video’ entity and include the components ‘video/rgb’ for the video and ‘video/pose’ for the body pose. If you’re aiming to use that for a video, you need the concept of Timelines. Each frame can be associated with the appropriate data.

    Here is a function that can visualise the 2D points on the video:

    def track_pose_2d(video_path: str) -> None:
    mp_pose = mp.solutions.pose

    with closing(VideoSource(video_path)) as video_source, mp_pose.Pose() as pose:
    for idx, bgr_frame in enumerate(video_source.stream_bgr()):
    if max_frame_count is not None and idx >= max_frame_count:
    break

    rgb = cv2.cvtColor(bgr_frame.data, cv2.COLOR_BGR2RGB)

    # Associate frame with the data
    rr.set_time_seconds("time", bgr_frame.time)
    rr.set_time_sequence("frame_idx", bgr_frame.idx)

    # Present the video
    rr.log("video/rgb", rr.Image(rgb).compress(jpeg_quality=75))

    # Get the prediction results
    results = pose.process(rgb)
    h, w, _ = rgb.shape

    # Log 2d points to 'video' entity
    landmark_positions_2d = read_landmark_positions_2d(results, w, h)
    if landmark_positions_2d is not None:
    rr.log(
    "video/pose/points",
    rr.Points2D(landmark_positions_2d, class_ids=0, keypoint_ids=mp_pose.PoseLandmark),
    )

    3D World Coordinates — 3D Points

    Visualising Human Pose as 3D Points | Image by Author

    Why settle on 2D points when you have 3D Points? Create a new entity, name it “Person”, and log the 3D points. It’s done! You just created a 3D presentation of the human body pose.

    Here is how to do it:

    def track_pose_3d(video_path: str, *, segment: bool, max_frame_count: int | None) -> None:
    mp_pose = mp.solutions.pose

    rr.log("person", rr.ViewCoordinates.RIGHT_HAND_Y_DOWN, timeless=True)

    with closing(VideoSource(video_path)) as video_source, mp_pose.Pose() as pose:
    for idx, bgr_frame in enumerate(video_source.stream_bgr()):
    if max_frame_count is not None and idx >= max_frame_count:
    break

    rgb = cv2.cvtColor(bgr_frame.data, cv2.COLOR_BGR2RGB)

    # Associate frame with the data
    rr.set_time_seconds("time", bgr_frame.time)
    rr.set_time_sequence("frame_idx", bgr_frame.idx)

    # Present the video
    rr.log("video/rgb", rr.Image(rgb).compress(jpeg_quality=75))

    # Get the prediction results
    results = pose.process(rgb)
    h, w, _ = rgb.shape

    # New entity "Person" for the 3D presentation
    landmark_positions_3d = read_landmark_positions_3d(results)
    if landmark_positions_3d is not None:
    rr.log(
    "person/pose/points",
    rr.Points3D(landmark_positions_3d, class_ids=0, keypoint_ids=mp_pose.PoseLandmark),
    )

    Source Code Exploration

    The tutorial focuses on the main parts of the Human Pose Tracking example. For those who prefer a hands-on approach, the full source code for this example is available on GitHub. Feel free to explore, modify, and understand the inner workings of the implementation.

    Tips & Suggestions

    1. Compress the image for efficiency

    You can boost the overall procedure speed by compressing the logged images:

    rr.log(
    "video",
    rr.Image(img).compress(jpeg_quality=75)
    )

    2. Limit Memory Use

    If you’re logging more data than can be fitted into your RAM, it will start dropping the old data. The default limit is 75% of your system RAM. If you want to increase that you could use the command line argument — memory-limit. More information about memory limits can be found on Rerun’s How To Limit Memory Use page.

    3. Customise Visualisations for your needs

    Customise Rerun Viewer | Image by Author

    Beyond Human Pose Tracking

    If you found this article useful and insightful, there’s more!

    Similar articles:

    Real-Time Hand Tracking and Gesture Recognition with MediaPipe: Rerun Showcase

    I regularly share tutorials on visualisation for computer vision and robotics. Follow me for future updates!

    Also, you can find me on LinkedIn.

    Sources

    [1] Pose Landmark Detection Guide by Google, Portions of this page are reproduced from work created and shared by Google and used according to terms described in the Creative Commons 4.0 Attribution License.

    [2] Rerun Docs by Rerun under MIT license


    Human Pose Tracking with MediaPipe in 2D and 3D: Rerun Showcase was originally published in Towards Data Science on Medium, where people are continuing the conversation by highlighting and responding to this story.

    Originally appeared here:
    Human Pose Tracking with MediaPipe in 2D and 3D: Rerun Showcase

    Go Here to Read this Fast! Human Pose Tracking with MediaPipe in 2D and 3D: Rerun Showcase