

Originally appeared here:
Pandas: My Experience Contributing to a Major Open Source Project
Go Here to Read this Fast! Pandas: My Experience Contributing to a Major Open Source Project
Organizations generate voluminous amounts of data on a daily basis. Dashboards are built to analyze this data and derive meaningful business insights as well as to track KPIs. Over time, we find ourselves with hundreds (or maybe more) of such dashboards. Oftentimes, this phenomenon of Dashboard Proliferation is driven by multiple groups developing their own analyses in silos without visibility into analytics that may already be available. For example, sales teams may create a dashboard to track their forecasts vs. actual sales not knowing that a forecast accuracy dashboard is currently available with the supply chain team. Not only does this result in duplication of efforts but we may end up with common metrics and analyses across multiple dashboards with no single source of truth due to differing data sources and assumptions.
As teams come together to provide updates on the state of the business to senior management, they usually spend several person-hours reconciling differing metrics to provide a clear and coherent message to leadership. Let’s say we have a 1000-person organization, where it takes an average of 2 hours per week spent by each person to reconcile data from different reports. This amounts to 100,000 person-hours annually assuming 50 weeks/yr. If we assume an average employee compensation at $50/hour, the yearly cost of this reconciliation runs up to $5MM. While the numbers above are hypothetical, they aren’t un-representative of operations and planning teams in large Fortune 100 companies. In this post, we will go over an approach to consolidate dashboards and reports to save time and effort in reconciling KPIs.

Even metrics that ostensibly have the same definition may not match when reported by different teams in different reports. To bridge these differences, we may consider one of the following approaches to reconcile metrics and analyses across dashboards and reports:
(i) Tracking — this approach would entail keeping the dashboards as they are but creating a new directory to keep track of all dashboards. This directory will list metrics found in each dashboard along with their definitions, estimation assumptions, and input data sources.
(ii) Elimination — as the name suggests, we identify rarely used dashboards and work with their developers and users that have used the dashboards over the past 12 months. We may want to deprecate dashboards/reports after transferring relevant KPIs to other dashboards as needed.
(iii) Consolidation — here we would create a reduced number of dashboards by combining similar metrics into a single dashboard.
While we recommend elimination of sparsely utilized dashboards to the extent possible, we may still be left with many dashboards overlapping in metrics and purpose after this removal. This post will focus on an approach to merge together dashboards with similar content to yield a rationalized list. The proposed solution considers consolidation as a two-part problem. First, we identify which dashboards can be grouped together, following which we determine how to combine the dashboards within each cluster.

A simple mental model is to group together similar dashboards. This similarity can be measured across multiple dimensions as noted below:
(a) Metrics — arguably the most important criterion. This includes all the entities exposed to the users from a given dashboard. For example, forecast accuracy, forecasts, and historical actuals may be key metrics in a demand planning dashboard. As metrics are a function of the purpose of a dashboard, grouping dashboards with similar metrics aligns the purpose of reporting as well.
(b) User Personas — the different roles within an organization that may use a dashboard on a regular basis. This is more of a secondary consideration when combining dashboards.
(c) Filters — the granularity at which the metrics, analyses and insights are available can be another consideration. As we combine dashboards, we need to ensure that the legacy granularities that support business decision-making are not lost.
(d) Input Data Sources — this may be a minor factor in deciding which dashboards to combine. All else remaining equal, it may be worthwhile grouping dashboards that derive data from the same sources for ease of integration.
All the afore-mentioned factors may not be equally significant. As such, we may need to give unequal weightage to each factor with potentially the highest to metrics and lowest to input data sources.

This is a critical step of the overall endeavor as it determines the effort needed to integrate the dashboards within a cluster into a single entity. The more disparate the dashboards within a cluster, the more time and effort needed to combine them into a single unit. We’ll walk through a case study, where we want to consolidate seven dashboards (shown in Figure. 1) into 2–3 groups.

A series of steps is recommended for the clustering:
1) Understand the purpose of each dashboard by talking with current users and developers. This voice of customer is crucial to capture at an early stage to facilitate adoption of the consolidated dashboards. We may also unearth new information about the dashboards and be able to update our initial assumptions and definitions.
2) Assign weights to the different dimensions — for instance, we may want to assign a higher weightage to metrics over the other factors. In our example above, we give metrics a 2x weightage vs. the others.
3) Convert the information into a dataframe conducive for applying clustering techniques. Figure 2 shows the dataframe for our case study accounting for the appropriate weights across dimensions.

4) Apply a standard clustering approach after removing the names of the dashboards. Figure 3 shows the dendrogram output from hierarchical clustering with Euclidean distance and Average linkage. If we overlay the dashed green line, it produces 3 clusters with the dashboards in our example {A, F}, {G, B, C, D}, {E}.
5) Iterate on number of clusters to arrive at a set of balanced clusters that make business sense.

A caveat here is that a given metric may be a part of different dashboards across multiple clusters. We can either document this occurrence to inform users or we could remove the metric based on business judgment from K-1 dashboards, where K is the total number of clusters where the metric appears. However, this type of judgment-based elimination can be sub-optimal.
One other challenge with a traditional clustering approach is that it may not group dashboards that are subsets of other dashboards in the same cluster. For example, Dashboard A is a subset of Dashboard E as can be seen in Figure 1 (i.e. metrics, user personas, filers and data sources in Dashboard A are also present in Dashboard E) but they are grouped in different clusters (Figure 3). The idea behind capturing subsets is to eliminate them since an alternate (superset) dashboard is available that also exposes the same metrics along with others to users. To mitigate this issue, we propose an alternate clustering algorithm to help group together subsets.

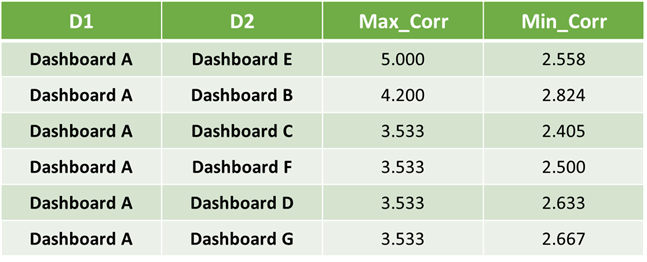
In this approach, we treat each dashboard as a list where each of the metrics, filters, user personas, and input data sources are categorical elements of the list. The idea is to create correlation indicators between the dashboards accounting for common elements and cluster together dashboards (or groups of dashboards), where the correlation exceeds a user-defined threshold. The steps in the algorithm are as follows:
We apply Steps 2–10 to our earlier example to estimate the correlations (Figure 4) between Dashboard A and all other dashboards to test if the approach works as intended. We see that the highest value of Max_Corr is between Dashboard A and Dashboard E along expected lines as Dashboard A is a subset of Dashboard E across all dimensions.
This new algorithm will yield a set of clusters with similar dashboards across the dimensions outlined in the earlier sections. The choice of threshold determines the number of clusters and count of dashboards within each. We may want to test multiple thresholds iteratively until we find the clusters to be closely aligned to business expectations. In general, this approach works well for clustering entities in any categorical dataframe.

Once we have a set of acceptable clusters, we need to combine each collection into a single dashboard. We typically rely on guidance from software engineering teams on the merging of dashboards. One option may be to create a new dashboard to capture all metrics and filters within a cluster. If starting from scratch is not the recommended solution, we need to pick one dashboard from each cluster and add information to it from other dashboards in the cluster. To minimize re-work, we would want to sort the dashboards in order of increasing complexity and use the most complex one as the base. We would add data from the other dashboards to this base starting with the next most complex dashboard, while avoiding duplication of information as we go through the dashboards in the cluster. Ordering is important to avoid inefficiencies in the process of combining dashboards. Complexity is best defined by the software development engineers — this can be lines of code, number of functions, or any other criteria. If complexity is around the same across all dashboards, then we may want to consider the following hierarchy to sort:
Number of metrics >> Number of filters/views >> Number of input data sources >> Number of users
For instance, if the complexity is around the same across dashboards, we would use the dashboard with most metrics as our base and add metrics from other dashboards to it.

Unstructured growth of data is a common challenge that is not limited to a single industry, organization or business line. Teams spend countless hours trying to reconcile data from different sources. Even seemingly similar metrics may have been built for different purposes with different assumptions. These situations are not uncommon because dashboard and report creation are typically decentralized where any employee can use an organization’s data to build their own views. Combining dashboards with similar metrics can help alleviate the time and effort spent in data reconciliation by 1) reducing the number of entities to consider while bridging, and 2) driving towards a single source of truth for many metrics.
Traditional clustering algorithms can help decide which dashboards should go together, but we may need to consider custom approaches as described in this post to group together subsets of dashboards. Eventually, the solution to this issue of data reconciliation is to develop a mechanism to create reports in a centralized fashion. If that isn’t organizationally feasible, an advanced solution to this problem of manual reconciliation would be to use a Generative AI framework to sift through multiple reports and dashboards within an organization’s repository and provide the bridges between metrics highlighting key drivers behind the differences.
Thanks for reading. Hope you found it useful. Feel free to send me your comments at [email protected]. Let’s connect on LinkedIn
Information Rationalization in Large Organizations was originally published in Towards Data Science on Medium, where people are continuing the conversation by highlighting and responding to this story.
Originally appeared here:
Information Rationalization in Large Organizations
Go Here to Read this Fast! Information Rationalization in Large Organizations
Calculating the consumption based on meter data looks easy. However, complex situations can be challenging. Let’s see how we can solve…
Originally appeared here:
Calculating the previous value in Power BI
Go Here to Read this Fast! Calculating the previous value in Power BI


Since the introduction of mass production in 1913 assembly lines are still mostly human — humanoids might change this
Originally appeared here:
The Future of Robotic Assembly

Originally appeared here:
Use Kubernetes Operators for new inference capabilities in Amazon SageMaker that reduce LLM deployment costs by 50% on average
Assigning code owners, hiring analytics engineers, and creating flywheels
Originally appeared here:
3 Best Practices for Bridging the Gap Between Engineers and Analysts
Go Here to Read this Fast! 3 Best Practices for Bridging the Gap Between Engineers and Analysts
Subscriptions that boost my productivity, knowledge, and focus as a practicing data scientist
Originally appeared here:
7 Subscriptions That Help Me As A Data Scientist
Go Here to Read this Fast! 7 Subscriptions That Help Me As A Data Scientist

This article presents a novel approach to accelerating Large Language Models (LLMs) inference by merging tokens using Spherical Linear Interpolation (SLERP). By reducing the sequence length while maintaining quality, this technique offers significant speed-ups in LLM inference, addressing the computational challenges posed by longer sequences. The method is still raw but highlights a dual world for LLM with one set up for training and one for predicting.
LLMs have revolutionized natural language processing tasks by exhibiting remarkable generative abilities. However, their effectiveness comes at a cost — computational resources. As LLMs process longer sequences, the quadratic scaling of transformer computations becomes increasingly prohibitive. Traditional methods to mitigate this, such as caching and quantization, have limitations. Therefore, there is a need for innovative approaches to speed up LLM inference without compromising too much quality.
The current method to generate a token during inference is a brute force approach, essentially a transposition of the training methodology. While this methodology has proven effective for training, it may not be the most efficient for inference tasks. Thus, there is an opportunity to develop a new inference methodology dedicated specifically to generating tokens during inference, which could optimize the process and further enhance the efficiency of LLMs. This highlights the importance of exploring alternative techniques to address the computational challenges faced by LLM inference.
Recently, the mergekit library proposed to merge networks’ weights using the SLERP methods which tends to yield better results. Inspired by this work, I decided to see if could merge the tokens inside a sequence to produce a smaller sequence to process while predicting the next token.
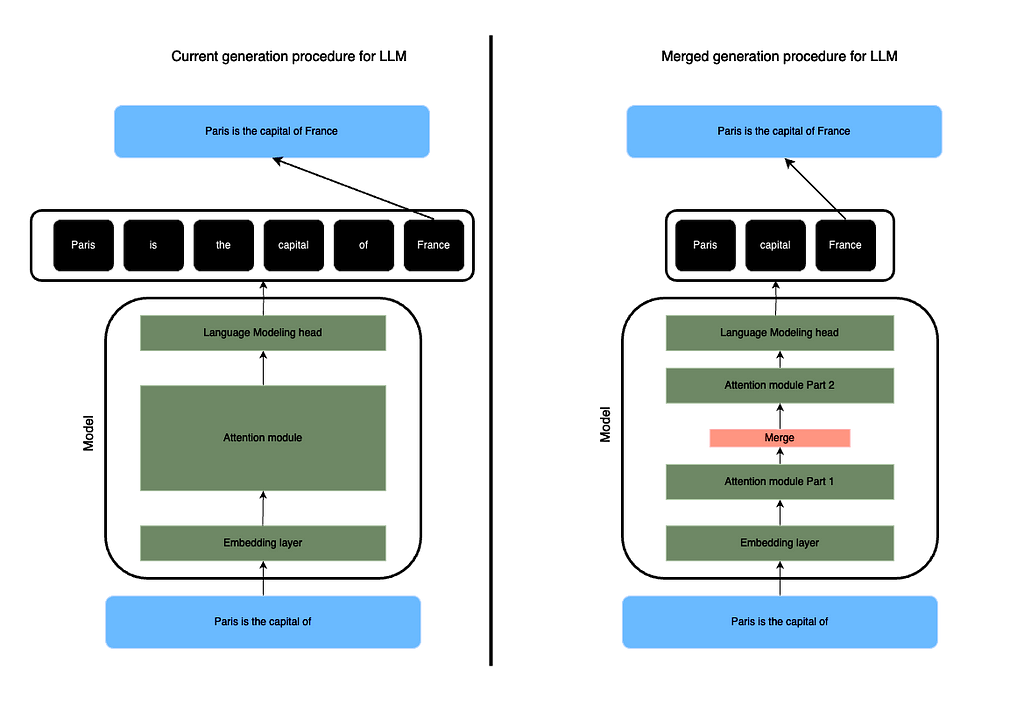
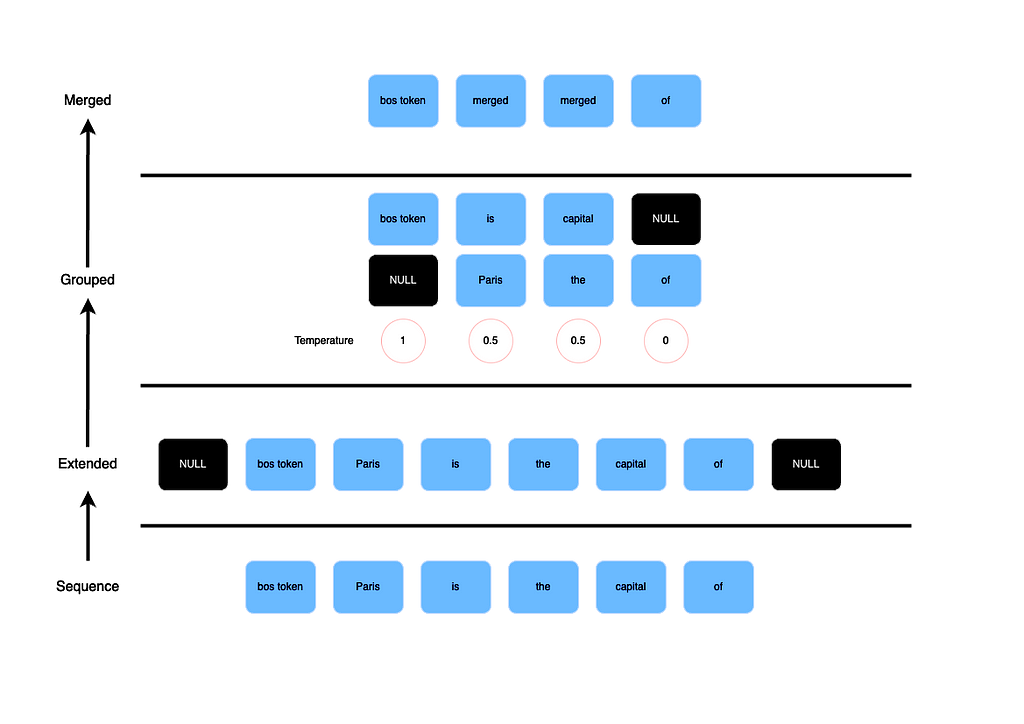
The proposed method involves modifying the forward pass of LLMs to merge tokens using Spherical Linear Interpolation (SLERP), a technique borrowed from computer graphics and animation. Unlike simple averaging techniques, SLERP preserves the spherical aspects of token dimensions, offering a more nuanced interpolation. The merging procedure entails several steps to efficiently condense the input sequence:
Sequence Length Adjustment:
Initially, the input sequence undergoes adjustments based on its length:
By doing so, we ensure that the first and last token in the context are preserved.
Pair Formation:
The adjusted sequence is then formatted into pairs of consecutive tokens. This process prepares the data for aggregation.
Aggregation with SLERP:
Each pair of tokens undergoes aggregation using SLERP, effectively reducing the sequence length by half (not exactly as we add and preserve some extra tokens). SLERP interpolates between the two vectors representing consecutive tokens. This creates a new vector.
To do so efficiently, I recreated all the SLERP functions in native pytorch. However, the code might be under optimized.
Layer Cutoff and Prompt Preservation:
The merging process can occur at different levels of the model architecture, referred to as “layer cutoff.” Additionally, to preserve the integrity of prompts, a portion of the sequence at the beginning and/or end can be designated to remain unchanged. This is particularly useful for Instruct-based Models where the starting part of the prompt should always be remembered.
This innovative approach offers a nuanced solution to the computational challenges associated with LLM inference, promising significant speed-ups without sacrificing quality or accuracy.
What it means ?
Concretely, in a LLM, the forward call takes as input a sequence of token of shape (batch_size, sequence length). The embedding layer creates a sequence of shape (batch size, sequence length, dimension). Each attention module takes this sequence as input. At a given attention layer, you can merge the tokens creating a sequence of shape (batch size, k, dimension) where k is the compressed sequence length. The choice of the layer where to apply this is the “layer cutoff”.
The next attention modules will no longer need to compute a (sequence length, sequence length) attention matrix but a smaller one as k is strictly inferior to the original sequence length.
Hence, the merging could occur at different level of the model architecture. This parameter is referred as “layer cutoff”. Also, to ensure that a prompt is not completely merged, you can define a part of the sequence at the beginning and/or at the end to be kept unchanged. It is more efficient for Instruct-based Models where the starting part of the prompt should be always reminded.
One downside of this methodology is that it strongly relies on the underlying forward pass of the used model, requiring you to carefully rewrite the “merged” process depending on the chosen model. Another downside is the necessity of recomputing attention masks and possibly positional embeddings at each step.
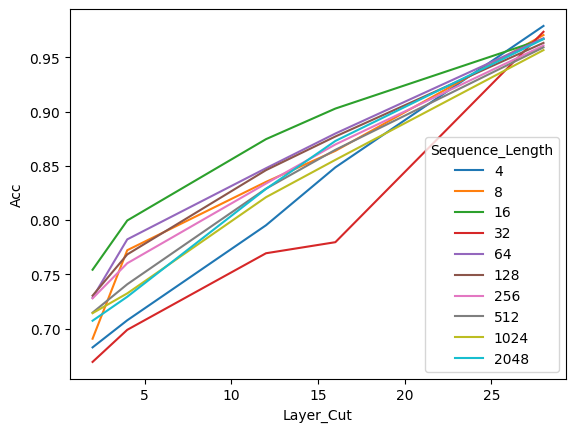
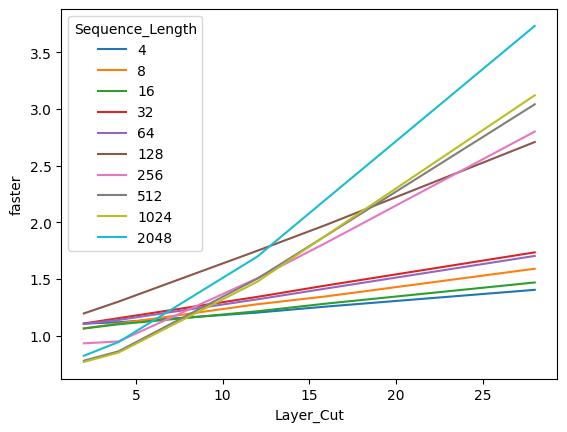
Experiments conducted on a Mistral 7B Instruct V0.2 model demonstrate promising outcomes. By comparing predictions between the base model and various merged models at different layer cutoffs, it was observed that merging tokens did not significantly impact prediction quality. Moreover, the merged models exhibited notable speed-ups in inference time, particularly at shallower layers. The technique also showcased its effectiveness in handling longer sequences, making it applicable across a wide range of use cases.
One downside is that I did not succeed at making the forward call the most optimized. Hence, there are probably many optimizations to find by rethinking the process.
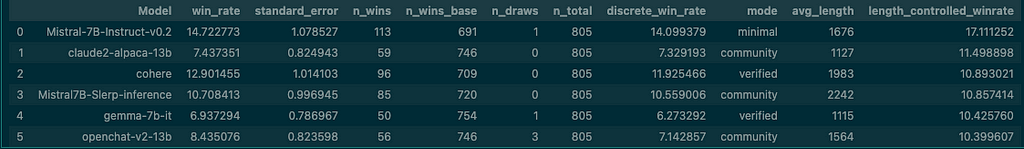
I also tested a merged version of Mistral Instruct v0.2 on the AlpacaEval dataset. I apply the merging at the 20th attention module. The results are really encouraging as the models outperforms Falcon 7B, Gemma 7B and nous-hermes-13b. It shows that merging without rethinking the positional encodings returns a model that speaks more with an increase of 600 tokens generated on average. I tried to reimplement the positional encoding procedure but failed.
In summary, merging tokens with SLERP is a strong candidate solution to the computational challenges associated with LLM inference. By striking a balance between speed and quality, this approach is just about rewriting the forward loop.
I prepared a repo with a simple notebook to play with it here : https://github.com/samchaineau/llm_slerp_generation
Using a new class where the foraward call is adapted, you can easily pass the LLM to a generation pipeline and use it on your dataset. So far my experiments are limited to a Mistral 7B model but I would like to extend it to other architectures to see whether the performances maintain.
All of the resources are in and you can reach out to me if you would like to test it on another LLM.
The merging tokens with SLERP technique should be explored for accelerating LLM inference. With further optimization and exploration, it holds the potential to improve the efficiency and scalability of natural language processing tasks.
If you work in the AI field and are willing to bring this to the next level : reach out to me !
Github link : https://github.com/samchaineau/llm_slerp_generation
HuggingFace profile : https://huggingface.co/samchain
– Token Merging Stable Diffusion (paper) : https://arxiv.org/abs/2303.17604
– Token Merging Stable Diffusion (library) : https://huggingface.co/docs/diffusers/optimization/tome
– Token Merging NLP (paper) : https://llm-random.github.io/posts/mixture_of_tokens/
Unless otherwise noted, all images are by the author.
Merging tokens to accelerate LLM inference with SLERP was originally published in Towards Data Science on Medium, where people are continuing the conversation by highlighting and responding to this story.
Originally appeared here:
Merging tokens to accelerate LLM inference with SLERP
Go Here to Read this Fast! Merging tokens to accelerate LLM inference with SLERP


Originally appeared here:
Talk to your slide deck using multimodal foundation models hosted on Amazon Bedrock and Amazon SageMaker – Part 2


Originally appeared here:
Scale AI training and inference for drug discovery through Amazon EKS and Karpenter