An introduction to some of the key components surrounding LLMs to produce production-grade applications
Originally appeared here:
LLMs Pitfalls

An introduction to some of the key components surrounding LLMs to produce production-grade applications
Originally appeared here:
LLMs Pitfalls

We’ve all been there: you’ve attended (many!) meetings with sales reps from all of the SaaS data integration tooling companies and are granted 14 day access to try their wares. Now you have to decide what sorts of things to test in order to figure out definitively if the tool is the right commitment for you and the team.
I wanted to throw together some notes on key evaluation questions, as well as a few ways to check functionality, as I’m confident that this is a process that I will encounter again and again, and I like to have a template for these types of things.
These are primarily collected with cloud based integration platforms such as, but not limited to Fivetran, Airbyte, and Rivery in mind, but could apply to other cases as well!
If you have a favorite way to test out new data tools, add them to the comments!
You can find a million articles on evaluation criteria for data integration tooling (I really like this one!), but ultimately it comes down to your data platform and the problems within it that you are trying to solve.
Gather the team together and determine what these things are. There are, of course obvious features like required source and destination connectors that can be deal breakers, but maybe you’re also looking for a metadata solution that provides lineage, or trying to increase monitoring, or needing to scale something that was built in house and is no longer holding its own.
When you lay all of that out it also makes it easier to divide up the work of making these evaluations across team members to run in parallel.
Pick something pretty simple and get it up and running on day one. This will help create an overall picture of logging, metadata, latency, CDC, and all the other things that come with a pipeline.
If you are lucky you might even run into a platform error over the course of the 14 days and see how that is handled from the tooling company’s side. If you are dealing with an open source option, it can also help you understand if you are equipped to manage such issues in house.
Key questions
Some tools come with built in DBT integrations, some allow for fully custom Python based transformations. Translating a few transforms, maybe even a somewhat complex one, end to end from your existing solution can give you a good idea of how heavy a lift it will be to move everything over, if it is possible at all.
Key Questions
Try to process something from a non natively supported source or format (dummy up some fixed width files, or maybe pick an in house tool that exports data out in an unconventional way), or at least talk through how you could, with your technical sales representative. Even if, right now, that’s not an issue, if something does come up, it is worthwhile to at least understand what the options are for putting that functionality into place.
Key Questions
Somewhere along one of the test pipelines that you’ve built, throw in a badly formatted file, add bad code into a transform, change the schema, or wreak havoc in some other creative way to see what happens.
3rd party tools like these can be black boxes in some aspects, and nothing is more frustrating when a pipeline goes down, than incomprehensible error messages.
Key questions
Have a non-technical user ingest a Google sheet
Needing to integrate data from a manually uploaded spreadsheet is a somewhat more common use case than DE’s often like to think that it is. A tool should make this easy for the producing business team to do without the DE’s getting involved at all.
Read through the Reddit threads on the tool
I have found Reddit to be very useful when looking at tooling options. Folks are typically very reasonable in their assessment of positive and negative experiences with a tool, and open to answering questions. At the end of the day even a thorough trial phase will miss things, and this can be an easy way to see if you have some blind spots.
5 Things to do When Evaluating ELT/ETL Tools was originally published in Towards Data Science on Medium, where people are continuing the conversation by highlighting and responding to this story.
Originally appeared here:
5 Things to do When Evaluating ELT/ETL Tools
Go Here to Read this Fast! 5 Things to do When Evaluating ELT/ETL Tools


Working at Meta was fast-paced, challenging, and intellectually stimulating. For three transformative years, I worked as a Product Data Scientist in Integrity and account security at the bustling London office. Now, as I look back, I find myself continually drawn to the invaluable lessons gleaned during my time there. Beyond the confines of the office, these insights have seamlessly integrated into both my professional and personal growth.
Meta champions meaningful contributions over mere activity. Twice a year, employees undergo rigorous assessments based on how much tangible impact they’ve made in the last 6 months. The focus isn’t solely on tasks completed or volumes achieved; rather, it’s about the consequential outcomes stemming from one’s actions.
It means that it doesn’t matter what you’ve done or how much you’ve done, it matters what happens because of what you’ve done.
As a Data Scientist (DS), it’s not about the hours logged or the volume of insights generated; what truly counts is the transformative impact of your discoveries.
Consider this: by uncovering a segment of users experiencing unusually short session times, you exposed a critical engineering bug affecting a specific device type. As a result, your findings catalyzed the Engineering team to rectify the issue and correctly measure session time, leading to a staggering increase of 20 million more minutes in session time measured per day. That’s the tangible ‘so what’ impact that defines your contribution.(Note that this is a completely made-up example)
In this “impact” culture, I found myself continually pondering the potential outcome of my projects, delving into the ‘why’ behind my actions. Yet, grappling with the clarity of this ‘why’ wasn’t always a straightforward journey; uncertainty often clouded the path. But one thing was clear: you should determine your direction of travel and not mistake motion for progress.
Starting with “why” works remarkably for stakeholder management, too. Often, people begin by detailing their process, only circling back to their purpose later, if at all. By probing their “why”, you gain insight into their priorities and motivations, facilitating more meaningful and effective interactions
For example, when someone comes to you with a request, initiate by probing: “What problems are you trying to solve and when do you want it delivered?” This can go two ways. They might stumble a bit, struggling to articulate their goals. That’s ok. Ask questions to help them clarify, like “I understand that budget is a constraint, but what would you want the campaign to achieve in the first place?”. If they need time to comb things through, politely decline their requests and send them back to their thinking chair — many times they won’t come back because they would realize it’s not urgent or important.
But if they come back with something like, “We wanna figure out which UI boosts user traffic through A/B testing and launch the new UI by Thanksgiving”, then you smile, nod and dive into measuring that impact!

You can’t improve what you don’t measure.
— Peter Drucker
At Meta, numbers are the name of the game. If it’s not quantified, it might as well not exist. Product teams zero in on a key metric they’re aiming to boost or shrink — whether it’s revenue, active users, or incoming tickets. And the team’s triumph hinges on their ability to nudge that metric in the right direction. By rallying around one primary metric, everyone’s on the same page.
I’ve seen projects got canceled after a few months because the team could’t quantify goals that tie to the broader company goals.
In Part 1, we covered how starting with “why” can crack open insights into others’ work and requests. Here’s another golden question to follow up on: “How do you measure success?”
This question often links closely with the “why”. For example, if the aim is to determine which UI drive more user traffic, the measurement can be the number of users who land on the page.
Moreover, using numbers is a powerful way to navigate requests. As data people, we’re often tasked with “pulling some numbers” or “visualizing x in a dashboard.” I’ve found it helpful to challenge stakeholders to articulate the decisions they’d make based on those numbers. I’ll throw out scenarios like, “Imagine we have this number, say it’s 10%, 50%, or 80%. How would your decisions change accordingly?” It’s surprising how often stakeholders pause or dance around without a clear answer. 7 out of 10 times, they’ll say, “Let me think about it some more,” and then… crickets.
By doing that, you’ve effectively sifted out requests that fall into the “nice-to-have” category rather than the “must-have” ones.
While Meta’s impact culture attracts criticism around creating a high-pressure environment and focusing on short-term results, it’s been a goldmine for learning about prioritization. Every time I kick off a project or find myself knee-deep in it, I loop back to these tough questions:
Once you’ve dissected your projects like this, a handy step is to plot them on an effort vs. impact matrix and find that sweet spot for prioritization. Aim to minimize Money Pit ventures while maximizing Easy Wins and Incremental gains in the short term. Save room for those Big Bets that promise long-term payoffs
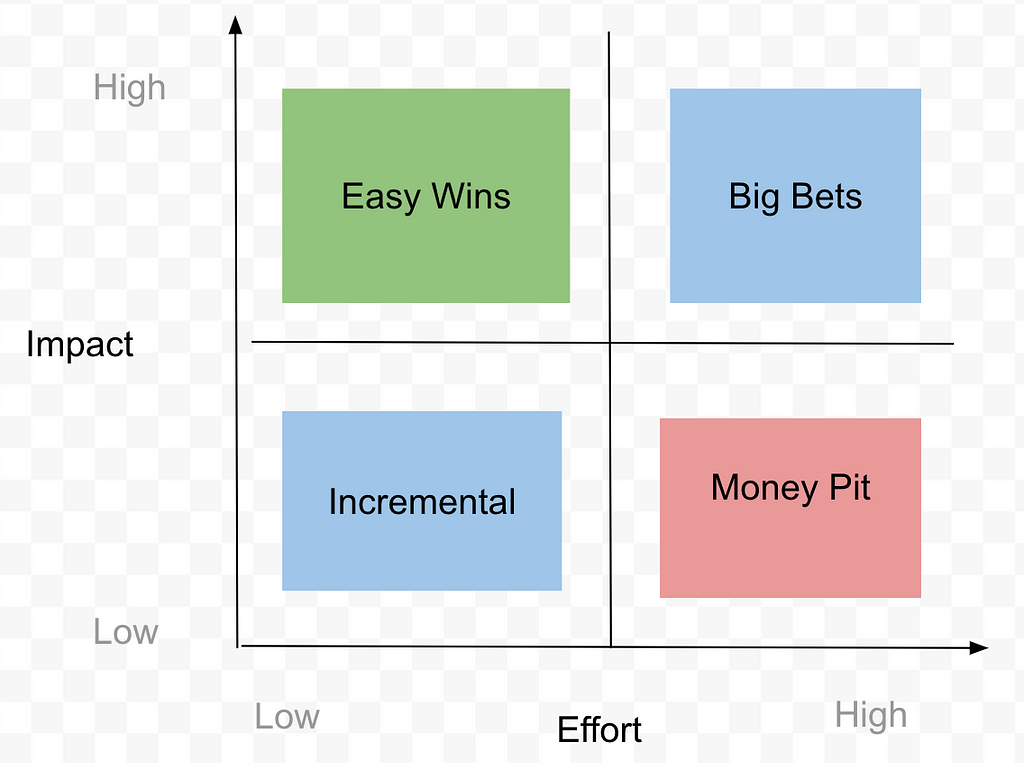
When new projects come to your pipeline, evaluate the effort and impact and compare them against your existing projects. If a newcomer looks more promising, don’t hesitate to shuffle things around — sometimes that means dropping an old project to make room for the shiny new one.
As company priorities often shift, it is ok to de-prioritize or re-prioritize projects midway; But here’s the trick: keep that constant evaluation going strong. Break down each project with those trusty questions, so you can keep your eyes locked on the prize — the most impactful stuff.
Disclaimer: This article reflects my experience and opinions only. It does not represent the views or opinions of any company or organization.
Unlocking Growth: 3 Years at Meta — Transformative Lessons for Work and Life was originally published in Towards Data Science on Medium, where people are continuing the conversation by highlighting and responding to this story.
Originally appeared here:
Unlocking Growth: 3 Years at Meta — Transformative Lessons for Work and Life


How I used a custom training dataset and information retrieval for global storytelling. 好样的! Bravo! वाह! ¡Guau! 브라보!
Originally appeared here:
FanFabler: Fine-Tuning Llama 3 to Be a Multilingual Fanfic Writing Assistant


Learn how to run and test Microsoft’s new LLM, WizardLM2, and use it to perform tasks like question-answering and information extraction
Originally appeared here:
How to Use and Test WizardLM2: Microsoft’s New LLM
Go Here to Read this Fast! How to Use and Test WizardLM2: Microsoft’s New LLM


This is a step-by-step tutorial for getting started with the Dev Containers extension. This tutorial is the first of a sequence of…
Originally appeared here:
Getting Started with the Dev Containers Extension
Go Here to Read this Fast! Getting Started with the Dev Containers Extension

A Practical Guide to Building and Evaluating Protein Language Models
Originally appeared here:
Building Transformer Models for Proteins From Scratch
Go Here to Read this Fast! Building Transformer Models for Proteins From Scratch


TLDR
1. At a temperature of 1, the probability values are the same as those derived from the standard softmax function.
2. Raising the temperature inflates the probabilities of the less likely tokens, thereby broadening the range of potential candidates (or diversity) for the model’s next token prediction.
3. Lowering the temperature, on the other hand, makes the probability of the most likely token approach 1.0, boosting the model’s confidence. Decreasing the temperature effectively eliminates the uncertainty within the model.
Introduction
Large Language Models (LLMs) are versatile generative models suited for a wide array of tasks. They can produce consistent, repeatable outputs or generate creative content by placing unlikely words together. The “temperature” setting allows users to fine-tune the model’s output, controlling the degree of predictability.
Let’s take a hypothetical example to understand the impact of temperature on the next token prediction.
We asked an LLM to complete the sentence, “This is a wonderful _____.” Let’s assume the potential candidate tokens are:
|   token    | logit |
|------------|-------|
| day        |    40 |
| space      |     4 |
| furniture  |     2 |
| experience |    35 |
| problem    |    25 |
| challenge  |    15 |
The logits are passed through a softmax function so that the sum of the values is equal to one. Essentially, the softmax function generates probability estimates for each token.
Let’s calculate the probability estimates in Python.
import numpy as np
import seaborn as sns
import pandas as pd
import matplotlib.pyplot as plt
from ipywidgets import interactive, FloatSlider


def softmax(logits):
    exps = np.exp(logits)
    return exps / np.sum(exps)


data = {
    "tokens": ["day", "space", "furniture", "experience", "problem", "challenge"],
    "logits": [5, 2.2, 2.0, 4.5, 3.0, 2.7]
}
df = pd.DataFrame(data)
df['probabilities'] = softmax(df['logits'].values)
df
| No. |   tokens   | logits | probabilities |
|-----|------------|--------|---------------|
|   0 | day        |    5.0 |      0.512106 |
|   1 | space      |    2.2 |      0.031141 |
|   2 | furniture  |    2.0 |      0.025496 |
|   3 | experience |    4.5 |      0.310608 |
|   4 | problem    |    3.0 |      0.069306 |
|   5 | challenge  |    2.7 |      0.051343 |
ax = sns.barplot(x="tokens", y="probabilities", data=df)
ax.set_title('Softmax Probability Estimates')
ax.set_ylabel('Probability')
ax.set_xlabel('Tokens')
plt.xticks(rotation=45)
for bar in ax.patches:
    ax.text(bar.get_x() + bar.get_width() / 2, bar.get_height(), f'{bar.get_height():.2f}',
            ha='center', va='bottom', fontsize=10, rotation=0)
plt.show()
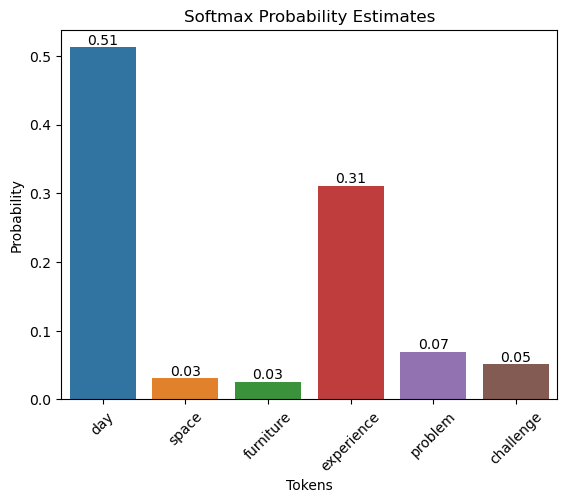
The softmax function with temperature is defined as follows:

where (T) is the temperature, (x_i) is the (i)-th component of the input vector (logits), and (n) is the number of components in the vector.
def softmax_with_temperature(logits, temperature):
    if temperature <= 0:
        temperature = 1e-10  # Prevent division by zero or negative temperatures
    scaled_logits = logits / temperature
    exps = np.exp(scaled_logits - np.max(scaled_logits))  # Numerical stability improvement
    return exps / np.sum(exps)


def plot_interactive_softmax(temperature):
    probabilities = softmax_with_temperature(df['logits'], temperature)
    plt.figure(figsize=(10, 5))
    bars = plt.bar(df['tokens'], probabilities, color='blue')
    plt.ylim(0, 1)
    plt.title(f'Softmax Probabilities at Temperature = {temperature:.2f}')
    plt.ylabel('Probability')
    plt.xlabel('Tokens')
    # Add text annotations
    for bar, probability in zip(bars, probabilities):
        yval = bar.get_height()
        plt.text(bar.get_x() + bar.get_width()/2, yval, f"{probability:.2f}", ha='center', va='bottom', fontsize=10)
    plt.show()

interactive_plot = interactive(plot_interactive_softmax, temperature=FloatSlider(value=1, min=0, max=2, step=0.01, description='Temperature'))
interactive_plot
At T = 1,
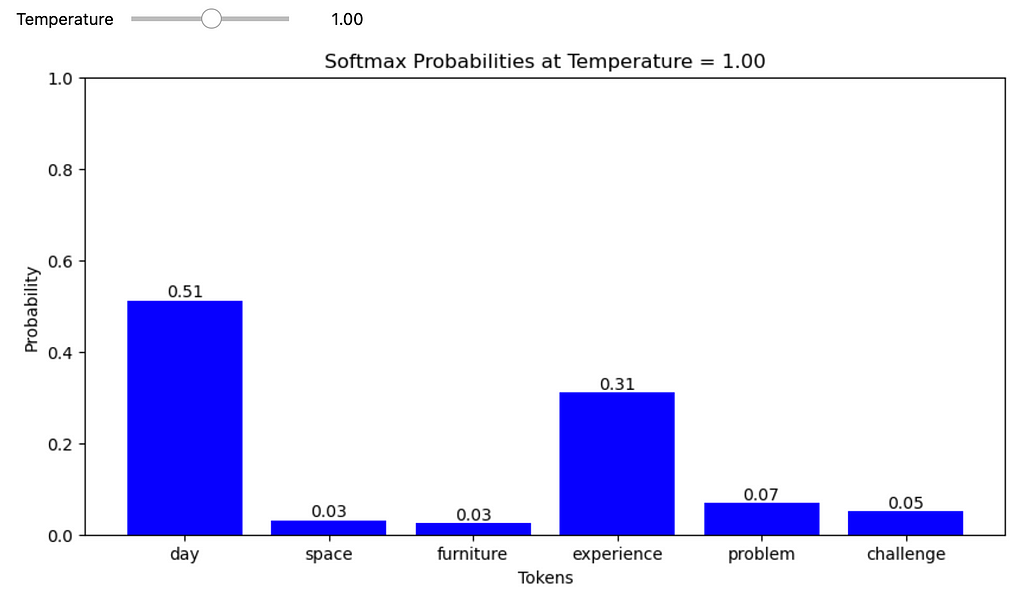
At a temperature of 1, the probability values are the same as those derived from the standard softmax function.
At T > 1,
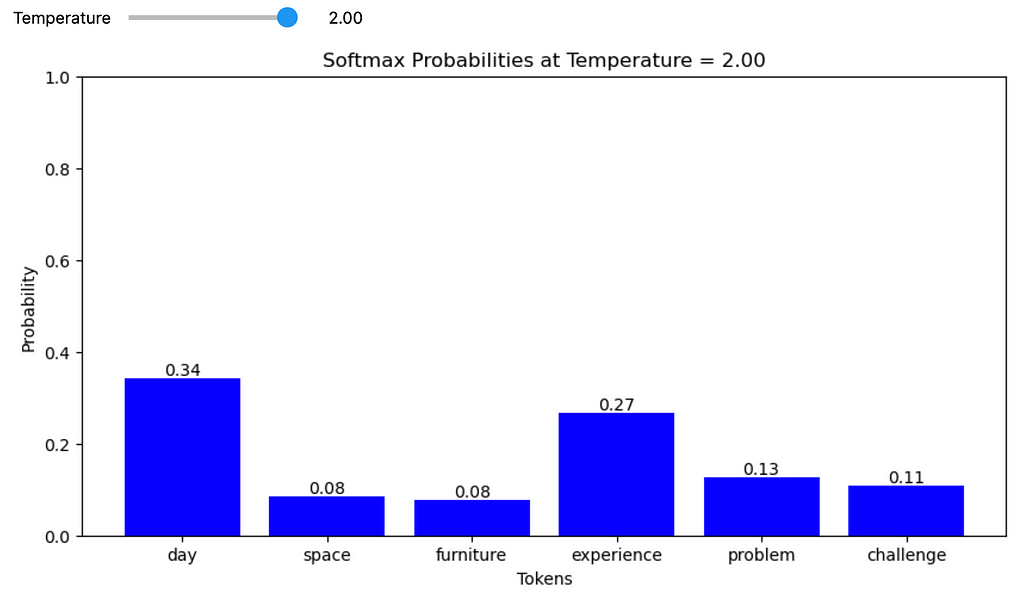
Raising the temperature inflates the probabilities of the less likely tokens, thereby broadening the range of potential candidates (or diversity) for the model’s next token prediction.
At T < 1,
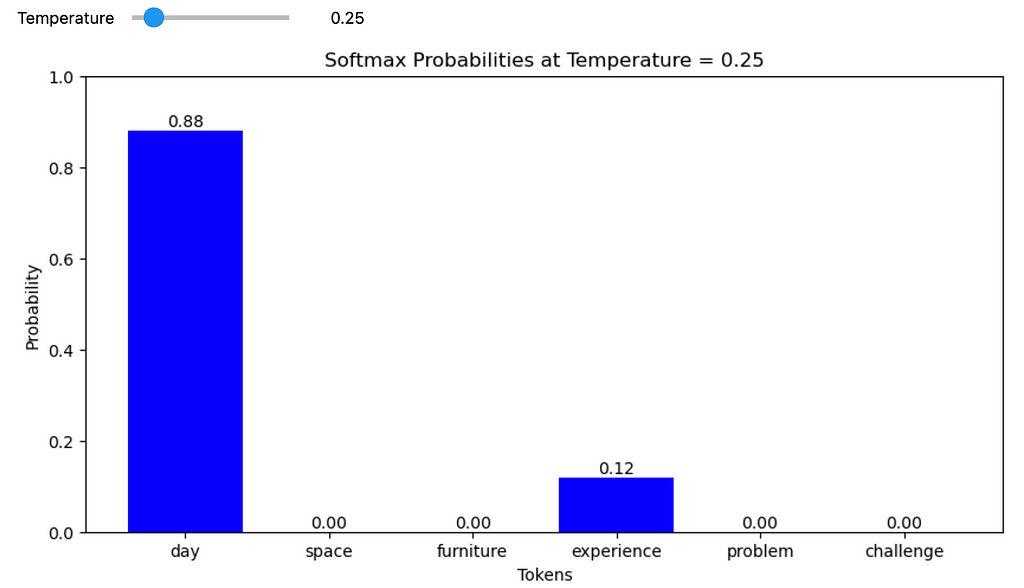
Lowering the temperature, on the other hand, makes the probability of the most likely token approach 1.0, boosting the model’s confidence. Decreasing the temperature effectively eliminates the uncertainty within the model.
Conclusion
LLMs leverage the temperature parameter to offer flexibility in their predictions. The model behaves predictably at a temperature of 1, closely following the original softmax distribution. Increasing the temperature introduces greater diversity, amplifying less likely tokens. Conversely, decreasing the temperature makes the predictions more focused, increasing the model’s confidence in the most probable token by reducing uncertainty. This adaptability allows users to tailor LLM outputs to a wide array of tasks, striking a balance between creative exploration and deterministic output.
Unless otherwise noted, all images are by the author.
How does temperature impact next token prediction in LLMs? was originally published in Towards Data Science on Medium, where people are continuing the conversation by highlighting and responding to this story.
Originally appeared here:
How does temperature impact next token prediction in LLMs?
Go Here to Read this Fast! How does temperature impact next token prediction in LLMs?


One small step towards autonomous crater-based navigation
Originally appeared here:
Lunar Crater Detection: Computer Vision in Space
Go Here to Read this Fast! Lunar Crater Detection: Computer Vision in Space