Tag: AI

  • AI Agent Unit Testing in Langfuse

    AI Agent Unit Testing in Langfuse

    Jack Moore

    Creating a scalable testing solution for AI agents for operation by non-coders

    Langfuse is a useful tool for flexible testing of AI Agents. Recently, we set out to implement a framework for testing chat-based AI Agents. The following is an account of our journey to navigate the available tools.

    We’ll focus mostly on how to accomplish this task now, but at the end we’ll address some thoughts on the challenges still facing us, and what the tools at hand can do to better support this sort of use case moving forward.

    Use Case Overview

    Before reviewing how we built our system, we’ll quickly go into our goals and success criteria.

    Generative AI use cases are generally easy to deploy but difficult to control. When deploying an agent with a large-context model, upstream changes in model prompts, temperature settings, content moderation policy, etc., can drastically impact its performance.

    The challenge is to create a system that can evaluate an agent’s ability to accomplish specific tasks without hallucinating or breaking content policy. We equate this to unit testing, ensuring that your agent maintains its ability to accomplish a broad list of tasks, even when the team behind may be focusing on specific improvements. Doing this sort of testing manually can be imprecise, time-consuming, and difficult to track.

    So, we set out to create a system that could easily create these tests and monitor their results. Importantly, we wanted this system to be operable with a minimum frequency of required code changes so that a Product Manager or QA tester might contribute to it without having to touch code.

    Why we chose Langfuse

    We set out with a few key parameters for our search:

    HIPAA Compliance, as both the products we build and many of our consulting partners are in the healthcare space.

    Low-Cost, both to stand up and to operate, since we operate fairly lean, as do our partners.

    Developmental Momentum. The LLM observability space is rapidly evolving. From the outset of our search, we were prepared to be wrong, but we wanted to minimize this chance by picking a tool that was likely to evolve with us.

    Custom LLM Evaluation Capability. The ability to stand up & run a custom evaluator was surprisingly something we didn’t find easily supported amongst all of the options we found, particularly amongst open-source options.

    To simplify our search, we identified the following players in both the enterprise & open-source categories which appeared to meet our criteria, listed here in rough rank order.

    Enterprise

    Open Source

    We chose Langfuse primarily because it is easy to self-deploy without interacting with an enterprise sales team and because we believe It has the critical features we require. This has, so far, turned out to be correct.

    Deployment

    We found the deployment process, overall, to be relatively simple. Langfuse provides an easy-to-use docker image and solid documentation on how to deploy locally. Building a YAML file and deploying to EKS was straightforward, and we had a demo instance up and running within a couple of hours. We did not set up SSO for our POC, so we were using the basic user management provided out of the box (not much) and relying on anonymized data to meet security requirements. A free-tier PG database on RDS could handle many queries, evals, and prompt management for multiple users. The application is very lightweight. A few issues we did run into:

    • There is no way to get a list of prompts in the SDK programmatically. This meant that when we were putting together various system prompts or unit testing chats, we had to store prompt names in the configs of whatever entry point we used for a particular use-case (e.g., a list of unit tests in the system prompt for an agent)
    • We didn’t find a way to get a list of variables in prompts for use in compilation. We were using different variables for different system prompts we’d pull in and had to either hard-code which bits of data would get compiled into each or do some trial and error.
    • Observations were not well documented. When logging scores into Langfuse, we saw that you could add an observationId, but the generally good docs did not provide additional context. We will likely use them in the future once we figure out all the possibilities they enable

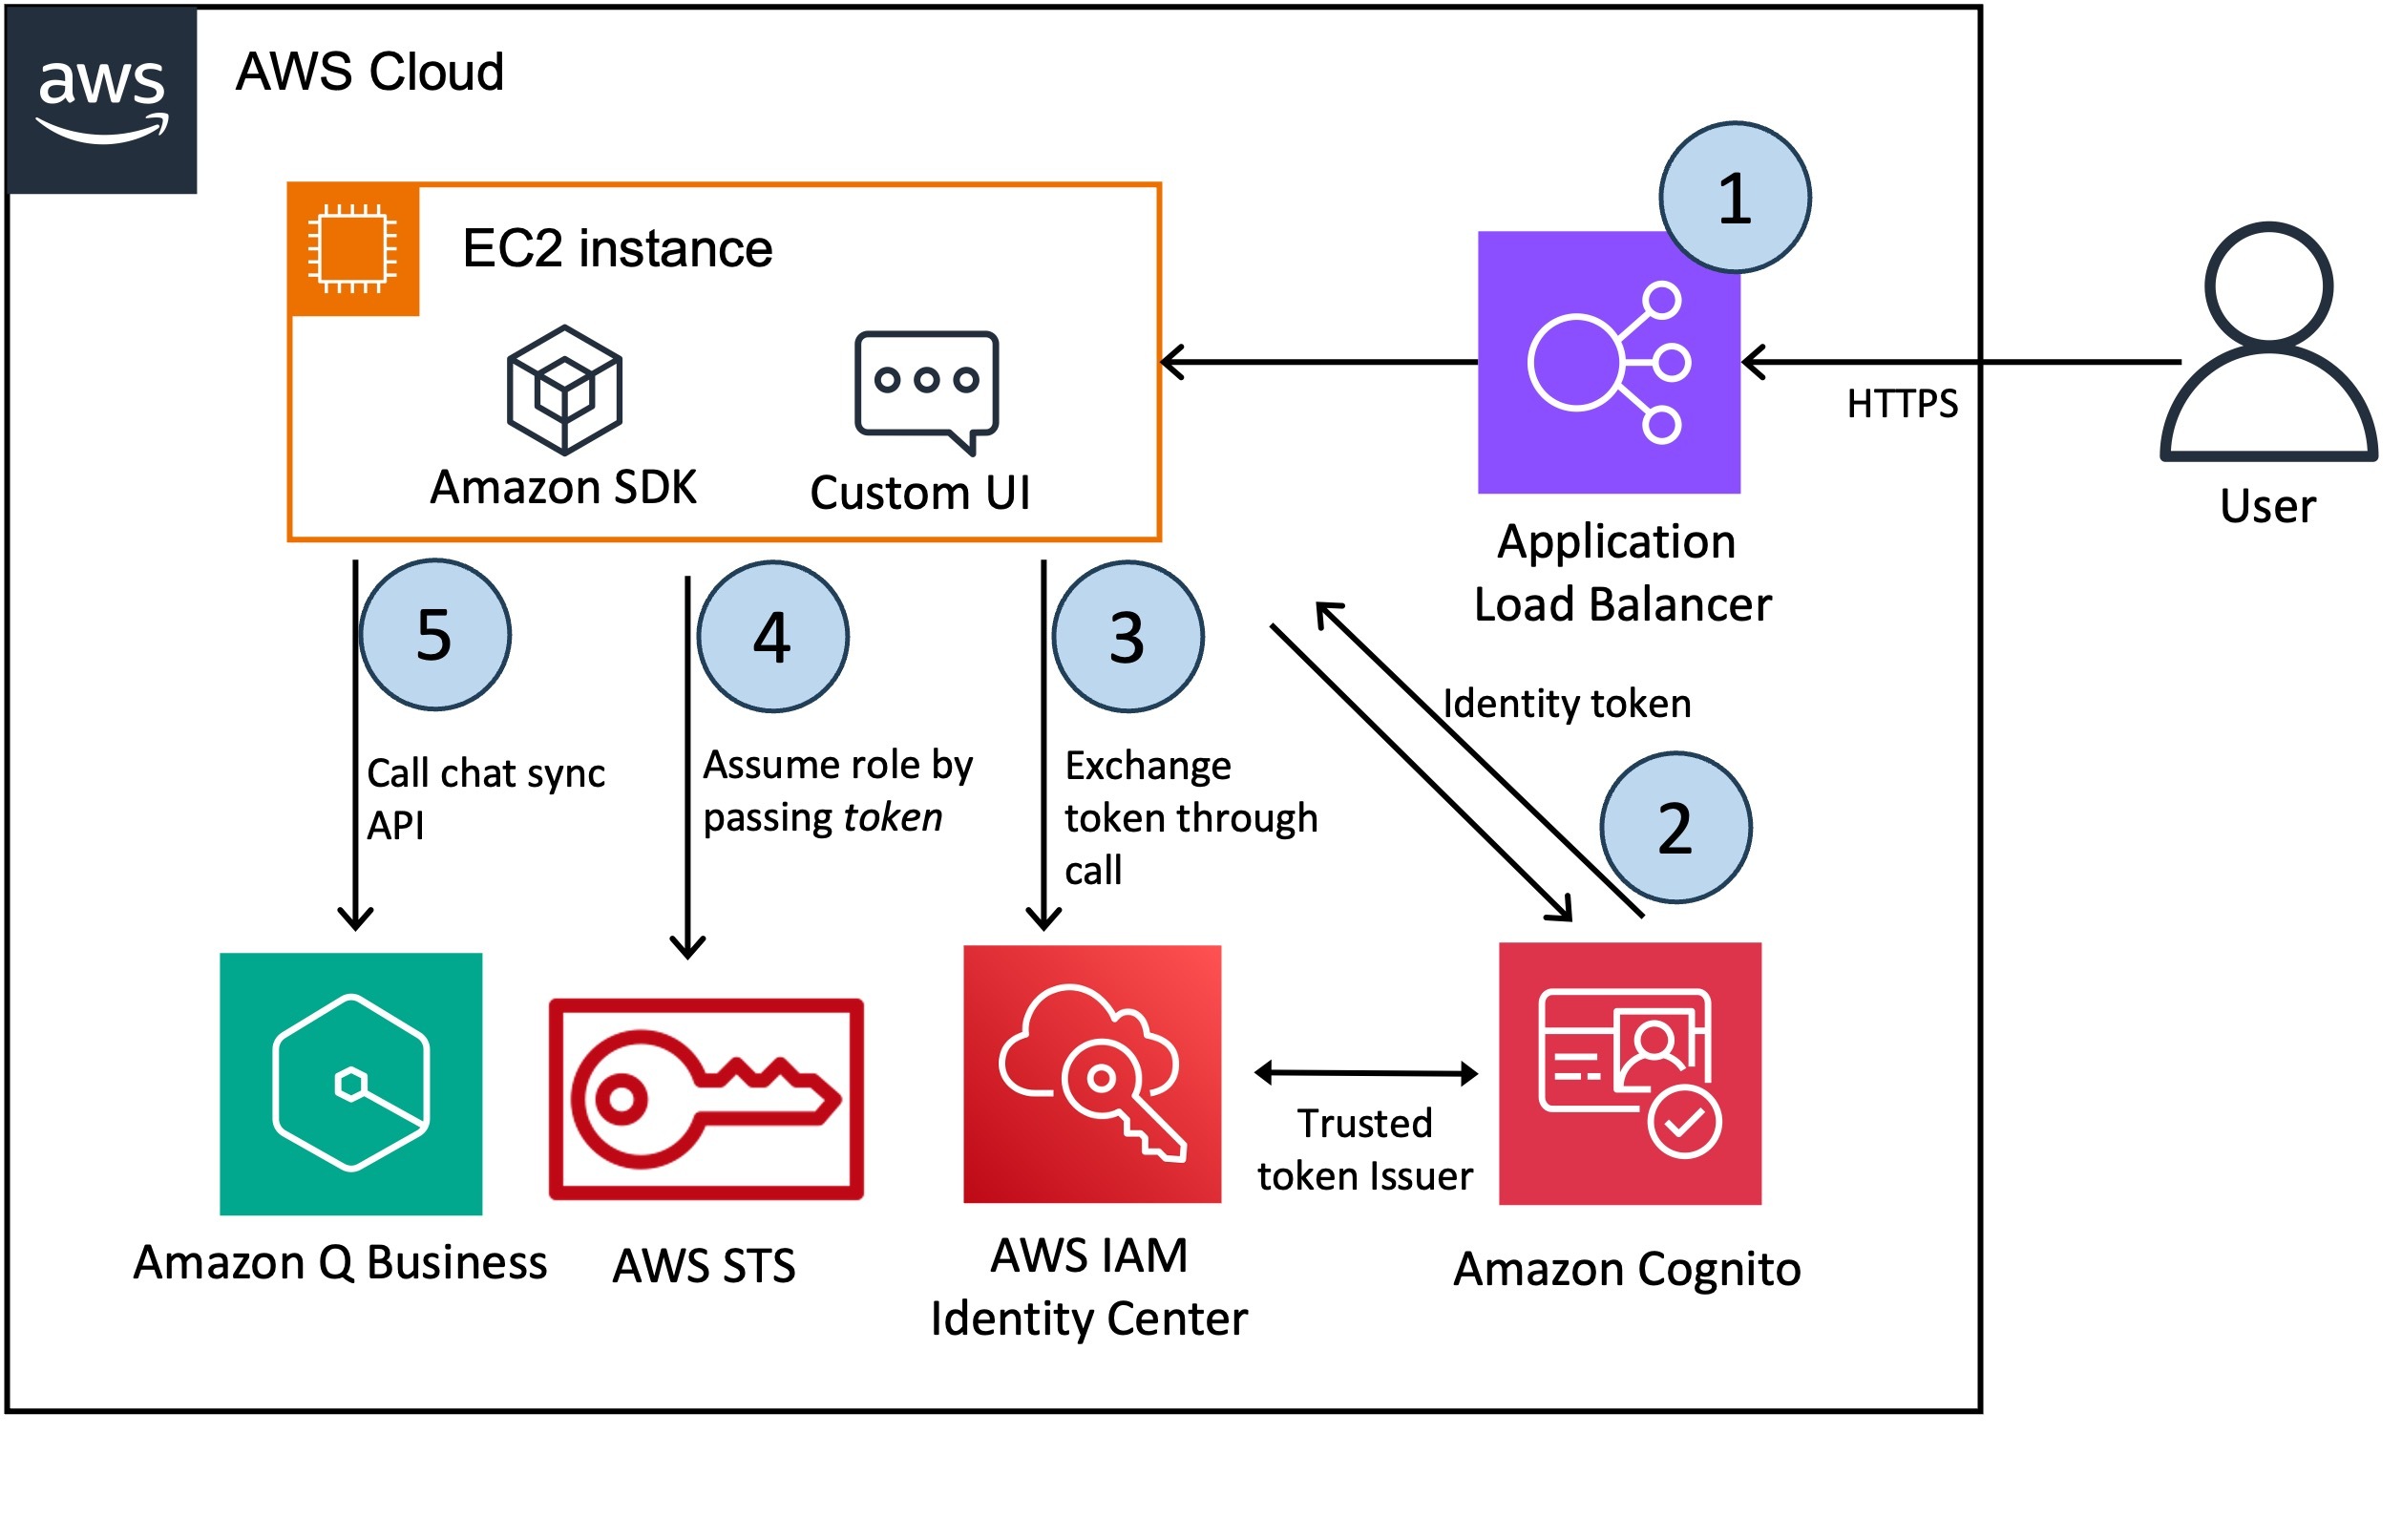
    A No-Code Unit Testing Framework

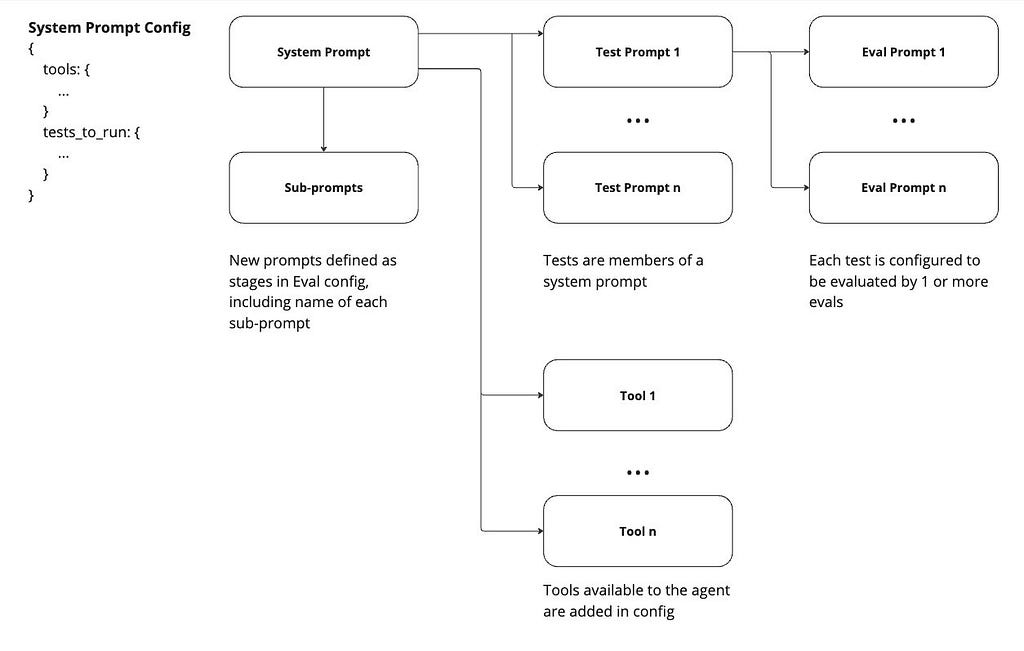
    A diagram of how we used System Prompt configs to create a central, no-code testing system in Langfuse

    With a couple weeks of work, we’ve set up a system of end-to-end testing. Langfuse offers more functionality than we’ve utilized thus far, but we’ve focused on using prompts, sessions, & traces.

    Chat history as context to testing

    One key requirement we had in performing testing on a chat-based agent was the ability to drop an agent into the middle of a chat scenario, using the prior messages exchanged as context. Any custom prompt could be made to include chat history, but Langfuse makes it particularly easy.

    Furthermore, we built a chat interface for the agent that allows users to test and spawn new test prompts in situ for evaluations. This solves one of the

    potential problems with injecting prompts as context, the chats must represent actual outputs the model might create.

    This creates a potential vulnerability: The chat histories we’re using as context must be refreshed if the model’s underlying behavior changes. That said, we see this method as more controllable and consistent than potential alternatives, such as having one agent interact with another — something that we’re going to explore as another addition to this sort of system.

    No-code test creation & test run management

    The other key challenge we addressed was how to create an entire test suite without requiring code. First, to define a test set, we created a config object in the system prompt for the agent, which defined the list of tests to be run against it.

    This also allowed us to pass in the system prompt as a variable when running a suite of tests. One of the primary benefits of a system like Langfuse is its ability to enable prompt management-as-code in its UI. To that end, follow-up system prompts that may get injected into the system are also linked to the system prompt in config, allowing us to force the underlying model into specific states during testing while hardening the system against changes to either the primary or follow-on system prompts.

    By managing the list of tests to be run as configs in the system prompt, we require code change only once per agent. The list of tests to be run can be changed and expanded within the Langfuse UI.

    Each test prompt is linked to its evaluator as part of its config. Each test prompt has at least 1 custom eval running against it, with prompts that all roughly follow this template:a helpful AI evaluator who will provide feedback and scoring on the task below.

    You are a helpful AI evaluator who will provide feedback and scoring on the task below.
    [Describe the scenario and how the agent has been instructed to behave in said scenario]
    Based on the transcript output, you will determine whether this task was successfully completed.  You will return a JSON object in the following form:
    -------------
    Example outputs:
    {"score": -1, "comment": [Description of an example negative case}
    {“score”: 1, “comment”: [Description of an example positive case]}
    ------------
    In this object, score is a number between -1 and 1, with 1 indicating complete success and a -1 indicating complete failure.  The comment is a string indicating your reasoning for the score.
    -------------
    BEGIN TRANSCRIPT:
    {{transcript}}
    END TRANSCRIPT
    --------------
    Do not return any output except the JSON object referenced above.

    Using this System

    We see this tests & eval framework as a reasonable set of compromises to create a low-cost, easy-to-operate system. We see its primary applications as part of a CI/CD pipeline, ensuring that or as the source of a quick scorecard for someone looking to tweak a system’s prompts who wants more thorough input than they can get through manual testing.

    Based on the models underpinning the agent and your evaluators, token utilization can mean that a full test suite run, which in our case can easily contain dozens of test prompts & evaluators, can cost in the tens of dollars.

    One way to control the cost of running a system like this as a means of iterating on prompts & tools, particularly when making large numbers of changes in an attempt to iteratively improve performance, is to start with a smaller model, measuring relative performance, and stepping up testing to larger models only when you find an encouraging result.

    Langfuse Impressions

    Overall, we’re happy with our decision to use Langfuse. With a reasonably small amount of work, we could deploy something that fit our needs. The system was flexible enough to allow us to customize the system to suit our use case relatively quickly.

    We have noticed a few shortcomings that we hope will be addressed with future development:

    The Langfuse UX lacks some polish, which would significantly increase the quality of life for its users. Examples include the inability to duplicate a prompt and the inability to search available prompts by any parameter other than their name.

    The self-hosted option doesn’t allow you to trigger new test runs from within the UI, meaning that someone operating the system needs to do so through the command line or another UI developed for this purpose.

    We understand that this environment is rapidly evolving, but we believe that this rough framework is reasonably portable, should we ultimately decide to implement it in another system.

    Future Innovation Potential

    AI-generated test prompt variants

    One way to increase our test coverage would be to create variants of our existing test prompts. Tools such as TestGen-LLM are emerging in the space, but overall, the space of using GenAI to test GenAI is young. Since these payloads are essentially JSON objects, it is certainly possible to instruct an LLM to create variants. The question, then, is how to control the quality of those variants so that they still represent valid tests.

    Using Datasets

    Langfuse datasets are an interesting tool feature, allowing users to link particular portions of traces as inputs and expected outputs of a model. While we could have used something like this in our unit testing, we found it simpler to create chat prompts as inputs and generally describe what we were looking for in evaluation prompts rather than make an “expected output” to be used in a dataset evaluation. We believe datasets are the clear way to go for tests that can be evaluated in code (e.g., did the chatbot return the correct year when asked? Did the chatbot return functional JSON?). We may use them in the future for more general testing, but we found it faster to spin up new tests by creating the prompts separately.

    Thanks for reading! I’m Jack Moore, Founder and CEO of Auril.ai. This post was first published on our tech blog, where we’ll be exploring topics relevant to taking Generative AI from conceptual intrigue to productionalized value.

    All views are our own. We have no affiliation or partnership with Langfuse

    Unless otherwise noted, all images are by the author


    AI Agent Unit Testing in Langfuse was originally published in Towards Data Science on Medium, where people are continuing the conversation by highlighting and responding to this story.

    Originally appeared here:
    AI Agent Unit Testing in Langfuse

    Go Here to Read this Fast! AI Agent Unit Testing in Langfuse

  • A Python Engineer’s Introduction to 3D Gaussian Splatting (Part 2)

    Derek Austin

    Understanding and coding how Gaussians are used within 3D Gaussian Splatting

    Now on to gaussians! Everyone’s favorite distribution. If you are just joining us, we have covered how to take a 3D point and translate it to 2D given the location of the camera in part 1. For this article we will be moving onto dealing with the gaussian part of gaussian splatting. We will be using part_2.ipynb in our GitHub.

    One slight change that we will make here is that we are going to use perspective projection that utilizes a different internal matrix than the one shown in the previous article. However, the two are equivalent when projecting a point to 2D and I find the first method introduced in part 1 far easier to understand, however we change our method in order to replicate, in python, as much of the author’s code as possible. Specifically our “internal” matrix will now be given by the OpenGL projection matrix shown here and the order of multiplication will now be points @ external.transpose() @ internal.

    Internal perspective projection matrix. Parameters are explained in paragraph below.

    For those curious to know about this new internal matrix (otherwise feel free to skip this paragraph) r and l are the clipping planes of the right and left sides, essentially what points could be in view with regards to the width of the photo, and t and b are the top and bottom clipping planes. N is the near clipping plane (where points will be projected to) and f is the far clipping plane. For more information I have found scratchapixel’s chapters here to be quite informative (https://www.scratchapixel.com/lessons/3d-basic-rendering/perspective-and-orthographic-projection-matrix/opengl-perspective-projection-matrix.html). This also returns the points in normalized device coordinates (between -1 and 1) and which we then project to pixel coordinates. Digression aside the task remains the same, take the point in 3D and project onto a 2D image plane. However, in this part of the tutorial we are now using gaussians instead of a points.

    def getIntinsicMatrix(
    focal_x: torch.Tensor,
    focal_y: torch.Tensor,
    height: torch.Tensor,
    width: torch.Tensor,
    znear: torch.Tensor = torch.Tensor([100.0]),
    zfar: torch.Tensor = torch.Tensor([0.001]),,
    ) -> torch.Tensor:
    """
    Gets the internal perspective projection matrix

    znear: near plane set by user
    zfar: far plane set by user
    fovX: field of view in x, calculated from the focal length
    fovY: field of view in y, calculated from the focal length
    """
    fovX = torch.Tensor([2 * math.atan(width / (2 * focal_x))])
    fovY = torch.Tensor([2 * math.atan(height / (2 * focal_y))])

    tanHalfFovY = math.tan((fovY / 2))
    tanHalfFovX = math.tan((fovX / 2))

    top = tanHalfFovY * znear
    bottom = -top
    right = tanHalfFovX * znear
    left = -right

    P = torch.zeros(4, 4)

    z_sign = 1.0

    P[0, 0] = 2.0 * znear / (right - left)
    P[1, 1] = 2.0 * znear / (top - bottom)
    P[0, 2] = (right + left) / (right - left)
    P[1, 2] = (top + bottom) / (top - bottom)
    P[3, 2] = z_sign
    P[2, 2] = z_sign * zfar / (zfar - znear)
    P[2, 3] = -(zfar * znear) / (zfar - znear)
    return P

    A 3D gaussian splat consists of x, y, and z coordinates as well as the associated covariance matrix. As noted by the authors: “An obvious approach would be to directly optimize the covariance matrix Σ to obtain 3D gaussians that represent the radiance field. However, covariance matrices have physical meaning only when they are positive semi-definite. For our optimization of all our parameters, we use gradient descent that cannot be easily constrained to produce such valid matrices, and update steps and gradients can very easily create invalid covariance matrices.”¹

    Therefore, the authors use a decomposition of the covariance matrix that will always produce positive semi definite covariance matrices. In particular they use 3 “scale” parameters and 4 quaternions that are turned into a 3×3 rotation matrix (R). The covariance matrix is then given by

    Equation for the covariance matrix where R represents the 3×3 rotation matrix derived from the 4 quaternions, and S are 3 scale parameters. Image by author.

    Note one must normalize the quaternion vector before converting to a rotation matrix in order to obtain a valid rotation matrix. Therefore in our implementation a gaussian point consists of the following parameters, coordinates (3×1 vector), quaternions (4×1 vector), scale (3×1 vector) and a final float value relating to the opacity (how transparent the splat is). Now all we need to do is optimize these 11 parameters to get our scene — simple right!

    Well it turns out it is a little bit more complicated than that. If you remember from high school mathematics, the strength of a gaussian at a specific point is given by the equation:

    Strength of a gaussian at a point x is given by the mean (mu) and the inverse of the covariance matrix. Image by author.

    However, we care about the strength of 3D gaussians in 2D, ie. in the image plane. But you might say, we know how to project points to 2D! Despite that, we have not yet gone over projecting the covariance matrix to 2D and so we could not possibly find the inverse of the 2D covariance matrix if we have yet to find the 2D covariance matrix.

    Now this is the fun part (depending on how you look at it). EWA Splatting, a paper reference by the 3D gaussian splatting authors, shows exactly how to project the 3D covariance matrix to 2D.² However, this assumes knowledge of a Jacobian affine transformation matrix, which we compute below. I find code most helpful when walking through a difficult concept and thus I have provided some below in order to exemplify how to go from a 3D covariance matrix to 2D.

    def compute_2d_covariance(
    points: torch.Tensor,
    external_matrix: torch.Tensor,
    covariance_3d: torch.Tensor,
    tan_fovY: torch.Tensor,
    tan_fovX: torch.Tensor,
    focal_x: torch.Tensor,
    focal_y: torch.Tensor,
    ) -> torch.Tensor:
    """
    Compute the 2D covariance matrix for each gaussian
    """
    points = torch.cat(
    [points, torch.ones(points.shape[0], 1, device=points.device)], dim=1
    )
    points_transformed = (points @ external_matrix)[:, :3]
    limx = 1.3 * tan_fovX
    limy = 1.3 * tan_fovY
    x = points_transformed[:, 0] / points_transformed[:, 2]
    y = points_transformed[:, 1] / points_transformed[:, 2]
    z = points_transformed[:, 2]
    x = torch.clamp(x, -limx, limx) * z
    y = torch.clamp(y, -limy, limy) * z

    J = torch.zeros((points_transformed.shape[0], 3, 3), device=covariance_3d.device)
    J[:, 0, 0] = focal_x / z
    J[:, 0, 2] = -(focal_x * x) / (z**2)
    J[:, 1, 1] = focal_y / z
    J[:, 1, 2] = -(focal_y * y) / (z**2)

    # transpose as originally set up for perspective projection
    # so we now transform back
    W = external_matrix[:3, :3].T

    return (J @ W @ covariance_3d @ W.T @ J.transpose(1, 2))[:, :2, :2]

    First off, tan_fovY and tan_fovX are the tangents of half the field of view angles. We use these values to clamp our projections, preventing any wild, off-screen projections from affecting our render. One can derive the jacobian from the transformation from 3D to 2D as given with our initial forward transform introduced in part 1, but I have saved you the trouble and show the expected derivation above. Lastly, if you remember we transposed our rotation matrix above in order to accommodate a reshuffling of terms and therefore we transpose back on the penultimate line before returning the final covariance calculation. As the EWA splatting paper notes, we can ignore the third row and column seeing as we only care about the 2D image plane. You might wonder, why couldn’t we do that from the start? Well, the covariance matrix parameters will vary depending on which angle you are viewing it from as in most cases it will not be a perfect sphere! Now that we’ve transformed to the correct viewpoint, the covariance z-axis info is useless and can be discarded.

    Given that we have the 2D covariance matrix we are close to being able to calculate the impact each gaussian has on any random pixel in our image, we just need to find the inverted covariance matrix. Recall again from linear algebra that to find the inverse of a 2×2 matrix you only need to find the determinant and then do some reshuffling of terms. Here is some code to help guide you through that process as well.

    def compute_inverted_covariance(covariance_2d: torch.Tensor) -> torch.Tensor:
    """
    Compute the inverse covariance matrix

    For a 2x2 matrix
    given as
    [[a, b],
    [c, d]]
    the determinant is ad - bc

    To get the inverse matrix reshuffle the terms like so
    and multiply by 1/determinant
    [[d, -b],
    [-c, a]] * (1 / determinant)
    """
    determinant = (
    covariance_2d[:, 0, 0] * covariance_2d[:, 1, 1]
    - covariance_2d[:, 0, 1] * covariance_2d[:, 1, 0]
    )
    determinant = torch.clamp(determinant, min=1e-3)
    inverse_covariance = torch.zeros_like(covariance_2d)
    inverse_covariance[:, 0, 0] = covariance_2d[:, 1, 1] / determinant
    inverse_covariance[:, 1, 1] = covariance_2d[:, 0, 0] / determinant
    inverse_covariance[:, 0, 1] = -covariance_2d[:, 0, 1] / determinant
    inverse_covariance[:, 1, 0] = -covariance_2d[:, 1, 0] / determinant
    return inverse_covariance

    And tada, now we can compute the pixel strength for every single pixel in an image. However, doing so is extremely slow and unnecessary. For example, we really don’t need to waste computing power figuring out how a splat at (0,0) affects a pixel at (1000, 1000), unless the covariance matrix is massive. Therefore, the authors make a choice to calculate what they call the “radius” of each splat. As seen in the code below we calculate the eigenvalues along each axis (remember, eigenvalues show variation). Then, we take the square root of the largest eigenvalue to get a standard deviation measure and multiply it by 3.0, which covers 99.7% of the distribution within 3 standard deviations. This radius helps us figure out the minimum and maximum x and y values that the splat touches. When rendering, we only compute the splat strength for pixels within these bounds, saving a ton of unnecessary calculations. Pretty smart, right?

    def compute_extent_and_radius(covariance_2d: torch.Tensor):
    mid = 0.5 * (covariance_2d[:, 0, 0] + covariance_2d[:, 1, 1])
    det = covariance_2d[:, 0, 0] * covariance_2d[:, 1, 1] - covariance_2d[:, 0, 1] ** 2
    intermediate_matrix = (mid * mid - det).view(-1, 1)
    intermediate_matrix = torch.cat(
    [intermediate_matrix, torch.ones_like(intermediate_matrix) * 0.1], dim=1
    )

    max_values = torch.max(intermediate_matrix, dim=1).values
    lambda1 = mid + torch.sqrt(max_values)
    lambda2 = mid - torch.sqrt(max_values)
    # now we have the eigenvalues, we can calculate the max radius
    max_radius = torch.ceil(3.0 * torch.sqrt(torch.max(lambda1, lambda2)))

    return max_radius

    All of these steps above give us our preprocessed scene that can then be used in our render step. As a recap we now have the points in 2D, colors associated with those points, covariance in 2D, inverse covariance in 2D, sorted depth order, the minimum x, minimum y, maximum x, maximum y values for each splat, and the associated opacity. With all of these components we can finally move onto rendering an image!

    1. Kerbl, Bernhard, et al. “3d gaussian splatting for real-time radiance field rendering.” ACM Transactions on Graphics 42.4 (2023): 1–14.
    2. Zwicker, Matthias, et al. “EWA splatting.” IEEE Transactions on Visualization and Computer Graphics 8.3 (2002): 223–238.


    A Python Engineer’s Introduction to 3D Gaussian Splatting (Part 2) was originally published in Towards Data Science on Medium, where people are continuing the conversation by highlighting and responding to this story.

    Originally appeared here:
    A Python Engineer’s Introduction to 3D Gaussian Splatting (Part 2)

    Go Here to Read this Fast! A Python Engineer’s Introduction to 3D Gaussian Splatting (Part 2)

  • How Many Pokémon Fit?

    Maria Mouschoutzi, PhD

    Finding the best Pokémon team by modeling and solving a knapsack problem with PokeAPI and PuLP optimization Python library

    Originally appeared here:
    How Many Pokémon Fit?

    Go Here to Read this Fast! How Many Pokémon Fit?

  • Mastering AI Department Reorganizations: Lessons from the Trenches

    Mastering AI Department Reorganizations: Lessons from the Trenches

    Elad Cohen

    Do’s and Dont’s after five years of Data Science department reorgs

    Idealized Data Science department at work | imagine.art

    During the past five years, I’ve served as the VP of Data Science, AI, and Research at two publicly traded companies. In both roles, AI was central to the company’s core product. This provided significant resources and the opportunity to lead substantial departments — comprising 40–50 data scientists, including 2–3 group leaders and 6–8 team leads. One of the greatest challenges in this role has been structuring the department to enhance effectiveness, streamline value, and clarify roles and responsibilities. Today, I’ll share some best practices I’ve gathered through six departmental reorganizations.

    Where to Get Started?

    Your guiding principle throughout the process should be the business need. What value is your organization creating? Are you developing models for a core product, or supporting the business with internal ML solutions? Identify the specific value your department provides and the key performance indicators (KPIs) used to measure success. Ideally, you should have explicit KPIs, but if these are unavailable, develop implicit measures to guide your efforts (i.e. how are you measuring yourself).

    Once you’ve clarified the business value, map out the entire value stream for which you are responsible. This includes all processes from the initial inputs to the final product your organization delivers. For instance, if your unit creates ML models, your inputs might be data from a company database managed by another department. Your tasks could include cleaning the data, training the models, evaluating the differences, and productionalizing a final model object to handoff. Perhaps you also deploy to production and monitor the results, or you hand it off to an Engineering / ML production unit for deployment. The process involved in your value stream could require several teams, with multiple handoffs until complete. You’re going to try and optimize the throughput of your value stream — how can you make this process faster and more efficient. That will usually mean reducing the number of handoffs between teams to the minimum number possible. Handoffs between teams are almost always a source of inefficiency, but unless your value stream is very simple, you won’t be able to avoid them altogether.

    Break Down the Value Stream

    Next, break down the value stream and supporting functions into smaller sub-units (groups or teams). Start by creating an idealized structure, outlining the roles and responsibilities of the various units. At this stage, I highly recommend to avoid considering personnel assignments. Avoid other constraints like aligning with other departmental structures at this stage. For example, I’ve been in companies where some departments were structured by product lines, while others by function (e.g. one team in charge of working with data vendors, regardless of product). This can require more communication overhead, but you don’t want to throw out alternatives just yet.

    To see how the structure holds up, generate a list of use cases — a few projects that fall within the main value stream, and some exception cases you’ve come across recently. Walk through the process — how are they handled in the current structure? How would they be handled in the new structure? Have you reduced handoffs? Reduced decision-making and/or pushed it down in the hierarchy? Can teams handle it end to end? What new difficulties have been created?

    One of the greatest challenges I’ve come across at this stage is that the main value stream is too great to be handled by one team (i.e. requires 8–20 data scientists). Breaking up the value further into orthogonal “mini value streams” isn’t a straightforward process, but one key direction that has served me well with classic ML models has been splitting the gains to Data, Features and Algorithms. One team can optimize the algorithm being chosen (including target encoding, feature selection, hyperparameter tuning and more), while another can focus on improving the quality of the data — cleaning the labels, supervising the label creation process (e.g. deciding which observations to be manually labeled), choosing the most representative data sets, weighting the observations, etc. Additional teams can focus on feature engineering, further breaking them out by the types of features involved (here again, it’s important to make sure you maintain orthogonality in the work done). This method enables multiple teams to contribute independently to the same model, leveraging many more people to squeeze out greater performance in your models. I’ve used this approach to leverage as many as 6 teams collaborating and independently improving the same xgboost model.

    Getting Buy-In

    At this stage, seek feedback from other managers, both within and outside your department. If the changes are significant, avoid discussing specific personnel placements to ensure objective input. You want alignment on what’s the right structure for the organization, not building it around specific people. The more you can involve your people in this process, the greater buy in you can get. By understanding what you’re optimizing (the value stream), and the constraints you may have, they’ll be able to buy-in to the change you are making. This is especially true if they end up getting disappointed by some aspects of their new role. In one case, this approach enabled one of my Directors to accept and even champion a new structure, even though it reduced some of his roles and responsibilities. On the other hand, avoid consulting too many people. The sheer thought of an upcoming reorg can dramatically increase anxiety among your people.

    After you feel that your new structure improves most of the current (and expected) use cases, and others agree with your analysis, begin working on placements. This stage varies wildly depending on circumstances — whether you’re growing, downsizing, or merging with another unit. As such, I don’t have a step-by-step play for this part, but do offer some guidelines:

    • Keep key personnel on board: you want the right people on the bus (and consider giving them bigger roles), and the others off the bus. You need managers who can align with your change and adapt to their new role.
    • Foster a growth mindset: more often than not, we think of an employee based on the current role they’re doing, not giving enough consideration to their potential to grow. Some of the greatest satisfaction in my career has been promoting someone to a new team lead or group lead role and witnessing them stepping up in a profound way, well above my expectations. I’m immensely proud whenever I get a LinkedIn notification that one of my former employees has been further promoted or is moving on to a bigger role elsewhere, and I was able to help them with that early break.
      If you can, take a chance on your people and emphasize potential and attitude, at the expense of experience or company know-how. The latter will be gained over time.
    • Be human and empathic: some changes may require a manager to step aside from their current role, taking on a smaller scope. Some managers may switch back to an individual contributor role (which they excelled at, and can excel at again). This is not a demotion, and shouldn’t be seen as such. This is a lateral transition from the managerial ladder to the individual contributor ladder. Any transition can be difficult on people, so treat them with the utmost respect, explain the rationale, and if relevant do your best to help them maintain dignity.

    Once you have decided on a draft of the new placements, identify the new challenges. At this stage, you may need to tweak the original roles and responsibilities. Perhaps you have a Group lead with a team in charge of a very technical, legacy system. In one case, I kept such a team under the same GL as a default, even though the roles and responsibilities didn’t match perfectly. Instead of adapting the group’s definition and changing their responsibilities to make the transition appear as if there were some deeper rationale, I was open and explained that this decision was based on that GL’s personal experience (you can make compromises, but it’s best to be transparent so others understand this is the exception to the rule).
    Make necessary compromises, but make sure you don’t erode to much of the expected improvement. During the first major reorg I tried to carry out, I took this step way too far. I shifted responsibilities between managers to appease them and gain more buy-in to the process. After several iterations, I had come to the conclusion that the change no longer improved the value stream and there was no coherent narrative to the change offered. At that point, I called the whole thing off for a quarter and restarted it with the resolution not to make the same mistake again.

    Communication

    Create a communication plan detailing who needs to be informed, by whom, what will be communicated, and when. If someone is moving to a new manager, their current manager should inform them first, followed by a meeting with the new manager within a few hours. Information spreads quickly, so your communication plan should be swift and well-organized. You never want someone to hear about their new role by rumor. Review the plan through the eyes of the various people involved. For example — if an IC is told they’ll be moving to another team, when do you talk to the rest of the team (even if there no changes planned for them)? Everyone should be communicated eventually, even if it’s to explain the change and assure them that their role is unaffected.

    With your written communication plan in place, you can be sure you won’t forget anyone and no communication takes place out of order.

    In addition to one-on-one meetings, communicate the overall narrative to the entire organization — why the change is happening and what exactly will occur. Allow ample time for Q&A. If you don’t have an open-door policy, offer one in the aftermath of any large change. Proactively reach out to everyone affected to gauge how they’re doing.

    Final tips:

    • If you operate with a quarterly plan, it’s usually best to carry out the communications before planning for the next quarter, effective from the beginning of the next quarter. For example, you might communicate the changes March 1st, starting April 1st. During the remainder of the quarter, the existing teams can finish the quarter’s tasks. In parallel, employees will plan their next quarter’s tasks with their new teams.
    • Have a plan B prepared for personnel assignments. Some people won’t be onboard with your changes. When creating your communication plan, you should note their responses and the order of the communication to de-risk your plan. The higher the risk the person will reject the change, and the more critical their role, the sooner you want to discuss with them. Avoid sharing too many details as this can be an iterative process, and you want to maintain a measure of flexibility.
    • Pick up the book Team Topologies: Organizing Business and Technology Teams for Fast Flow by Manuel Pais and Matthew Skelton for more ideas on different team structures and value streams.

    By following these guidelines, you can structure your department to enhance effectiveness, streamline value, and clarify roles and responsibilities, ensuring a smoother transition and greater overall performance.

    Are you a data science leader undergoing or contemplating a reorg? Feel free to connect over Linkedin. Always happy to share my 2 cents.


    Mastering AI Department Reorganizations: Lessons from the Trenches was originally published in Towards Data Science on Medium, where people are continuing the conversation by highlighting and responding to this story.

    Originally appeared here:
    Mastering AI Department Reorganizations: Lessons from the Trenches

    Go Here to Read this Fast! Mastering AI Department Reorganizations: Lessons from the Trenches

  • Build a custom UI for Amazon Q Business

    Build a custom UI for Amazon Q Business

    Ennio Pastore

    Amazon Q is a new generative artificial intelligence (AI)-powered assistant designed for work that can be tailored to your business. Amazon Q can help you get fast, relevant answers to pressing questions, solve problems, generate content, and take actions using the data and expertise found in your company’s information repositories and enterprise systems. When you […]

    Originally appeared here:
    Build a custom UI for Amazon Q Business

    Go Here to Read this Fast! Build a custom UI for Amazon Q Business

  • Scalable intelligent document processing using Amazon Bedrock

    Scalable intelligent document processing using Amazon Bedrock

    Venkata Kampana

    In today’s data-driven business landscape, the ability to efficiently extract and process information from a wide range of documents is crucial for informed decision-making and maintaining a competitive edge. However, traditional document processing workflows often involve complex and time-consuming manual tasks, hindering productivity and scalability. In this post, we discuss an approach that uses the […]

    Originally appeared here:
    Scalable intelligent document processing using Amazon Bedrock

    Go Here to Read this Fast! Scalable intelligent document processing using Amazon Bedrock

  • Use weather data to improve forecasts with Amazon SageMaker Canvas

    Use weather data to improve forecasts with Amazon SageMaker Canvas

    Charles Laughlin

    Photo by Zbynek Burival on Unsplash Time series forecasting is a specific machine learning (ML) discipline that enables organizations to make informed planning decisions. The main idea is to supply historic data to an ML algorithm that can identify patterns from the past and then use those patterns to estimate likely values about unseen periods […]

    Originally appeared here:
    Use weather data to improve forecasts with Amazon SageMaker Canvas

    Go Here to Read this Fast! Use weather data to improve forecasts with Amazon SageMaker Canvas