Originally appeared here:
3 Simple Statistical Methods for Outlier Detection
Go Here to Read this Fast! 3 Simple Statistical Methods for Outlier Detection


OpenAI has recently introduced new features that showcase an agent-like architecture, such as the Assistant API. According to OpenAI:
The Assistants API allows you to build AI assistants within your own applications. An Assistant has instructions and can leverage models, tools, and files to respond to user queries. The Assistants API currently supports three types of tools: Code Interpreter, File Search, and Function calling.
While these advancements are promising, they still lag behind LangChain. LangChain enables the creation of agent-like systems powered by LLMs with greater flexibility in processing natural language input and executing context-based actions.
However, this is only the beginning.
At a high level, interaction with the Assistant API can be envisioned as a loop:

Unfortunately, despite the announced advantages, I found the documentation for the API to be poorly done, especially regarding interactions with custom function calls and building apps using frameworks like Streamlit.
In this blog post, I will guide you through building an AI assistant using the OpenAI Assistant API with custom function calls, paired with a Streamlit interface, to help those interested in effectively using the Assistant API.
In this blog post, I will demonstrate a simple example: an AI assistant capable of calculating tax based on a given revenue. Langchain users can easily come into mind implementing this by creating an agent with a “tax computation” tool.
This tool would include the necessary computation steps and a well-designed prompt to ensure the LLM knows when to call the tool whenever a question involves revenue or tax.
However, this process is not exactly the same with the OpenAI Assistant API. While the code interpreter and file search tools can be used directly in a straightforward manner according to OpenAI’s documentation, custom tools require a slightly different approach.
assistant = client.beta.assistants.create(
  name="Data visualizer",
  description="You are great at creating beautiful data visualizations. You analyze data present in .csv files, understand trends, and come up with data visualizations relevant to those trends. You also share a brief text summary of the trends observed.",
  model="gpt-4o",
  tools=[{"type": "code_interpreter"}],
)
Let’s break it down step by step. We aim to:
Please note that the tax computation tool described in the following paragraph is designed as a toy example to demonstrate how to use the API discussed in the post. It should not be used for actual tax calculations.
Consider the following piecewise function, which returns the tax value for a given revenue. Note that the input is set as a string for simpler parsing:
def calculate_tax(revenue: str):
    try:
        revenue = float(revenue)
    except ValueError:
        raise ValueError("The revenue should be a string representation of a number.")

    if revenue <= 10000:
        tax = 0
    elif revenue <= 30000:
        tax = 0.10 * (revenue - 10000)
    elif revenue <= 70000:
        tax = 2000 + 0.20 * (revenue - 30000)
    elif revenue <= 150000:
        tax = 10000 + 0.30 * (revenue - 70000)
    else:
        tax = 34000 + 0.40 * (revenue - 150000)

    return tax
Next, we define the assistant:
function_tools = [
    {
        "type": "function",
        "function": {
            "name": "calculate_tax",
            "description": "Get the tax for given revenue in euro",
            "parameters": {
                "type": "object",
                "properties": {
                    "revenue": {
                        "type": "string",
                        "description": "Annual revenue in euro"
                    }
                },
                "required": ["revenue"]
            }
        }
    }
]
# Define the assistant
assistant = client.beta.assistants.create(
    name="Assistant",
    instructions="",
    tools=function_tools,
    model="gpt-4o",
)
Now, the essential point:
How does the assistant use the function when “calculate_tax” is called? This part is poorly documented in the OpenAI assistant, and many users might get confused the first time using it. To handle this, we need to define an EventHandler to manage different events in the response stream, specifically how to handle the event when the “calculate_tax” tool is called.
    def handle_requires_action(self, data, run_id):
        tool_outputs = []

        for tool in data.required_action.submit_tool_outputs.tool_calls:
            if tool.function.name == "calculate_tax":
                try:
                    # Extract revenue from tool parameters
                    revenue = ast.literal_eval(tool.function.arguments)["revenue"]
                    # Call your calculate_tax function to get the tax
                    tax_result = calculate_tax(revenue)
                    # Append tool output in the required format
                    tool_outputs.append({"tool_call_id": tool.id, "output": f"{tax_result}"})
                except ValueError as e:
                    # Handle any errors when calculating tax
                    tool_outputs.append({"tool_call_id": tool.id, "error": str(e)})
        # Submit all tool_outputs at the same time
        self.submit_tool_outputs(tool_outputs)
The code above works as follows: For each tool call that requires action:
You can now interact with the assistant following these standard steps documented by OpenAI (for that reason, I will not provide many details in this section):
The code snippet below demonstrates how to run the assistant in my specific use case: The code sets up a streaming interaction with an assistant using specific parameters, including a thread ID and an assistant ID. An EventHandler instance manages events during the stream. The stream.until_done() method keeps the stream active until all interactions are complete. The with statement ensures that the stream is properly closed afterward.
  with client.beta.threads.runs.stream(thread_id=st.session_state.thread_id,
                                         assistant_id=assistant.id,
                                         event_handler=EventHandler(),
                                         temperature=0) as stream:
        stream.until_done()
While my post could end here, I’ve noticed numerous inquiries on the Streamlit forum (like this one) where users struggle to get streaming to work on the interface, even though it functions perfectly in the terminal. This prompted me to delve deeper.
To successfully integrate streaming into your app, you’ll need to extend the functionality of the EventHandler class mentioned earlier, specifically focusing on handling text creation, text deltas, and text completion. Here are the three key steps required to display text in the Streamlit interface while managing chat history:
For instance, consider the following code snippet for managing text deltas:
def on_text_delta(self, delta: TextDelta, snapshot: Text):
    """
    Handler for when a text delta is created
    """
    # Clear the latest text box
    st.session_state.text_boxes[-1].empty()

    # If there is new text, append it to the latest element in the assistant text list
    if delta.value:
        st.session_state.assistant_text[-1] += delta.value

    # Re-display the updated assistant text in the latest text box
    st.session_state.text_boxes[-1].info("".join(st.session_state["assistant_text"][-1]))
This code accomplishes three main tasks:
This blog post demonstrated how to use the OpenAI Assistant API and Streamlit to build an AI assistant capable of calculating tax.
I did this simple project to highlight the capabilities of the Assistant API, despite its less-than-clear documentation. My goal was to clarify ambiguities and provide some guidance for those interested in using the Assistant API. I hope this post has been helpful and encourages you to explore further possibilities with this powerful tool.
Due to space constraints, I have tried to avoid including unnecessary code snippets. However, if needed, please visit my Github repository to view the complete implementation.
Creating an Assistant with OpenAI Assistant API and Streamlit was originally published in Towards Data Science on Medium, where people are continuing the conversation by highlighting and responding to this story.
Originally appeared here:
Creating an Assistant with OpenAI Assistant API and Streamlit
Go Here to Read this Fast! Creating an Assistant with OpenAI Assistant API and Streamlit


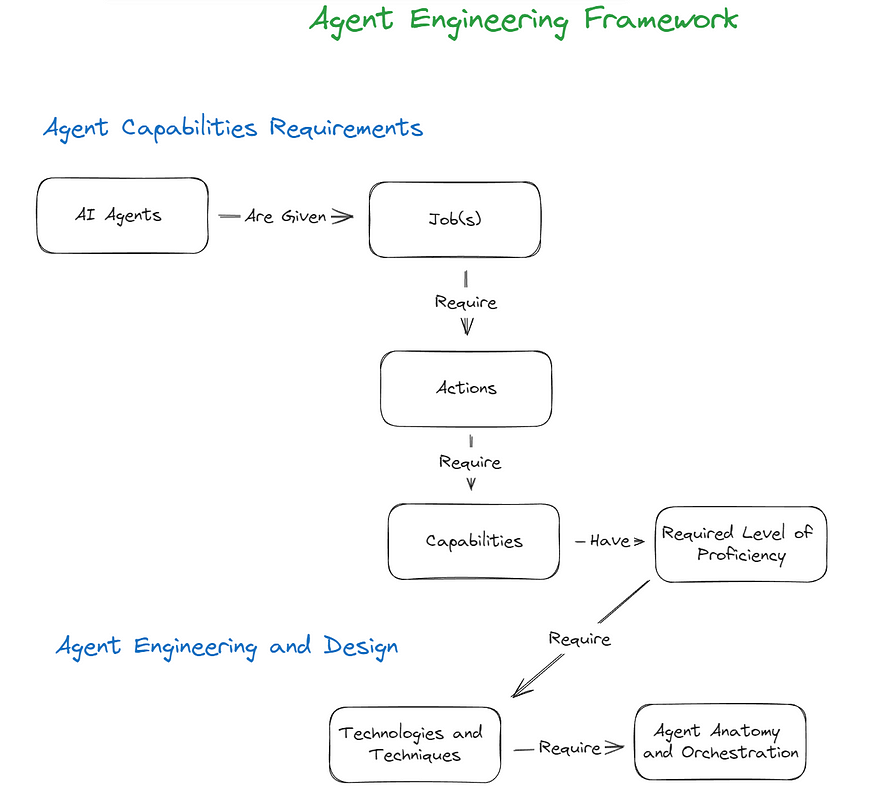
In my recent article ‘From Prompt Engineering to Agent Engineering’ I proposed a framework for AI Agent Engineering that introduces a mental model for approaching the design and creation of AI agents. To recap the framework proposes the following structure:
If you missed that article or need to refer back to it, you can find it here.
Although straightforward, on a deeper level, the framework tackles expansive topics and ideas. Drilling into the concepts surfaced by the broader framework is a substantial endeavor, and in this article, we continue our work by focusing on an AI Agent Capabilities Engineering Framework. The approach to this framework relies on a taxonomically oriented mindset, that extends concepts primarily rooted in cognitive and behavioral sciences.
As I have mentioned in other writings, throughout the history of human tool & technology development we have often used ourselves as the inspiration or model for what we are trying to build. A topical example of this in AI itself is the neural network which was inspired by the human brain. In an effort to build a framework for AI Agent Capabilities it seems natural then to turn to cognitive and behavioral sciences for inspiration, guidance and extension of useful concepts. Let’s first get a high-level grasp on what these sciences entail.
Cognitive Science
Cognitive science is the interdisciplinary study of the mind and its processes, encompassing areas such as psychology, neuroscience, linguistics, and artificial intelligence. It provides critical insights into how humans perceive, think, learn, and remember.
Behavioral Science
Behavioral science is an interdisciplinary field that studies cognitive processes and actions, often considering the behavioral interaction between individuals and their environments. It includes disciplines such as psychology, sociology, anthropology, and economics.
As the expectations for what AI agents can accomplish continue to reach new heights, grounding our capabilities framework in cognitive and behavioral theories should give us a solid foundation to begin to meet those expectations and help us unlock a future where AI agents are equipped to perform complex jobs with human-like proficiency.
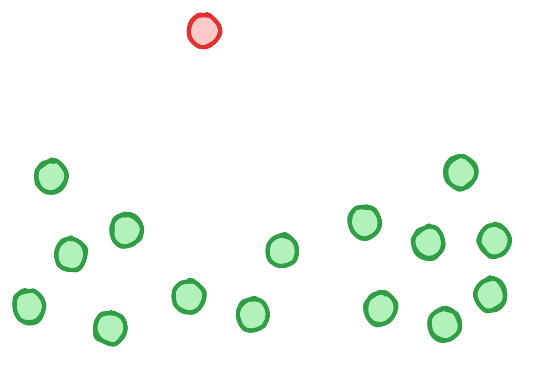
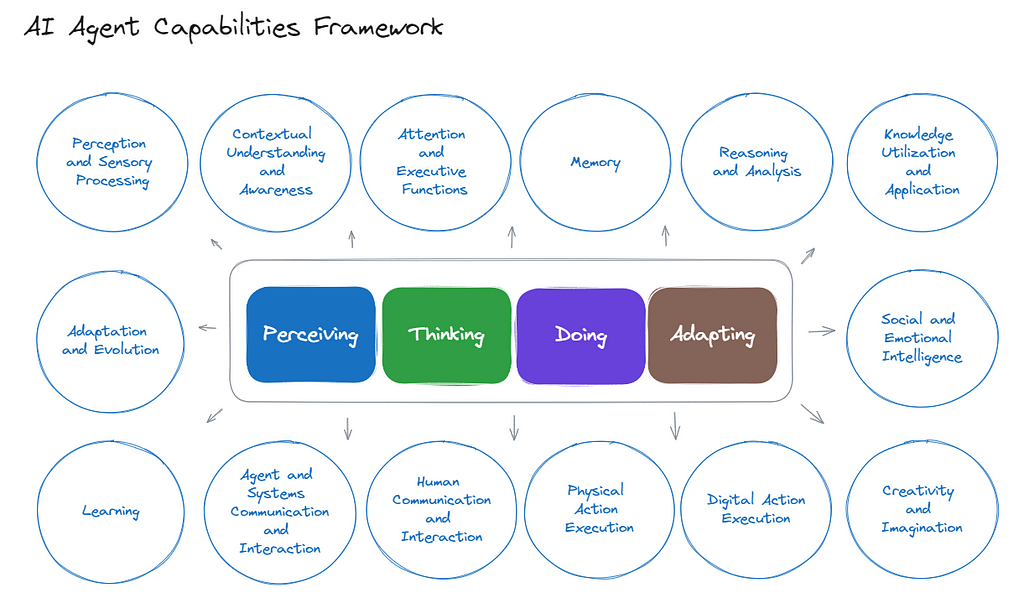
Before we dive into the minutiae let’s consider on a high-level how we might categorize the so-called ‘capabilities’ that power the ‘actions’ our agents need to take in an effort to perform their ‘jobs’. I propose that in general they fall into the categories of Perceiving, Thinking, Doing and Adapting. From there we can move on to identifying example capabilities in these categories on a more granular level. Although the resulting framework is categorically cohesive, bear in mind that the implied relationships between granular capabilities and categories are approximate. In reality the capabilities are heavily intertwined throughout the framework and trying to model this multi-dimensionality does not feel particularly useful at this stage. Below is a visual representation of the major categories and sub-categories that make up the framework without the categorical alignments that you will see shortly.
While our primary focus is driven by LLM-centered AI Agent Engineering, to future-proof and allow for the expansion of these frameworks into the realm of embodied AI and robots, we incorporate concepts that would be applicable in these settings as well.
Finally we do not deal with autonomy explicitly in the framework as it is more appropriately an overarching characteristic for a given agent or one of more of its capabilities. That said, autonomy is not necessarily a requirement that must be met for an agent to be effective in its given job(s).
With that foundation in place, let’s expand out the entire framework.
Encompasses the capabilities through which Agents acquire, interpret, and organize sensory information from the environment. It involves the detection, recognition and understanding of the appropriate stimuli, enabling Agents to perform as expected. Examples of granular capabilities include:
Refers to the capabilities that enable Agents to process information, form concepts, solve problems, make decisions, and apply knowledge. Examples of granular capabilities include:
Contextual Understanding and Awareness
Attention and Executive Functions
Memory
Reasoning and Analysis
Knowledge Utilization and Application
Social and Emotional Intelligence
Creativity and Imagination
Description: Involves the capabilities through which Agents interact with the environment and perform tasks. It includes both digital and physical actions. This category of capabilities also covers communication and interaction, enabling the Agent to engage meaningfully with users and other systems. Examples of granular capabilities include:
Description: Refers to the capabilities that allow Agents to adjust and evolve their behaviors, processes, and emotional responses based on new information, experiences, and feedback. To be clear, we are focused here on adaptation and learning capabilities of the agent in its operative state and not learning that happens within the context of enabling its foundational capabilities. In our framework that will be the domain of Tools & Techniques. Examples of granular capabilities include:
Learning
Adaptation and Evolution
Since this is intended to be an article and not a book, we won’t go into a detailed discussion on each of these example granular level capabilities. As much as I would like to believe that this is exhaustive, it’s at best a good start. Through iteration and feedback we will surely revise it, improve it and move towards a stable framework that might then be suitable for broader adoption.
Let’s turn now to some examples that illustrate the practical application of the framework and how it can be valuable in an agent engineering setting.
The practical application of the AI Agent Capabilities Framework involves leveraging its structured concepts, rooted in cognitive and behavioral science, to facilitate the design thinking process. Given the diversity in how we will envision and articulate desired capabilities for our agents, this framework helps establish a common ground, fostering consistency and comprehensiveness in capability design and engineering. This will be particularly valuable as the expectation for the sophistication level of our AI Agent’s capabilities continues to grow. Let’s explore an example:
AI Agent for Customer Support
Let’s consider an AI agent whose job is to provide customer support and personalized product recommendations. Armed with the framework, let’s aim for a higher fidelity job and scenario description that paints a more vivid picture.
Job: Deliver exceptional and empathetic customer support and product recommendations, while proactively predicting sales trends and incorporating granular contextual elements for highly personalized interactions.
Scenario: It is a bustling online customer service environment, and our AI agent is tasked with not only resolving customer queries and making product recommendations but also enhancing the overall customer experience by anticipating needs and personalizing interactions. It is a job that encompasses a broad spectrum of actions and capabilities. A few years back, building some of these capabilities would have been completely out of reach. Can the capabilities for this job be effectively articulated using our AI Agent Capabilities Framework in an effort to ascertain its feasibility? Let’s take a closer look while bearing in mind that the below outline is not intended to be comprehensive:
Actions Required:
Capabilities Required:
2. Cognition
Contextual Understanding and Awareness:
Memory:
Reasoning and Analysis:
Knowledge Utilization and Application
Social and Emotional Intelligence
Creativity and Imagination
Action
Digital Interactions:
Human Communication and Interaction:
Agent and Systems Communication:
Adaptation
Learning:
Adaptation:
Some of these insights might be a bit surprising. For example, should AI Agents have relationship management as a capability? Or how about AI Agents that are pseudo-embodied on screen and are capable of observing and responding to a whole new array of data points they can “observe” via video? For certain, there are a plethora of privacy concerns and issues to contend with, but not a concept that we should rule out entirely.
Although this article will not focus on an evaluation of Technologies and Techniques to enable capabilities we should address the question that naturally emerges after going through the above exercise. Don’t LLMs give us the tools for most of these capabilities right out of the box?
Although LLMs have certainly advanced the state-of-the-art by leaps and bounds, the simple answer is, no. And in cases like the capabilities for reasoning and analysis, even though LLMs can simulate what looks like reasoning or analysis quite impressively, it falls far short of the human capabilities for such. In short, LLMs provide a not entirely reliable but powerful shortcut to enabling many of these capabilities. They represent a very consequential evolutionary step in intelligence and interaction technologies and their unprecedented adoption helps explain why there is so much excitement around the idea of Artificial General Intelligence (AGI). Although the definition of what it actually entails is the subject debate, if achieved, it could be the go to technology solution for enabling many of the cognitive/behavioral capabilities described above.
I hope you find the AI Agent Capabilities Engineering framework to be an insightful approach for defining your AI agents’ capabilities. By integrating concepts from cognitive and behavioral sciences, this framework aims to guide the development of the capabilities needed for AI agents to perform complex tasks. The framework is relatively dense and will surely evolve over time. The key takeaway at this stage is the mental model centered around Perceiving, Thinking, Doing, and Adapting. These four high-level concepts on their own provide a very robust foundation for organizing and developing Agent capabilities effectively.
Thanks for reading and stay tuned for future refinements of this framework and extension of other aspects of the AI Agenting Engineering framework. If you would like to discuss the framework or other topics I have written about further, do not hesitate to connect with me on LinkedIn.
Unless otherwise noted, all images in this article are by the author.
AI Agent Capabilities Engineering was originally published in Towards Data Science on Medium, where people are continuing the conversation by highlighting and responding to this story.
Originally appeared here:
AI Agent Capabilities Engineering
Go Here to Read this Fast! AI Agent Capabilities Engineering
As digitalization and innovation are taking over different domains, working with big datasets has become a norm and commonplace in Universities, research organizations, and industries. Automating the common tasks can save several hours for analysts, so they can spend less time on processing and managing data, and more time on the juicy part, which is analyzing and generating insights.
A pivot table is one such tool, which allows generaling several insights from stacked datasets. One can perform tons of analysis just by playing with the field settings of the pivot table based on the requirements. If someone has numerous stacked datasets that can be transformed into pivot tables, how can the pivot tables be refreshed automatically? How can one automate the selection of chart colors based on the series name and manage other chart elements? This blog post gives the answers to such questions by an illustrative example, step by step.
While it could take considerable effort to set up the code in the beginning, once it is set up, it can be very handy and time-saving to analysts who work with numerous large datasets daily. Let’s get started.

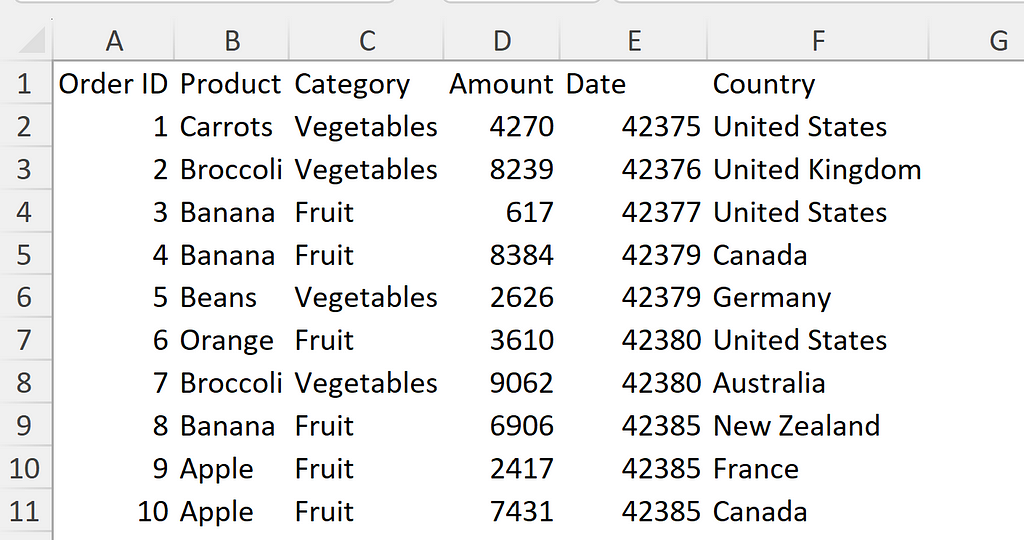
I took the sample data from the website of Excel-Easy. This is a nice website containing beginner-friendly tutorials on basic Excel and VBA functionalities. The dataset contains records of fruit and vegetable sales in specific countries in 2016 and 2017. The dataset contains six fields: Order ID, Product, Category, Amount, Date, and Country. I divided this dataset into 2 csv files called results1.csv and results2.csv for creating pivot tables.
I pulled this dataset in the RawData worksheet. I created a dynamic range called raw_data_source with the following formula:
=OFFSET(RawData!$A$1, 0, 0, COUNTA(RawData!$A:$A), COUNTA(RawData!$1:$1))
The reason for creating a dynamic range was that the size (number of rows) of the dataset was different in different CSV files, and I wanted to use the entire dataset as source of the pivot table.
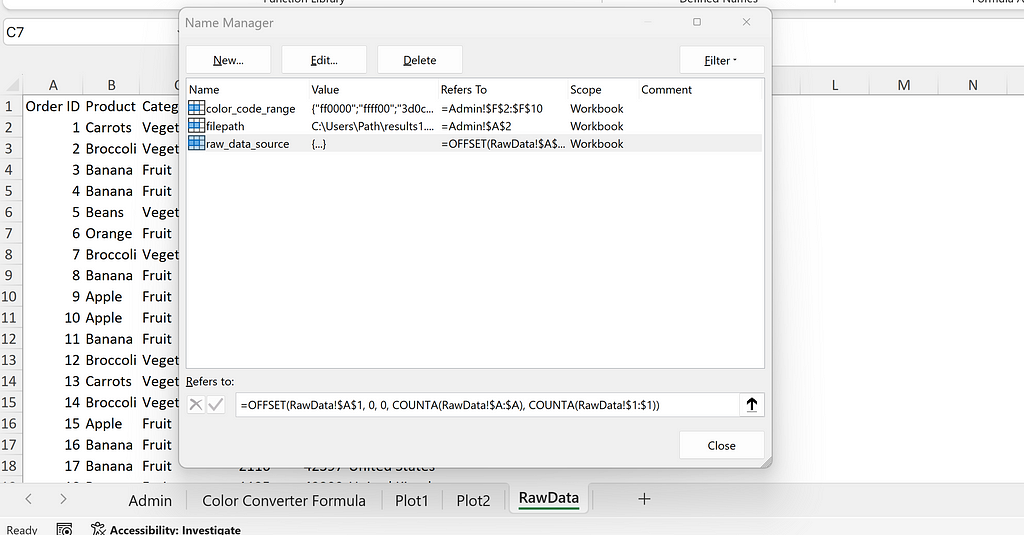
The dataset in the raw_data_source range in the RawData sheet was used as a data source to create two simple pivot tables and charts.
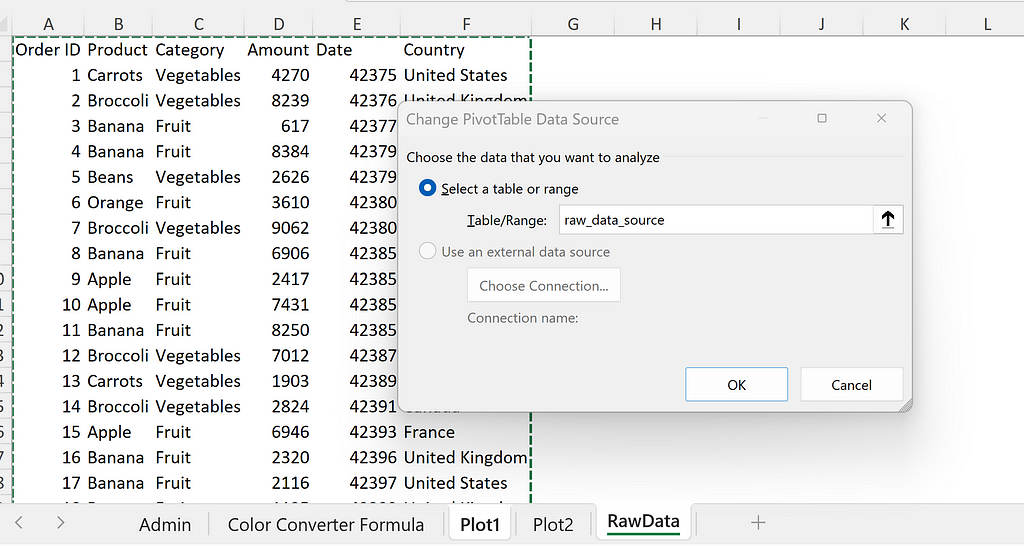
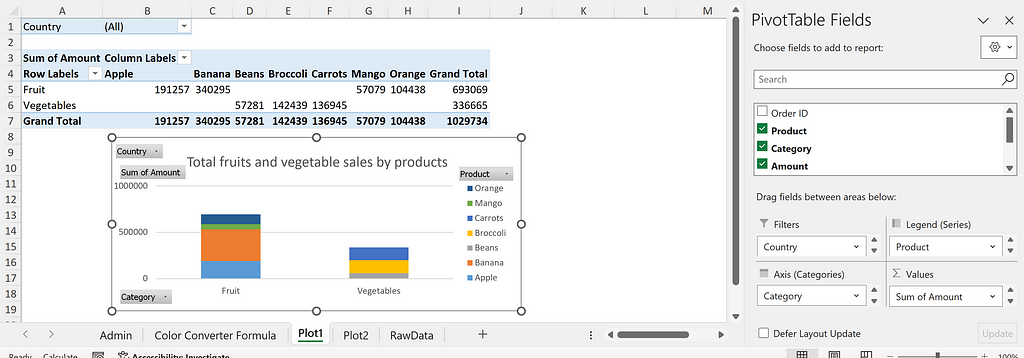
The first one portrayed total fruits and vegetable sales by individual products filterable by country with the field settings as shown.
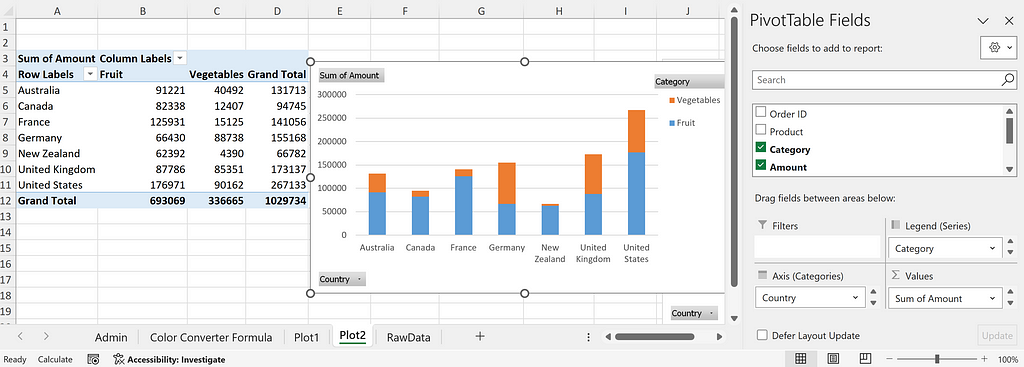
The second one portrayed total fruit and vegetable sales by countries.
In this step, I wanted to automate the refreshing of the datasets from the file I specified. I created a placeholder in the Admin sheet to place the path of the CSV data whose dataset I wanted to pull and refresh the pivot tables with. I named the cell A2 as filepath as shown below:
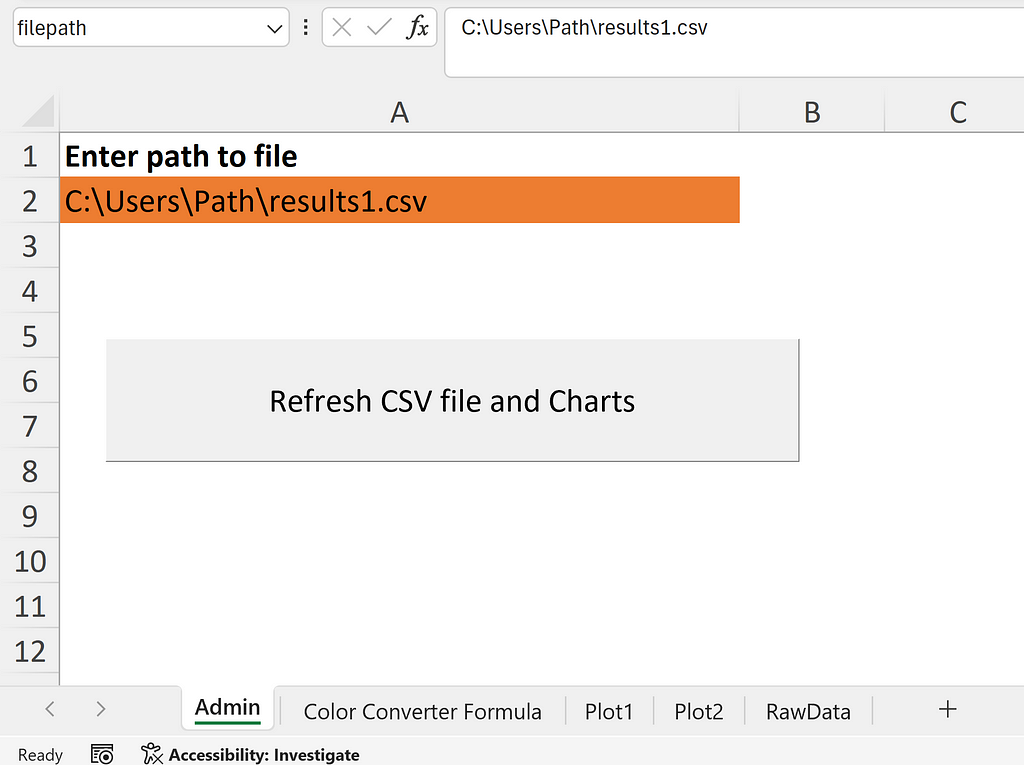
The code for this step is given below in the UpdateRawData subroutine. I declared the variables wb, ws_admin, ws_rawdata, and filepath for the names of the workbook, Admin sheet, RawData sheet, and path of the file containing the dataset respectively. First I cleared the contents of the RawData sheet. Then I went to the source workbook based on the filename, selected the corresponding sheet, copied its contents, returned to the ws_rawdata sheet, and pasted the contents as values. Finally, I refreshed the workbook using the code wb.RefreshAll that refreshed the entire workbook including the sheets with the pivot table and chart respectively.
Sub UpdateRawData()

Dim wb As Workbook
Dim ws_admin As Worksheet
Dim ws_rawdata As Worksheet
Dim filepath As String

Set wb = ThisWorkbook
Set ws_admin = wb.Worksheets(“Admin”)
Set ws_rawdata = wb.Worksheets(“RawData”)

'Clear Rawdata sheet
ws_rawdata.Activate
Cells.Clear

'get file path
filepath = ws_admin.Range(“filepath”)

Application.DisplayAlerts = False

'Open source file and select all contents
Dim src_wb As Workbook
Dim src_ws As Worksheet

Set src_wb = Workbooks.Open(filepath)
Set src_ws = src_wb.Sheets(1)
src_ws.UsedRange.Select

'Copy all
Selection.Copy

'Paste all
ws_rawdata.Range(“A1”).PasteSpecial xlPasteValues

'Close source file
src_wb.Close SaveChanges:=False

wb.RefreshAll

Application.DisplayAlerts = True

End Sub
I linked this subroutine to the Refresh files and charts button. Once I specified the filename in the placeholder and clicked on the button, the dataset and pivot tables were updated automatically.
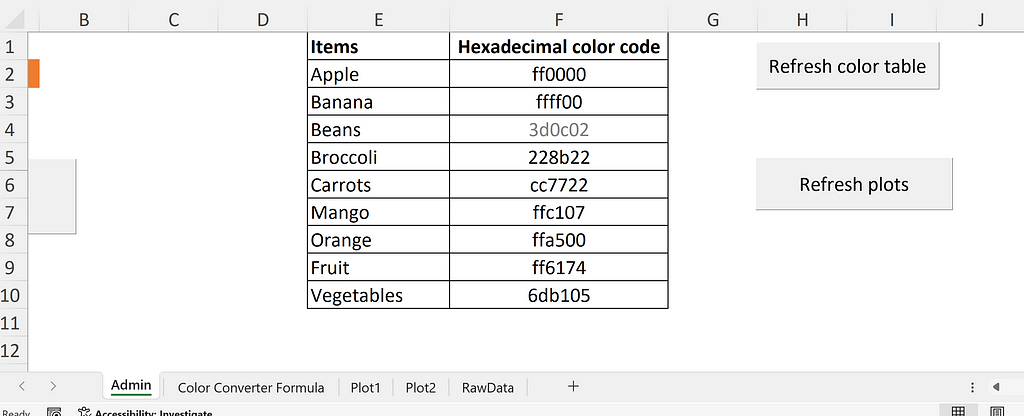
I created a table in the Admin sheet containing the list of the specific fruits and vegetables available in the dataset. In column F, I specified the tentative hexadecimal color codes for the color of each fruit or vegetable. I wanted to use these colors to update the colors in pivot charts. First, I wanted to paint column F with the color I specified in each cell.
The hexadecimal code for each color is a 6-digit hexadecimal number (0 to 9 or A to F) with base 16. In a hexadecimal color code RRGGBB, each pair of two letters represents the various shades of red, green, and blue color. In a Red Green Blue (RGB) system, the value of each shade ranges from 0 to 255.
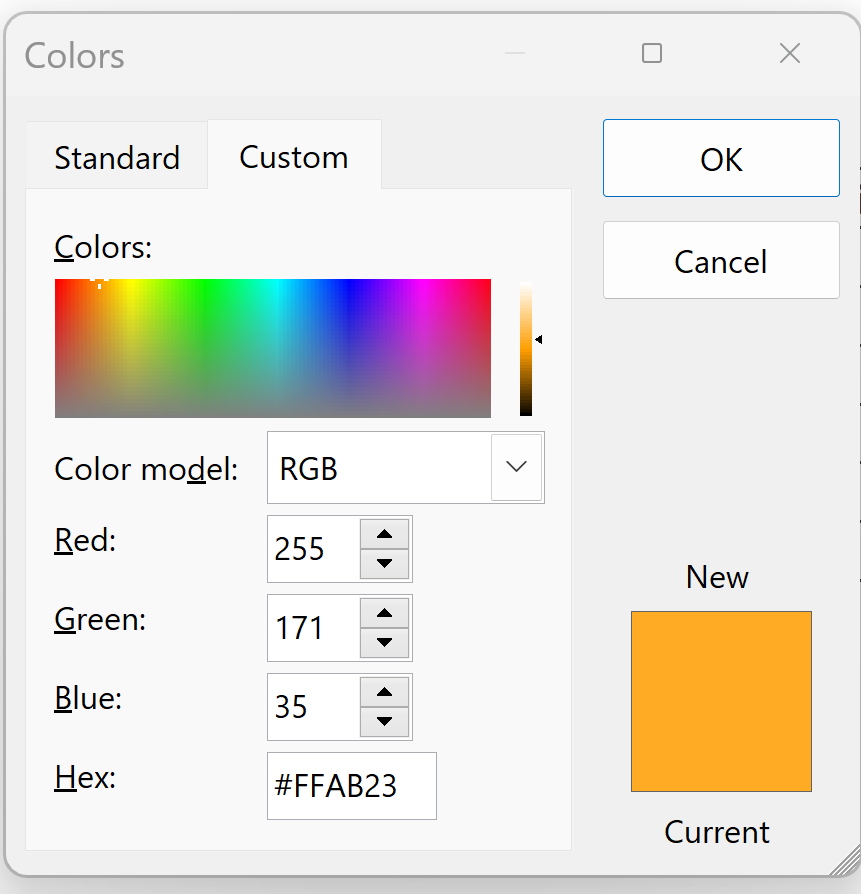
For example, for a hexadecimal color code ffab23, I calculated the corresponding RGB code with the following calculation. ffab23 in the hexadecimal system translates to (255, 171, 35) in the RGB system referring to the Red, Green, and Blue color components respectively.
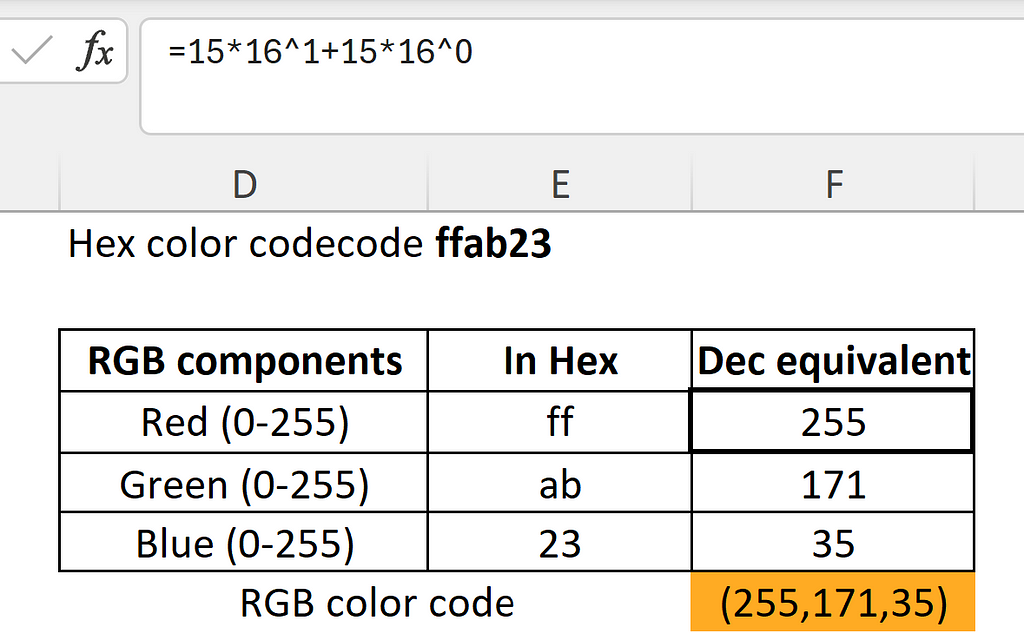
This can also be visualized by going to the Custom Colors option in Excel as shown below:
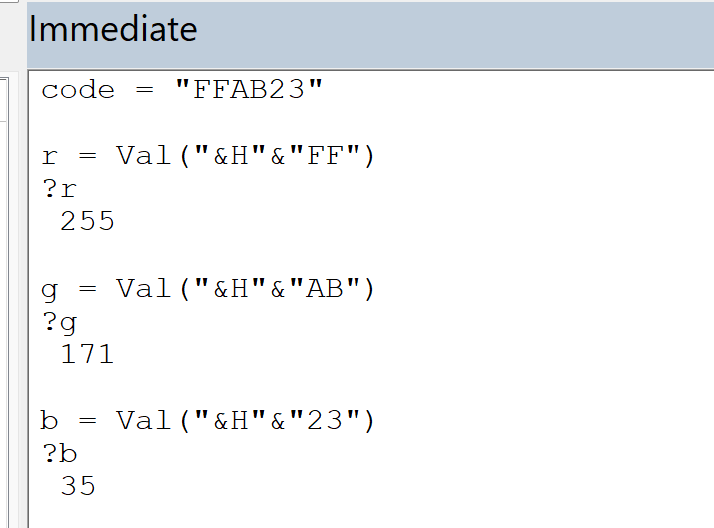
In Excel VBA, using &H in combination with a value implies that it is a hexadecimal number and the Val() function returns the corresponding decimal number. In the Immediate Window below, r, g, and b represent the corresponding decimal values for each shade of Red, Green, and Blue respectively.
In the code below, I created a named range color_code_range for the table containing the hexadecimal color code for each fruit or vegetable. I looped through each cell in the selection, derived the red, green, and blue components in decimal numbers, and painted the interior of the cell with the same RGB color code.
Sub refresh_color_table()

Dim wb As Workbook
Dim ws_admin As Worksheet

Set wb = ThisWorkbook
Set ws_admin = wb.Sheets(“Admin”)
ws_admin.Range("color_code_range").Select

Dim c As Range
Dim r, g, b As Long
Dim Hex As String

For Each c In Selection

     Hex = c.Value

     r = Val("&H" & Mid(Hex, 1, 2))
     g = Val("&H" & Mid(Hex, 3, 2))
     b = Val("&H" & Mid(Hex, 5, 2))
     c.Interior.Color = RGB(r, g, b)

Next c

End Sub
When I ran the above subroutine, the column F gets painted with the same color as the color code as shown:
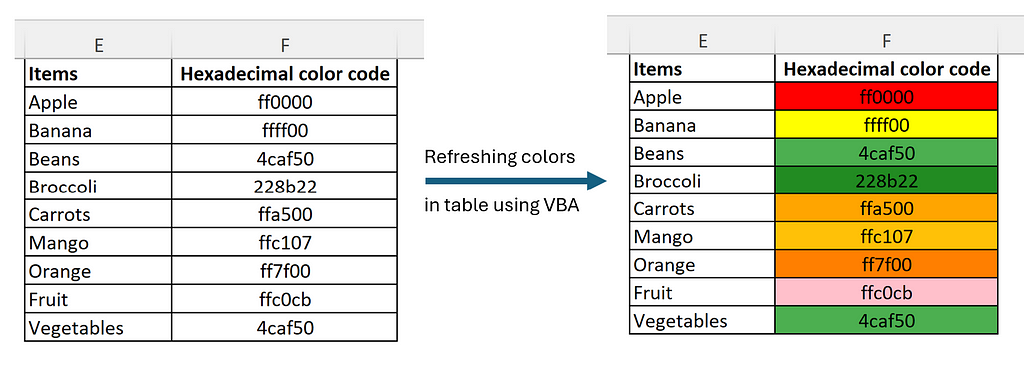
If the color code is changed, and the code is run again, it will generate new colors in the table. Isn’t that cool?
In the next step, I wanted to assign the colors in the pivot charts based on the custom colors I chose above. For this purpose, I created a dictionary containing the product name as keys and the corresponding hexadecimal color codes as values.
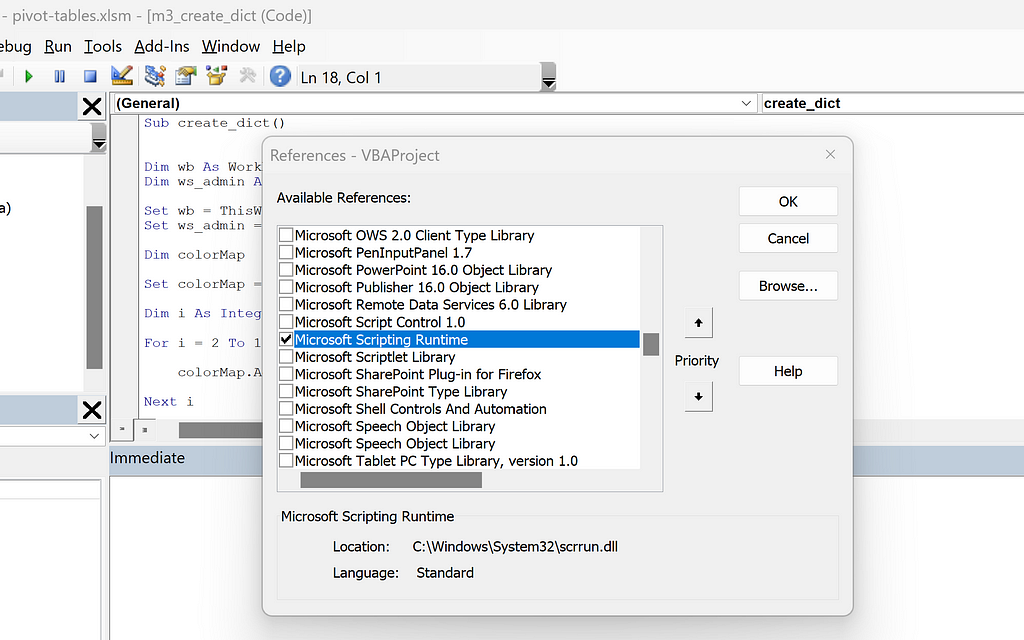
The pre-requisite for creating a dictionary object in VBA is to activate the Microsoft Scripting Runtime beforehand. For this, you can go to Tools -> References -> Check the box next to Microsoft Scripting Runtime and click on ok.
In the code below, I created a dictionary object called colorMap. I looped through the Range E2:F10 in the Admin sheet. I added the contents in column E as keys, and the contents in column F as their corresponding values.
Sub create_dict()

Dim wb As Workbook
Dim ws_admin As Worksheet

Set wb = ThisWorkbook
Set ws_admin = wb.Sheets(“Admin”)

Dim colorMap As Dictionary
Set colorMap = New Dictionary

Dim i As Integer

For i = 2 To 10
    If Not colorMap.Exists(Range("E" & i).Value) Then
        colorMap.Add Range("E" & i).Value, Range("F" & i).Value
    End If
Next i

For Each Key In colorMap.Keys()
     Debug.Print Key & ": " & colorMap(Key)
Next Key

End Sub
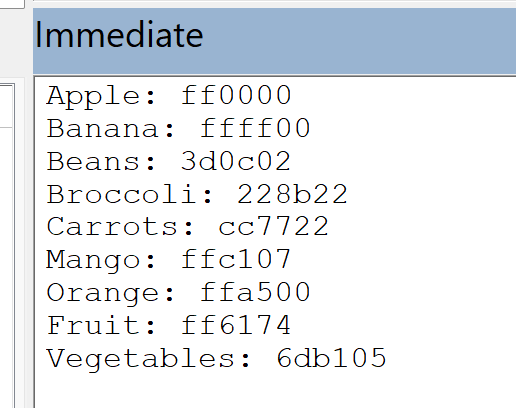
In the second for loop above, I looped through each key of the colorMap dictionary and printed the keys and values in the immediate window as shown below:
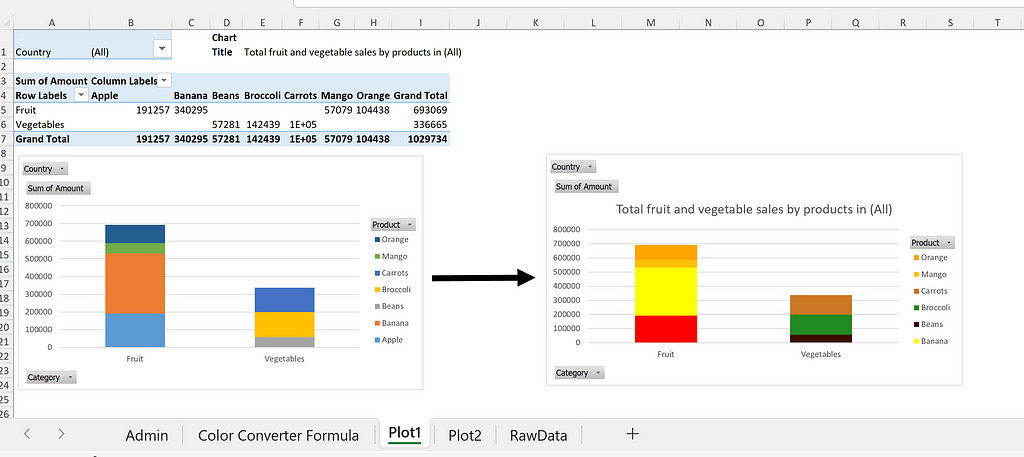
Based on the learnings from the previous steps, I wanted to go one step further and update the pivot chart elements using VBA. In this case, I wanted to set the chart title automatically based on a cell value and apply the colors of specific fruits and vegetables defined in the Admin sheet to the pivot charts.
In this step, I assigned Plot1 and Plot2 sheets as an array called sheetNames. I declared chartObj as ChartObject. Within each sheet, I looped through each ChartObject among all ChartObjects.
Note: ChartObject acts as a container for a Chart object in VBA that controls the size and appearance of the embedded chart in a worksheet. It is a member of the ChartObjects collection. It is important to understand the differences in the methods and properties of each of these objects in VBA.
After going through each chartObj, I set the title for each chart based on the value in cell E1. Next, I looped through each series in the overall Series Collection of the Chart object. I assigned the series name (i.e., name of fruit or vegetable) to a variable called itemName, and got the corresponding color code from the colorMap dictionary. Similar to step 2, I got the red, green, and blue components of the color code in decimal numbers, and filled the series bar with the RGB colors.
Sub refresh_plots()

Dim wb As Workbook
Dim ws_admin As Worksheet
Dim ws As Worksheet

Set wb = ThisWorkbook
Set ws_admin = wb.Sheets("Admin")

Dim colorMap
Set colorMap = CreateObject("Scripting.Dictionary")
Dim i As Integer

For i = 2 To 10
     If Not colorMap.Exists(Range("E" & i).Value) Then
          colorMap.Add Range("E" & i).Value, Range("F" & i).Value
     End If
Next i

Dim sheetNames As Variant
Dim sheetName As Variant
sheetNames = Array("Plot1", "Plot2")

Dim hex_color_code As String
Dim r, g, b As Integer

Dim chartObj As ChartObject

For Each sheetName In sheetNames
     Set ws = wb.Sheets(sheetName)

     For Each chartObj In ws.ChartObjects

          chartObj.Chart.HasTitle = True
          chartObj.Chart.ChartTitle.Text = ws.Range("E1").Value

          For Each Series In chartObj.Chart.SeriesCollection

               itemName = Series.Name
               hex_color_code = colorMap(itemName)

               r = Val("&H" & Mid(hex_color_code, 1, 2))
               g = Val("&H" & Mid(hex_color_code, 3, 2))
               b = Val("&H" & Mid(hex_color_code, 5, 2))
               Series.Format.Fill.ForeColor.RGB = RGB(r, g, b)

          Next Series
     Next chartObj
Next sheetName

End Sub
An illustration of the use of this code is depicted below.
In this post, I illustrated how one can customize and automate working with pivot tables and charts using VBA. I have demonstrated the automation of four key tasks: refreshing pivot tables and charts with new datasets; creating color tables based on hexadecimal color code; how to work with dictionaries in VBA; and managing and updating pivot chart elements using VBA. In the second step, I have elaborated the conversion of hexadecimal color codes to the corresponding RGB color codes using both Excel and VBA, and used this technique in the subsequent steps.
The code and Excel file for this post are present in this GitHub repository. Thank you for reading!
Managing Pivot Table and Excel Charts with VBA was originally published in Towards Data Science on Medium, where people are continuing the conversation by highlighting and responding to this story.
Originally appeared here:
Managing Pivot Table and Excel Charts with VBA
Go Here to Read this Fast! Managing Pivot Table and Excel Charts with VBA


Historical records of the UEFA European Championship results
Originally appeared here:
UEFA Euro 2024 Map


Step-by-Step Integration of AI Chatbots into Shiny for Python Applications: From API Setup to User Interaction.
Originally appeared here:
Incorporate an LLM Chatbot into Your Web Application with OpenAI, Python, and Shiny

Originally appeared here:
Improving air quality with generative AI
Go Here to Read this Fast! Improving air quality with generative AI

Originally appeared here:
Use zero-shot large language models on Amazon Bedrock for custom named entity recognition

Originally appeared here:
Safeguard a generative AI travel agent with prompt engineering and Guardrails for Amazon Bedrock