How to correctly measure sales performance and identify opportunities to enhance sales strategy
Image generated with DALL-E
Throughout my career, I have collaborated with numerous companies that believed they had a clear understanding of which sales agents were their top performers and which ones were underperforming.
However, I can state that 9 out of 10 were wrong.
They were misled for years due to one simple reason: they measured sales performance incorrectly.
I can also guarantee that 100% of them, after learning the correct way to measure sales performance, theyhave completely changed their approach and have never measured it the same way again.
Moreover, some of them have even modified their bonus compensation based on this new method of calculating sales performance.
But, what were they getting wrong?
Let’s see it with a clear example:
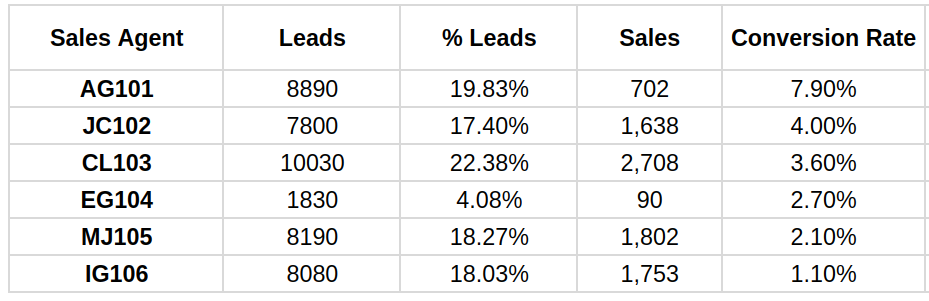
The table shows the annual summary of leads handled, sales, and conversion for each sales agent of a B2C company that sell a single type of product.
Faced with these results, I have typically encountered two types of interpretation:
Those who consider the best agent to be “CL103.” This interpretation is based on the absolute number of sales or revenue (2,708 total sales). And while estimating sales performance by revenue is what intuition first tells us, this way of measuring is biased. The problem is that this agent has managed a larger number of leads. Therefore, having had access to more potential customers and having worked more, he has undoubtedly had more opportunities than the others, and thus, it is normal that he has converted more.
Those who consider the best agent to be “AG101.” This interpretation is based on conversion rate (7.90%). In this case, the previous bias is normalized. Conversion rate compares the agents’ ability to generate sales, regardless of the number of leads each agent has received. In other words, it evaluates the transformation of leads into sales, regardless of the initial absolute number of leads, providing a more equitable view of each agent’s performance. However, as we see, agent “AG101” has provided less absolute sales. Sometimes, agents with a less volume of leads can focus on converting them and provide better service, but in that case, the owner AG101 has the aproximately the same volume as MJ105 or IG105, and significantly overperforms them.
What if I told you that neither of these criteria is really optimal? Is it possible that they are overlooking something?
The answer is YES. They are overlooking a very relevant factor: the quality of the leads received.
Lead Quality
Is it fair to evaluate in the same way a sales agent who receives leads with high interest in the product, compared to another who receives leads with low interest?
Obviously, it would not.
Agents who handle highly qualified willing-to-buy leads will naturally have better results in terms of sales and conversion, compared to those who receive leads that require more effort and time to convert.
By not considering the quality of the leads in our analysis, we are evaluating sales agents with a limited approach.
Leads with a higher probability to convert are an easier task than those with lower probability. Therefore, to obtain a fairer and more accurate evaluation of agents’ performance, it is necessary to consider the quality of the leads in the analysis as a grade of difficulty of the work performed.
This involves adding a measure of the level of interest of leads, i.e., their probability of conversion before assigning them to the agents. In this way, the performance metrics can be adjusted according to the level of effort required by each agent.
For this client, I implemented a Lead Scoring system with byRatings, based on a Machine Learning prediction model that measured the quality of the leads at the moment of their generation. This allows for an accurate comparison of lead quality at the same temporal instant.
Lead Scoring models provide the likelihood of conversion to sale for each lead. So the average Lead Score of an agent represents the expected Conversion Rate for this agent.
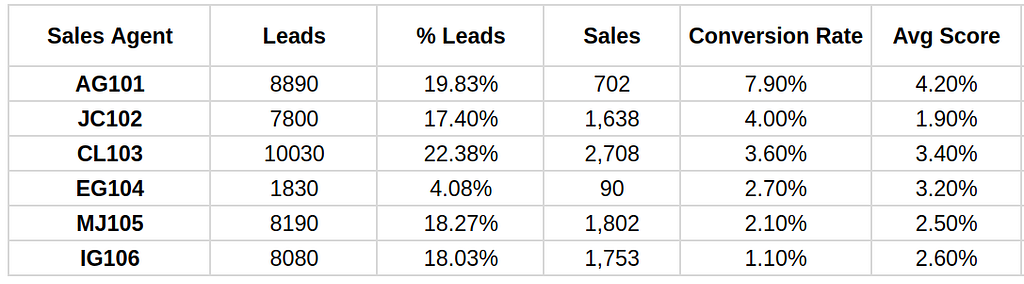
Let’s look at the results by adding the “Average Score” or average conversion probability of the leads received by each agent.
As we can see, the quality of the leads is a determining factor in the conversion rate. Agents like “AG101”, who we saw had the highest conversion rate, also received the highest quality leads.
Then, Average Score demonstate to be a relevant factor to consider in order to fairly compare lead assignation.
So, how can we measure sales efficiency?
Performance Ratio, the Ultimate Sales Performance Metric
As discussed above, to fairly and accurately evaluate the performance of sales agents, it is crucial to consider both the agents’ conversion rate and the quality of the leads.
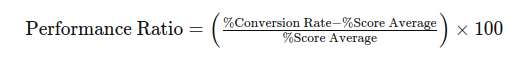
A good way to calculate it is using the following formula:
This formula calculates the performance ratio, which measures the difference between the conversion rate and the average score in relation to the average score, expressed as a percentage.
A positive ratio indicates the agent is performing better than the expected conversion, while a negative ratio indicates underperformance.
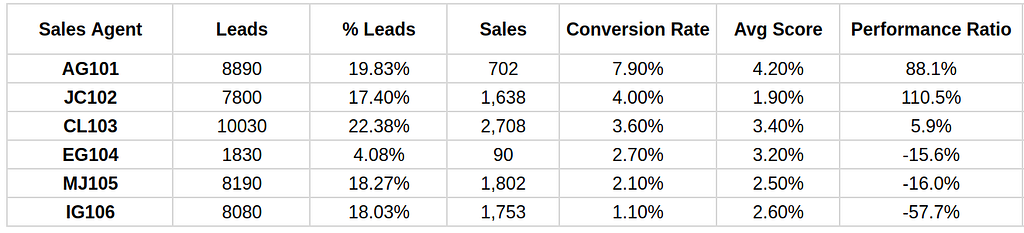
Let’s look at the results again including the Performance Ratio:
The sales owner “JC102”has the highest performance ratio (110.5%), indicating that significantly outperform the average lead quality received. Despite having an average score of 1.90%, achieves a 4.00% conversion rate, showing exceptional efficiency in converting lower-quality leads into sales.
On the other hand, the sales owner “IG106” has a -57.7% indicating that even receiving leads with 2.60% of expected conversion, its perfomance is underperformed.
Final Notes
In conclusion, the performance ratio is the fairest way to measure sales performance, providing a definition of how well a sales agent converts leads relative to the average quality of those leads.
But… let’s aim for top honors.
Having a Lead Scoring model that provides the quality of leads received, can we improve the overall conversion by redistributing assignation?
For several years, I had the following hypothesis:
Byproviding the best leads to the best-performing agents, the overall conversion will increase.
This makes a lot of sense, because it’s likely that some opportunities are lost due to assigning good leads to agents who are less qualified or have lower sales performance.
I was repeating myself that this was the best approach, but lately I realize that I’ve also missed something.
My hypothesis was based on best agents convert best qualified leads. But, Is that true?
Let’s validate it.
One effective way to do it is by calculating the Performance Ratio on the Best Leads. Assuming that the Best Leads are the top 30% scored leads , which in that use case they had a Conversion Lift of 3.5x over the average, let’s calculate the Performance Ratio for this particular segment.
The formula is as follows:
Adding this calculation to the table, the results were as follows:
Again, JC102, who is the best agent converting overall leads (110.5% Performance Ratio), demonstrates to be also the best agent at converting the best leads (64.1% Performance Ratio of Best Leads), as we assumed in the hypothesis.
This confirm that, in this particular case, the best agent is the best converting the best leads.
However, note that the assumption is not linearly correlated for all agents.
Although “AG101” shows a strong overall performance ratio (88.1%), the negative performance ratio on the best leads (-28.8%) suggests that AG101 may not be leveraging the best leads as effectively as expected. This could indicate that AG101 could be speciallized on some sort of leads, but not necessarily the best ones.
In fact, CL103, which has a 17.7% of Performance Ratio of Best Leads, can be even a better agent to convert Best Leads than AG101 (-28.8%), although having a lower overall Performance Ratio (5.9%) than AG101 (88.1%).
Not every good agent performs well with the best leads
For those experts on sales strategy, I like you to consider that there is an even better approach to optimize the assignment, which involves evaluating each lead individually and assigning it to the agent who has the highest probability of converting it.
However, as it’s observed in the table above, in general terms the best agents handle the best leads better than the worst agents, making it a good starting point.
Further posts?
In conclusion, assigning the best leads to the best-performing agent can be a good baseline for optimizing lead allocation.
Additionally, adopting a specific agent assignment algorithm would be the most effective strategy in order to fully maximize conversion.
This can serve as an introduction to another important topic: “How to Develop the Ultimate Optimization Algorithm for Lead Assignment”.
Under such an algorithm, each lead would be assigned to the agent who can derive the greatest performance from it, i.e., who can achieve the highest conversion margin relative to the expected conversion (probability) of the lead before assignment.
In a future post, I will go into more detail about lead allocation optimization for maximizing conversion rates.
If you found this post insightful, stay tuned for more on this subject.
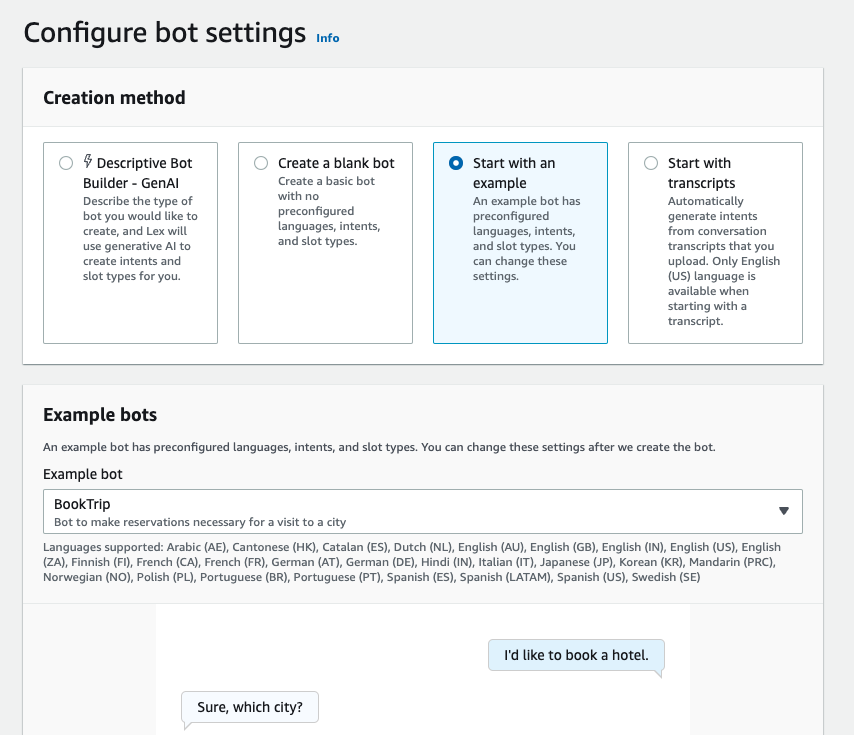
This post is a continuation of Creating Natural Conversations with Amazon Lex QnAIntent and Amazon Bedrock Knowledge Base. In summary, we explored new capabilities available through Amazon Lex QnAIntent, powered by Amazon Bedrock, that enable you to harness natural language understanding and your own knowledge repositories to provide real-time, conversational experiences. In many cases, Amazon […]
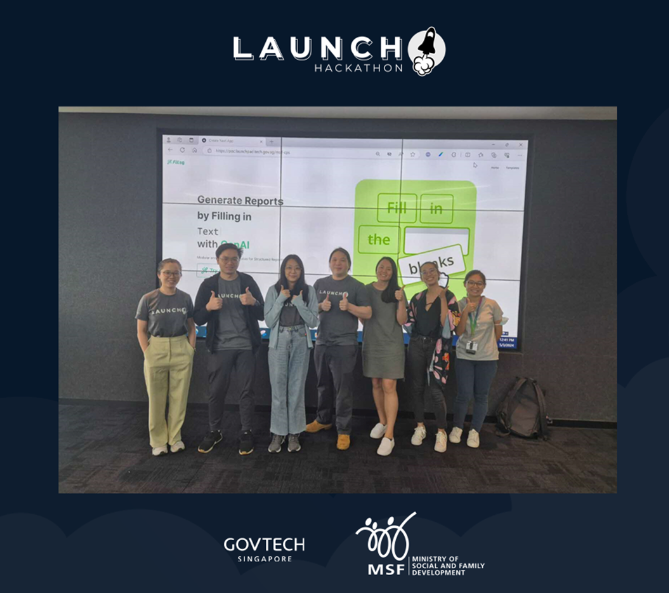
The dream team. (from left) Hackathon Team: Li Shing, James, Nicole, Gawain. Problem Owners: Alexia, Joy. GovTech FDT: Xuean, Image by Authors
We are a team from the Ministry of Social and Family Development (MSF) and GovTech’s Data Science and AI Division. United by the cause of the problem statement to make report writing easier and less time consuming, we teamed up to build Fill.sg from ideation to prototyping. Within just two weeks, we conducted user discovery, built a prototype, and gathered preliminary user feedback to determine the feasibility of the solution. This article shares our journey through the first LAUNCH! Hackathon Sprint in April 2024 and our approach to developing the solution.
Problem statement
Background
When ChatGPT first debuted, it opened our eyes to the potential of an intelligent chatbot, far beyond anything we had seen before. This breakthrough sparked our imaginations, inspiring us to explore solutions to solve problems that gradually expanded from recipe creations to tough enterprise use cases across different domains and their business functions.
Similarly, there is a strong desire from agencies in the Singapore Government to leverage AI to better serve citizens and public servants. We have seen over 400 diverse ideas contributed in a short span of 12 months. These ideas stem from long-established pain points, and AI has opened possibilities to solve them. These pain points were diverse with their own unique challenges. At GovTech, we do our best to take a stab at as many problem statements within the periphery as possible — using the concept of ‘problem space’.
Why did we choose to tackle the problem space of report writing?
One key problem space that caught our attention was how we could support officers to draft reports in a more efficient manner. Writing reports is an integral part of our roles as public service officers — from simpler ones like meeting minutes to more complex ones like economic reports and court reports. While our intention was not to use AI to replace decision-making tasks requiring professional judgement and assessment, we saw potential in leveraging AI to synthesise and organise information for report writing. Complex reports can take hours, maybe days, and require synthesising myriads of information from various sources including graphs, texts, excel spreadsheets, etc. The same report type is usually written multiple times with the same format for different cases, which can start to get mundane very quickly. Certainly, a templating tool that can help draft even 50% of repetitive reports would be a substantial time saver for public officers, freeing up their time by allowing them to vet and amend reports to ensure accuracy rather than drafting them from scratch, so they may focus on more important tasks.
However, this is a difficult and complicated problem space — specifically, how do we abstract the methods to take in sources of information with various lengths, instruct Large Language Models (LLMs) to extract the crucial details, and generate relevant outputs? Each step is crucial to produce a quality report grounded with the right context.
With this in mind, we started our two-week journey of making report writing less onerous. Our goal was to relieve officers from time-consuming administrative tasks, so that they could focus on engaging and providing support to citizens.
Our Solution
Introducing Fill.sg and What It Offers
Landing Page, Image by Authors
Fill.sg is a web application that helps you fulFILL your dreams of making report writing simpler, easier, and faster by having AI generate reports for you, so you can focus on more important tasks.
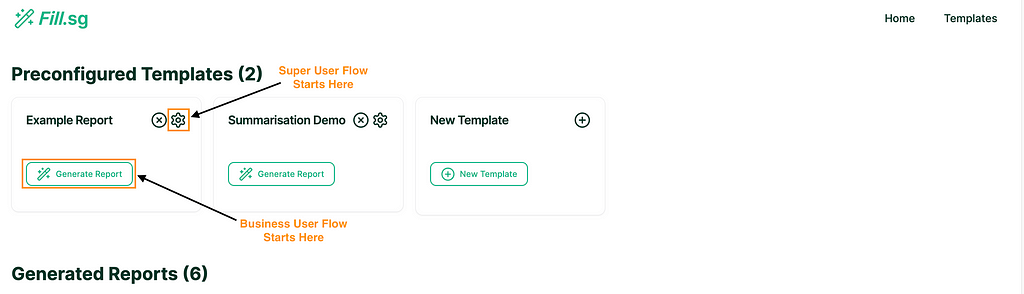
Business User Flow
Fill.sg provides an interface for business users to curate Modular and Versatile Templates for Generation of Structured Reports. In gist, users can select a previously defined Template, upload multiple unstructured or structured text documents as Context for the report, and voila, a full report can be generated without touching the keyboard. The report can even be exported to Microsoft Word with the formatting of headings and tables intact.
A single Template created in Fill.sg can be reused to generate multiple reports with the same structure. For instance, a Company Report Template can be reused for generating reports about Company A, B, C, and so on using different Context provided.
Business User Flow (examples are for illustrative purposes only.), Image by Authors
In the demonstration above, the user is able to upload documents and use those documents as Context to generate a report. The AI behind the scenes will take these Context documents and use them to generate a bespoke report based on the Template. Once generated, users can download it as a Word document (.docx), which preserves the headings and table formatting.
Super User Flow
Super users are users with both the technical and domain knowledge required to understand how to prompt the LLM correctly to fill in each section of the report Template. These super users play a crucial role for the success of the tool, as they have enough domain knowledge, and technical expertise on prompt engineering to instruct LLM in filling each section of the report Template.
Super users can go into edit mode, where they can edit the structure of Templates and add new generation blocks. Each generation block is intended to fill up a particular section of a report. Once a Template is created and saved, business users will be able to use the curated template to generate multiple reports of the same structure.
Super User Flow (examples are for illustrative purposes only), Image by Authors
In the above demo, the super user first uploads a set of example Context documents, which are used for previewing the template generation. They then go to the editor panel to edit the Template. For each new section of the report, the user adds a new generation block, where they are able to configure the generation settings and instruct the template on what should be generated for the section. Once the generation settings are saved, the LLM generates a sample result based on the example Context documents, and the super user is able to verify the preview of the generation. Once the super user is satisfied with the template, they can then save it and make it available for business users to use.
Having simple, modular, and editable templates allows agency users to be self-reliant when using the tool, as they can create and modify templates to adapt to ever-changing business needs.
Prompts Behind Fill.sg
Breakthrough in LLMs: Long-context models
In the past few months, the context window size of leading LLMs has been rapidly increasing. For example, OpenAI’s GPT-4-Turbo has a context window of 128,000 tokens, which is approximately 400% of its predecessor, GPT-4–32k. The term ‘context window’ refers to the number of tokens that the LLM can consider when generating a response.
Having a longer context window, therefore, means more information can be provided to the LLM via the prompt and is often indicative of the semantic capability of the LLM in managing more tokens.
This capability solves some of the teething challenges of an RAG workflow. Instead of optimising chunking, search, and retrieval strategies, we can use in-context prompting and instruct the LLM to take reference from relevant sources accordingly. For example, we could feed the entire input document(s) to the LLM, instruct it to focus on specific sections, and provide an output (whether it is in bullet points, a paragraph, or a table) based on the context that we had given an instruction to.
Our Prompting Approach
For this use case, we leverage this in our solution by feeding more relevant information, including entire documents, in the prompt. In our experimentations, this method has shown to be effective, based on the assumption that the input document(s) are relevant to each report.
Throughout the 2 weeks, we took an iterative prompt engineering approach to write, evaluate, and refine prompts:
Write the initial prompt making use of system, user, and/or assistant roles when outlining the task definition and context needed to serve as a starting point.
Evaluate the LLM’s responses against expected outputs using consistent success criteria, whether through human evaluation or self-evaluation like in the LLM-as-a-Judge approach.
Based on the evaluation results, refine the prompt to improve the performance such as by adding clarifications or constraints in steering the LLM’s responses
Our crucial success criteria in evaluation is the ability to generalise across various report sections and formats, in order to allow the generation of paragraphs, tables, bullet points, and even constrained choices to meet the needs of a typical report.
The prompts that we have crafted serve as the base to abstract away the challenges in prompt engineering and allow for domain-specific inputs from our end-users. This means users of Fill.sg simply focus on providing domain-specific information such as the title and description of a particular report section instead of worrying about the nitty-gritty of prompt engineering.
Report Generation: Divide and Conquer
Problems with Single Prompt Generation
For anyone who has attempted to generate a full report using a single prompt with an LLM, you would know that it usually does not turn out too well; outputs tend to be short, and hallucinations start to pop up after the third paragraph, and the later sections where you explicitly required tables are instead populated by walls of text.
This happens because LLMs generally are not trained for generating extremely long reports requiring multiple formats, i.e., tables, texts, or bullet points within a single response. We have seen LLMs perform better when asked to perform one task and one type of output at a time, not multiple tasks at once and certainly not different formats within the same output.
Smaller but Many Modular Prompts can be Advantageous
In software engineering, it is good practice to decompose complex systems into modular components. We found this principle to be equally effective when applied to tasks given to a LLM.
To ameliorate the issues with instructing the LLM to generate a full report within a single prompt, we studied closely how reports are written to see how we can decompose this complex task. We observed a trend — most standard reports tend to have sections where each section describes a specific topic and usually consists of a single format. This can be used to our advantage as we can break down the complex task of writing a full report into individual, smaller tasks — to write specific sections with specific output expectations.
Task decomposition via a section-level generation can help the model produce better outputs as each section can be assigned as single tasks, and localised context can be injected into the prompt for each section to give clearer instructions for the LLM to better understand its objectives. Furthermore, we can specify expected types for each generated section, which allows us to steer the generation and validate output formats more effectively.
Besides the benefits of structured modular prompts in generating higher quality content, the power of modular prompting also lies in allowing easy writing, modification and debugging. Not only does modular prompting help to provide clearer and better instructions to the LLM, it also helps developers in the iterative development of prompts.
Generations Blocks and Generation Types
In our application, we term these sections where each generation task occurs as Generation Blocks. These Generation Blocks are set with a specific generation type so that we can enforce certain constraints on the outputs generated by the model.
In our case, we settled on a few generation types to implement for the hackathon:
Long Text Generation: Long paragraphs of text
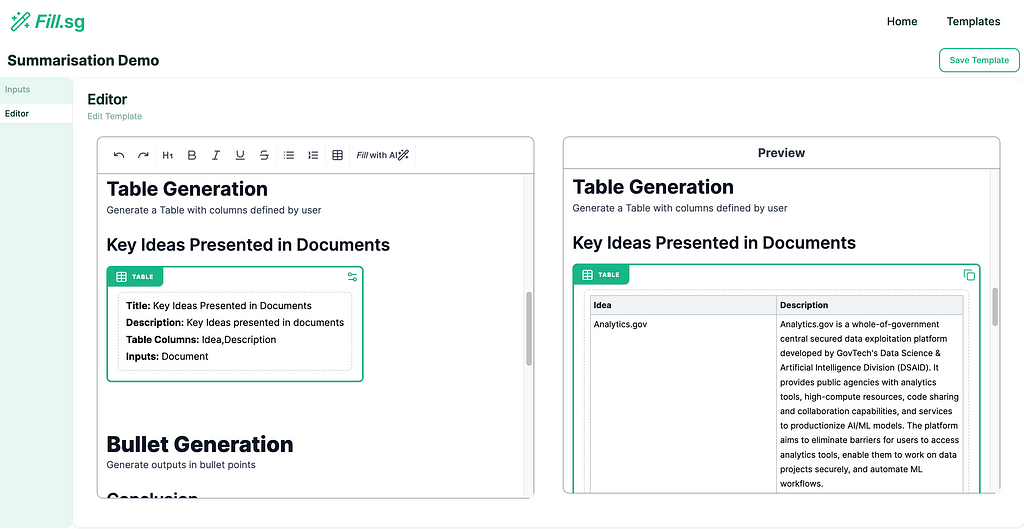
Table Generation: Outputs in tabular formats with columns specified by settings
Bullet Points Generation: Output generated in Bullet Point form
Selection Generation: Outputs the most suitable value chosen from a pre-set list of values defined by the user
The following are demos for each Generation Type. As seen below, the app allows users to edit contents easily with pre-configured settings based on the requirements of the report.
Long Text Generation
Long Text Generation (examples are for illustrative purposes only), Image by Authors
Table Generation
Table Generation (examples are for illustrative purposes only), Image by Authors
Bullet Points Generation
Bullet Points Generation (examples are for illustrative purposes only), Image by Authors
Selection Generation
Selection Generation (examples are for illustrative purposes only), Image by Authors
UI/UX Considerations for a User-Friendly GenAI Tool
Building an inclusive AI tool
One of the most important lessons happened during our first user interview. We received good feedback from the super users who were able to follow through with our initial proposed flow of customising templates very quickly. As we presented the ideas, they were also coming up with new ideas on how to improve the tool. However, we noticed that business users would much prefer to get their jobs of churning out reports done easily, without the need to customise any templates.
This taught us that even though technology may be powerful enough to solve the problem, we need to design a tool for users with different backgrounds and technical affinity to AI. So, we iterated Fill.sg and built it with 2 personas in mind — Super Users and Business Users.
User Flow Segregation (examples are for illustrative purposes only), Image by Authors
Bespoke Interface for Editing and Reviewing
The purpose of Fill.sg is to reduce the time needed to write reports while balancing the need to ensure the responsibility of users in using any content created. So, we want to retain the mechanisms for users to have control within the workflow. Users need to ensure the AI-generated content is dutifully reviewed and checked for mistakes. Hence, with AI safety in mind, we made the editing and reviewing experience as smooth as possible. We furnished the application with a proper WYSIWYG editor, Tiptap, to provide a bespoke Graphical User Interface to interact with the AI in a more human-friendly way.
With the current available tools, users will typically use a chat interface for report writing. There are several pain points from this experience:
The sequential format makes it hard to prompt the LLM in parallel, meaning users have to wait for an output before sending the next query.
A great deal of copy-pasting is required between the chat interface and the actual document.
Users are unable to reuse previous chats to generate the same structured reports.
Editor Interface, Image by Authors
Using an editor interface rather than a linear chat interface is beneficial as it solves all the aforementioned problems of the standard method.
Having a side-by-side Editor and Preview panel allows users to continuously edit the templates while the LLM generates the preview in parallel in the background. This means users do not need to wait for the LLM generation to continue editing the template.
Copy-pasting is no longer needed as the WYSIWYG editor can be directly exported to Word with the right setup. Users can edit directly in our application, then export the report directly to Word.
Report Templates can be saved and later reused by many downstream reports.
Tiptap is an excellent choice for this as it provides a multitude of quality-of-life features that we can make available to users to improve the user experience. Thus, reducing pain in curating and reading structured reports. Furthermore, it also opens up space for new improvements, such as providing multi-user collaboration and further customisations to improve the reading and writing experience.
Post-Hackathon: Potential for Future Development
Multimodal Inputs
At the time of writing, OpenAI recently released a series of exciting announcements on new models. In a 26-minute demonstration, OpenAI showed off GPT-4o (“o” for “omni”), which is a step towards much more natural human-computer interaction. This model accepts any combination of text, audio, image, and video as inputs and generates any combination of text, audio, and image as outputs. Crucially, since our approach on this use case is through in-context prompting, the enhanced tokeniser’s compression requires fewer tokens to process the same amount of information.
This is particularly exciting for our use case. As we know, writing reports requires a person to synthesise different inputs such as text, images/infographics, charts, and interview scripts. There were some limitations to LLMs on their context window, token limits, and format of inputs, which made building a generic solution for report writing a particularly difficult engineering feat.
Extension to Generation Types
While the basic Generation Types we have defined are quite substantial and can cater to most repetitive reports, there are still even more ways that the report writing process can be automated and even empowered. We also thought of other generation types that could potentially be implemented:
Chart Generation: Outputs a chart using a function caller agent
DataTable Generation: Outputs a data table with a specific aggregation
Temporal Generation: Outputs a date, time, or duration
Graph Generation: Outputs a graph that plots out relationships based on given context
These new extensions not only solve current-day report generation problems but could also potentially supercharge and change the way we write reports.
Conclusion
Through the LAUNCH! Hackathon, we developed Fill.sg — a web application powered by large language models to automate report writing. By allowing users to create reusable templates and generate reports from unstructured data sources, Fill.sg saves substantial time and effort for all report-writing public officers.
AI is advancing fast, but business logic is harder to change as it involves policy considerations. Given this, the general direction for this application would be to retain the business logic and user needs while building a flexible infrastructure and frontend experience that allows it to include possibilities from more powerful AI models and their peripheral tools.
Looking ahead, Fill.sg may take advantage of new developments in multimodal AI that can understand inputs beyond just text, such as images, audio, and video, potentially elevating the tool’s capabilities to unimaginable magnitudes.
Fill.sg represents a small step to achieve our ambitions of leveraging AI to generate our reports. We hope that our learnings and experiences from this prototype will encourage other enterprising developers in government to develop and integrate AI to better serve public officers and citizens.
How to be a part of LAUNCH!
LAUNCH! Is an innovation programme designed to transform great ideas into impactful solutions for the public sector. Spearheaded by GovTech in collaboration with various government agencies and esteemed industry partners like Microsoft, Amazon Web Services (AWS), and Databricks, LAUNCH! is a movement towards fostering a culture of innovation and collaboration across the public sector. Interested public officers may connect with the organisers at LAUNCH! to find out more about contributing an idea or running a localised hackathon within your team, division, function, or organisation. You may access the info site on LAUNCH! via https://go.gov.sg/govtech-launch.
Acknowledgments
A huge thank you to the Hackathon team who powered through the fulfilling 2 weeks: Chan Li Shing (Product Manager), Gawain Yeo (Business Owner), James Teo (Data Engineer) and Nicole Ren (Data Engineer) as well as our Users who have provided valuable feedback!
Special thanks to the following persons who has contributed to the article: Alexia Lee (MSF) | Chan Li Shing (GovTech) | Gawain Yeo (MSF) | James Teo (GovTech) | Lim Hock Chuan (GovTech) | Mindy Lim (GovTech) | Nicole Ren (GovTech) | Terrance Goh (MSF)
Manage Dev and Prod Using Terraform and Local yaml Files
Make your terraform spin in multiple projects using yaml
In a corporate production setting, typically cloud projects are split into development (dev) and production (prod) to segregate the two environments. As an engineer, it is important to be able to do the necessary testing and development in (dev) and move them into (prod) once approved, in a quick and efficient manner.
As expected, there are several solutions to do this, terragrunt is an immediate one that comes to mind. However, not everyone is familiar with terraform, much less terragrunt. How can I simplify this template to enable others in a team simply using terraform and yaml files? Here is my take on a simplified implementation.
1. Repository Structure
As a reference for this article, here was how i structured my repository.
.
├── environment            # Folder to contain both dev and prod yaml
│   ├── dev-config.yaml
│   └── prod-config.yaml
├── modules                # Folder to contain terraform code by services
│   ├── module1
│   │   └──main.tf
│   └── module2
│       └── main.tf
├── backend.tf             # backend file to configure terraform backend
├── locals.tf              # locals file to point to environment yaml
└── main.tf                # main file to point to modules
2. Create your terraform locals.tf
The locals.tf file is the default way terraform interacts with locally stored files. Your locals.tf should point to the terraform workspace that you would like to work in, this in turn will call the correct config file.
# Select the workspace
terraform workspace select dev
# This should run terraform plan against 'environment/dev-config.yaml' file
terraform plan
Using a local files that can be committed via git is much preferred over maintaining several .tfvars individually across several developers. Please take care not to commit sensitive information in the yaml file.
Also terraform does allow for other types of config files other than yaml, including json and text [see link].
2. Create configuration files for both dev and prod
In the environment directory, create your config files. Be sure in your naming that the name is also the same one as your terraform workspace as we will be using the variable `${terraform.workspace}` to differentiate between the two files.
I use module blocks to separate resources used. There is no strict rule as to what goes in a module, but I typically group resources that are spun up for the same service together (e.g. An airflow job that writes to a SQL table, or a VM and its associated load balancers).
The main thing here is that your modules point to a local.config in this case the yaml file that we created. The locals.tf should then take care of the rest.
This post is co-written with Jhanvi Shriram and Ketaki Shriram from Krikey. Krikey AI is revolutionizing the world of 3D animation with their innovative platform that allows anyone to generate high-quality 3D animations using just text or video inputs, without needing any prior animation experience. At the core of Krikey AI’s offering is their powerful […]
Insights into Multimodal Transformers from Neuroscience
Image generated by the author using Dall-E 3.
How do recent multimodal transformer networks, like CLIP (Radford et al. 2021) and LLaVA (Liu et al. 2023), compare to the brain? Are there similarities between the attention in these networks and the brain? In this article, I look at these transformer architectures with an eye on the similarities and differences with the mammalian brain.
What stood out to me was that vision transformers, CLIP, and LLaVA perform a type of processing analogous to pre-attentive visual processing in the brain. This processing is done in the initial feedforward visual responses to a stimulus before recurrence. Although a lot can be accomplished in a feedforward way, studies have shown that feedforward pre-attentive processing in the brain does have difficulty with:
Distinguishing the identity or characteristics of similar types of objects, especially when objects are close together or cluttered or the objects are unnatural or artificial (VanRullen 2007).
More complex tasks such as counting or maze or curve tracing tasks.
Perceiving objects that are more difficult to see, such as where it is difficult to perceive the boundaries of the objects.
In contrast to the feed-forward processing, one of the things that stands out with the brain is the richness in the interaction of areas, which I will discuss in more detail in the next section.
Bidirectional Activity in the Brain
In most current deep learning architectures, activity is propagated in a single direction, for example, an image might be given as input to a network and then propagated from layer to layer until you get to a classification as the output.
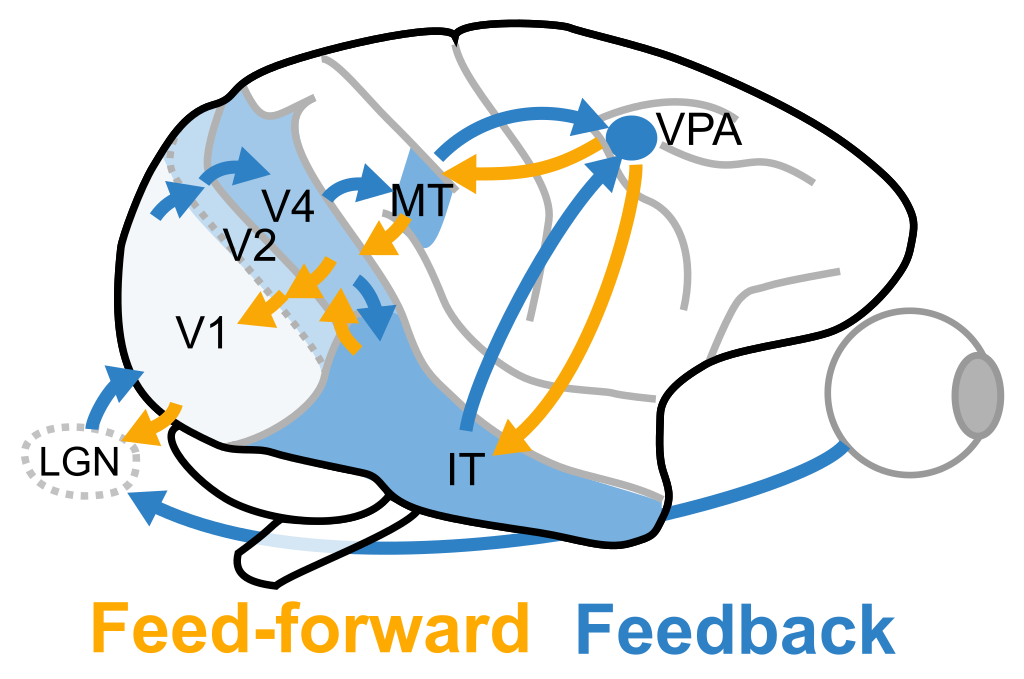
Figure 1: A simplified diagram showing some of the feed-forward and feedback connections in the Macaque brain. The earlier (or lower-level) areas are whiter, while the later (or higher-level) areas are bluer. Image by Author.
The brain is much more interesting than these feedforward models. In the visual system, a stimulus will initially propagate from lower- to higher-level visual areas in a feedforward fashion, then the higher-level areas will exert influence over the lower-level areas as depicted in Figure 1.
Some of this feedback is the conscious top-down attention that allows us to allocate more resources to objects and features of interest and disambiguate stimuli that are either complex or ambiguous. Another part of this feedback is automatic and allows higher-level areas to infuse the lower-level areas with information that would not be known in just the feedforward manner.
Conscious top-down attention is thought to support consciousness of visual stimuli. Without conscious access to lower-level areas that encode borders and edges, we wouldn’t have as spatially precise a perception of borders. Tasks like mentally tracing a curve or solving a maze would be impossible.
One example of automatic unconscious feedback is border-ownership coding which is seen in about half of the orientation-selective neurons in visual area V2 (Zhou et al. 2000, Williford and von der Heydt 2013). These neurons will encode local information in about 40 ms and, as early as 10 ms after this initial response, will incorporate global context to resolve occlusions — holding the information about which objects are creating borders by occluding their backgrounds.
Another example of this unconscious feedback was shown by Poort et al. (2012) using images like that in Figure 2. In the Macaque early visual cortex V1, neurons will tend to initially (within 50–75 ms of stimulus presentation) encode only the local features within their receptive fields (e.g., green square). However, after around 75 ms, they will receive feedback from the higher-level areas and tend to have a higher response when that texture belongs to a figure, such as this texture-defined figure above. This happens even when attention is drawn away from the figure, however, if the monkey is paying attention to the figure the neurons will on average respond even more.
Figure 2: Shapes defined only by texture, like the above, can be difficult to see in a pure “feed-forward” manner. The interaction between lower- and higher-level areas enables us to perceive such difficult shapes (Poort et 2012). Image by Author.
One way to look at this bidirectional interaction is that each neuron greedily uses all available predictive signals constantly. Even higher-level areas can be predictive, especially when visual borders do not correspond to significant first-order contrast edges.
Transformers
With all the talk about attention with the introduction of transformers (Vaswani et al. 2017) and with the ability to generate sentences one word at a time, you might be led to believe that transformers are recurrent. However, there are no internal states kept between the steps of the transformer, only the previous output is provided as input. So, the recurrence is limited and does not have the bidirectionality that is ubiquitous in the brain. Transformers do have multi-headed attention, which is like being able to attend to a fixed number of things simultaneously (8 in the original paper). Hence, image transformers can be seen as analogous to pre-attentive feedforward processing with some modifications.
CLIP
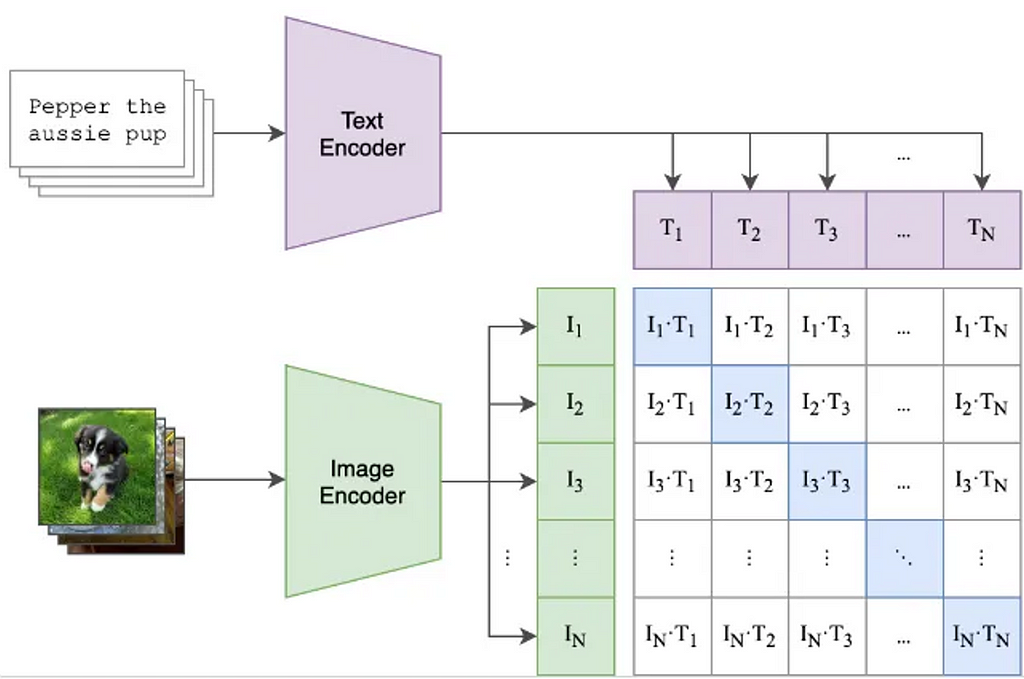
Figure 3: CLIP trains an image and text encoder using image caption pairs. I₁ and T₁ are the encodings of image 1 and the corresponding caption. A contrastive learning loss is used to make the Iᵢ and Tj more similar when i=j and more dissimilar when i≠j. Weights are trained from scratch. Figure reproduced with permission from Radford et al. (2021).
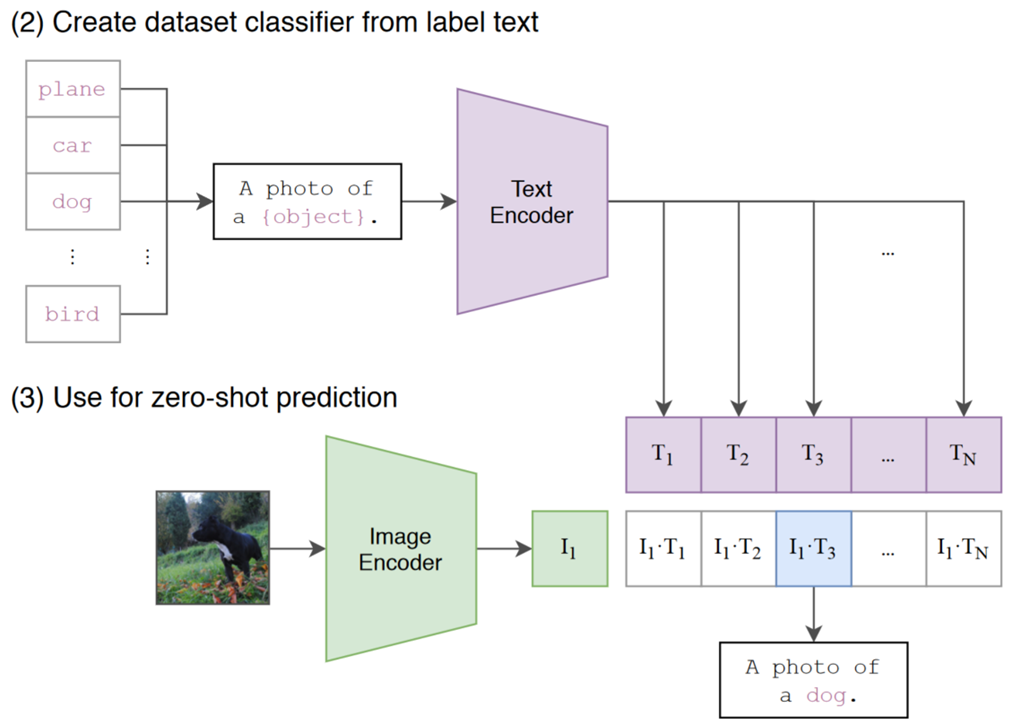
Radford and colleagues from OpenAI introduced CLIP in their 2021 paper “Learning Transferable Visual Models from Natural Language Supervision”. The idea behind CLIP is simple and is shown in Figure 3. It takes a bunch of image and caption pairs from the Internet and feeds the image to an image encoder and the text to a text encoder. It then uses a loss that brings the encoding of the image and the encoding of the text closer together when they are in the same pair, otherwise the loss increases the distance of the encodings. This is what CLIP gives you: the ability to compare the similarity between text and images. This does allow it to be used for zero-shot classification, as shown in Figure 4. CLIP does not, by itself, generate text descriptions from images.
The image encoder and text encoder are independent, meaning there is no way for task-driven modulation to influence the image encoding. This means that the image encoder must encode everything that could be potentially relevant to the task. Typically, the resolution of the input image is small, which helps prevent the computation and memory requirements from exploding.
Figure 4: CLIP can be used for zero-shot classification. Text is created for each of the N classes, which are then encoded into tokens T1…TN. The image is then encoded, and the similarity is measured with the generated text encodings. The most similar text encoding is the chosen class. Figure reproduced with permission from Radford et al. (2021).
LLaVA
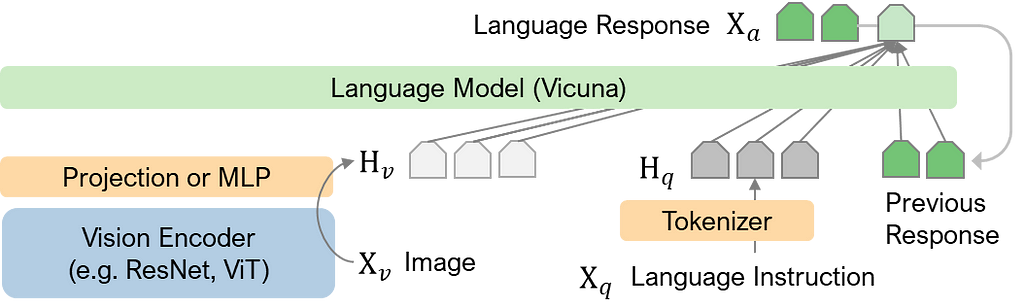
Figure 5: LLaVA architecture. Xv: image, Xq: instruction/question, Hv: image tokens, Hq: instruction tokens, Xa: answer, generated one token at a time. Image by Author, based on Figure 1 from Liu et al. (2023).
Large Language and Vision Assistant (LLaVA) (Liu et al. 2023) is a large language and vision architecture that extends and builds onto CLIP to add the ability to describe and answer questions about images. This type of architecture interests me because it can attempt tasks like those used in Neuroscience and Psychology.
LLaVA takes the vision transformer model ViT-L/14 trained by CLIP for image encoding (Figure 5). The first paper uses a single linear projection matrix W to convert the encodings into tokens. The tokens calculated from the images Hᵥ and the text instructions Hq are provided as input. LLaVA can then generate the language response Xₐ one token at a time, appending the response so far as the input to the next iteration.
I won’t go into the details of how LLaVA is trained, but it is interesting how they use ChatGPT to expand the caption (Xc) in Figure 5 to form instructions (Hq) and responses (used to train Xₐ) about an image and the use of bounding box information.
In version 1.5 of LLaVA (Liu et al. 2024), some of the improvements they made include:
The linear projection matrix W is replaced with a multilayer perceptron
The image resolution is increased by using an image encoder that takes images of size 336×336 pixels and splits the images into grids that are encoded separately
Task-driven attention in the brain can dynamically allocate resources to the object, location, or features of interest, which allows the processing of information that would otherwise be overwhelmed by clutter or other objects. In LLaVA, the image encoder is independent of the text instructions, so to be successful it needs to make sure any potentially useful information is stored in the image tokens (Hᵥ).
Conclusion
LLaVA and CLIP lack bidirectional and recurrence with internal states, which constrains their processing. This is especially true for image processing since image processing is done independently of the text instructions. Most convolutional neural networks also share these limitations. This leads me to my conjecture:
Conjecture: Most convolutional, vision transformer, and multimodal transformer networks are restricted to processing that is analogous to pre-attentive feedforward visual processing in the brain.
This is not a criticism as much as an insight that can be informative. Feedforward processing can do a lot and is fast. However, it is not as dynamic as to what resources can be used to be used, which can lead to informational bottlenecks in cluttered scenes and is unable to encode enough information for complex tasks without an explosion of the size of the encodings. Creating models that work in a feedforward fashion is an important stepping stone because of the difficulty of adding recurrence and bidirectional processing.
Some networks are not limited to pre-attentive feedforward networks, but currently, most of the architectures lag behind those of transformers. These include long-short term memory models (LSTMs) and, more recently, the Mamba architecture, which has several benefits over transformers (Gu and Dao 2024). Extended LSTMs (Beck et al. 2024, Alkin et al. 2024) have recently been proposed, which help close the gap between transformers and LSTMs. Diffusion models also have a limited type of recurrence that uses the image as the state between iterations.
We use cookies on our website to give you the most relevant experience by remembering your preferences and repeat visits. By clicking “Accept”, you consent to the use of ALL the cookies.
This website uses cookies to improve your experience while you navigate through the website. Out of these, the cookies that are categorized as necessary are stored on your browser as they are essential for the working of basic functionalities of the website. We also use third-party cookies that help us analyze and understand how you use this website. These cookies will be stored in your browser only with your consent. You also have the option to opt-out of these cookies. But opting out of some of these cookies may affect your browsing experience.
Necessary cookies are absolutely essential for the website to function properly. These cookies ensure basic functionalities and security features of the website, anonymously.
Cookie
Duration
Description
cookielawinfo-checkbox-analytics
11 months
This cookie is set by GDPR Cookie Consent plugin. The cookie is used to store the user consent for the cookies in the category "Analytics".
cookielawinfo-checkbox-functional
11 months
The cookie is set by GDPR cookie consent to record the user consent for the cookies in the category "Functional".
cookielawinfo-checkbox-necessary
11 months
This cookie is set by GDPR Cookie Consent plugin. The cookies is used to store the user consent for the cookies in the category "Necessary".
cookielawinfo-checkbox-others
11 months
This cookie is set by GDPR Cookie Consent plugin. The cookie is used to store the user consent for the cookies in the category "Other.
cookielawinfo-checkbox-performance
11 months
This cookie is set by GDPR Cookie Consent plugin. The cookie is used to store the user consent for the cookies in the category "Performance".
viewed_cookie_policy
11 months
The cookie is set by the GDPR Cookie Consent plugin and is used to store whether or not user has consented to the use of cookies. It does not store any personal data.
Functional cookies help to perform certain functionalities like sharing the content of the website on social media platforms, collect feedbacks, and other third-party features.
Performance cookies are used to understand and analyze the key performance indexes of the website which helps in delivering a better user experience for the visitors.
Analytical cookies are used to understand how visitors interact with the website. These cookies help provide information on metrics the number of visitors, bounce rate, traffic source, etc.
Advertisement cookies are used to provide visitors with relevant ads and marketing campaigns. These cookies track visitors across websites and collect information to provide customized ads.