Data modeling is a process of creating a conceptual representation of the data and its relationships within an organization or system. Dimensional modeling is an advanced technique that attempts to present data in a way that is intuitive and understandable for any user. It also allows for high-performance access, flexibility, and scalability to accommodate changes in business needs.
In this article, I will provide an in-depth overview of data modeling, with a specific focus on Kimball’s methodology. Additionally, I will introduce other techniques used to present data in a user-friendly and intuitive manner. One particularly interesting technique for modern data warehouses is storing data in one wide table, although this approach may not be suitable for all query engines. I will present techniques that can be used in Data Warehouses, Data Lakes, Data Lakehouses, etc. However, it is important to choose the appropriate methodology for your specific use case and query engine.
What is dimensional modeling?
Every dimensional model consists of one or more tables with a multipart key, referred to as the fact table, along with a set of tables known as dimension tables. Each dimension table has a primary key that precisely corresponds to one of the components of the multipart key in the fact table. This distinct structure is commonly referred to as a star schema. In some cases, a more intricate structure called a snowflake schema can be used, where dimension tables are connected to smaller dimension tables
Benefits of dimensional modeling:
Dimensional modeling provides a practical and efficient approach to organizing and analyzing data, resulting in the following benefits:
Simplicity and understandability for business users.
Improved query performance for faster data retrieval.
Flexibility and scalability to adapt to changing business needs.
Ensured data consistency and integration across multiple sources.
Enhanced user adoption and self-service analytics.
Now that we have discussed what dimensional modeling is and the value it brings to organizations, let’s explore how to effectively leverage it.
Data and dimensional modeling methodologies
While I intend to primarily focus on Kimball’s methodology, let’s briefly touch upon a few other popular techniques before diving into it.
Inmon methodology
Inmon suggests utilizing a normalized data model within the data warehouse. This methodology supports the creation of data marts. These data marts are smaller, specialized subsets of the data warehouse that cater to specific business areas or user groups. These are designed to provide a more tailored and efficient data access experience for particular business functions or departments.
Data vault
Data Vault is a modeling methodology that focuses on scalability, flexibility, and traceability. It consists of three core components: the Hub, the Link, and the Satellite.
Hubs
Hubs are collections of all distinct entities. For example, an account hub would include account, account_ID, load_date, and src_name. This allows us to track where the record originally came from when it was loaded, and if we need a surrogate key generated from the business key.
Links
Links establish relationships between hubs and capture the associations between different entities. They contain the foreign keys of the related hubs, enabling the creation of many-to-many relationships.
Satellites
Satellites store the descriptive information about the hubs, providing additional context and attributes. They include historical data, audit information, and other relevant attributes associated with a specific point in time.
Data Vault’s design allows for a flexible and scalable data warehouse architecture. It promotes data traceability, auditability, and historical tracking. This makes it suitable for scenarios where data integration and agility are critical, such as in highly regulated industries or rapidly changing business environments.
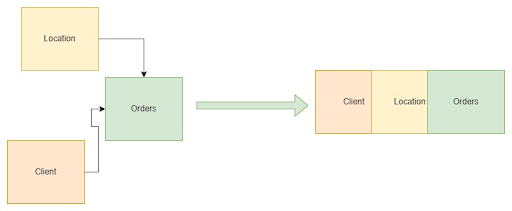
One big table (OBT)
OBT stores data in one wide table. Using one big table, or a denormalized table, can simplify queries, improve performance, and streamline data analysis. It eliminates the need for complex joins, eases data integration, and can be beneficial in certain scenarios. However, it may lead to redundancy, data integrity challenges, and increased maintenance complexity. Consider the specific requirements before opting for a single large table.
Image by authorImage by author
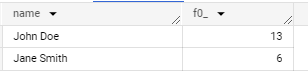
WITH transactions AS (
  SELECT 1000001 AS order_id, TIMESTAMP('2017-12-18 15:02:00') AS order_time,
          STRUCT(65401 AS id, 'John Doe' AS name, 'Norway' AS location) AS customer,
          [
            STRUCT('xxx123456' AS sku, 3 AS quantity, 1.3 AS price),
            STRUCT('xxx535522' AS sku, 6 AS quantity, 500.4 AS price),
            STRUCT('xxx762222' AS sku, 4 AS quantity, 123.6 AS price)
          ] AS orders
  UNION ALL
  SELECT 1000002, TIMESTAMP('2017-12-16 11:34:00'),
        STRUCT(74682, 'Jane Smith', 'Poland') AS customer,
        [
            STRUCT('xxx635354',   4,      345.7),
            STRUCT('xxx828822', 2,      9.5)
        ] AS orders
)


select *


from
transactions
In the case of one wide table we don’t need to join tables. We can use only one table to aggregate data and make analyzes. This method improves performance in BigQuery.
Image by author
select customer.name, sum(a.quantity)


from
transactions t, UNNEST(t.orders) as a
group by  customer.name
Kimball methodology
The Kimball methodology places significant emphasis on the creation of a centralized data repository known as the data warehouse. This data warehouse serves as a singular source of truth, integrating and storing data from various operational systems in a consistent and structured manner.
This approach offers a comprehensive set of guidelines and best practices for designing, developing, and implementing data warehouse systems. It places a strong emphasis on creating dimensional data models and prioritizes simplicity, flexibility, and ease of use. Now, let’s delve into the key principles and components of the Kimball methodology.
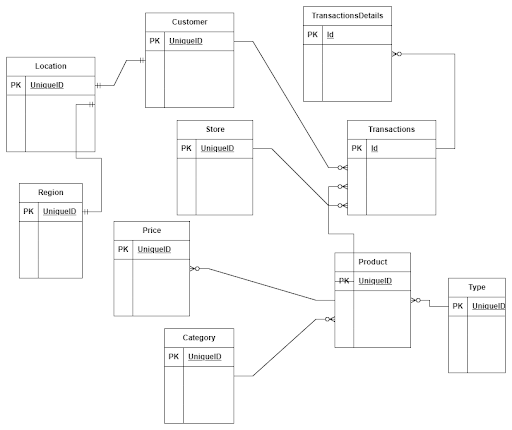
Entity model to dimensional model
In our data warehouses, the sources of data are often found in entity models that are normalized into multiple tables, which contain the business logic for applications. In such a scenario, it can be challenging as one needs to understand the dependencies between tables and the underlying business logic. Creating an analytical report or generating statistics often requires joining multiple tables.
Image by author
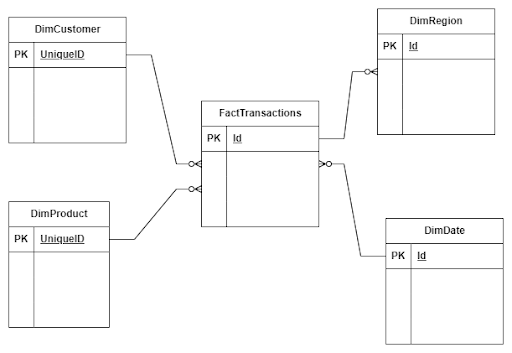
To create a dimensional model, the data needs to undergo an Extract, Transform, and Load (ETL) process to denormalize it into a star schema or snowflake schema. The key activity in this process involves identifying the fact and dimension tables and defining the granularity. The granularity determines the level of detail stored in the fact table. For example, transactions can be aggregated per hour or day.
Image by author
Let’s assume we have a company that sells bikes and bike accessories. In this case, we have information about:
Transactions
Stores
Clients
Products
Based on our business knowledge, we know that we need to collect information about sales volume, quantity over time, and segmented by regions, customers, and products. With this information, we can design our data model. The transactions’ table will serve as our fact table, and the stores, clients, and products tables will act as dimensional tables.
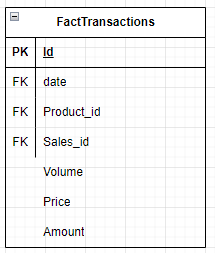
Fact table
A fact table typically represents a business event or transaction and includes the metrics or measures associated with that event. These metrics can encompass various data points such as sales amounts, quantities sold, customer interactions, website clicks, or any other measurable data that offers insights into business performance. The fact table also includes foreign key columns that establish relationships with dimension tables.
Image by author
The best practice in the fact table design is to put all foreign keys on the top of the table and then measure.
Fact Tables Types
Transaction Fact Tables gives a grain at its lowest level as one row represents a record from the transaction system. Data is refreshed on a daily basis or in real time.
Periodic Snapshot Fact Tables capture a snapshot of a fact table at a point in time, like for instance the end of month.
Accumulating Snapshot Fact Table summarizes the measurement events occurring at predictable steps between the beginning and the end of a process.
Factless Fact Table keeps information about events occurring without any masseurs or metrics.
Dimension table
A dimension table is a type of table in dimensional modeling that contains descriptive attributes like for instance information about products, its category, and type. Dimension tables provide the context and perspective to the quantitative data stored in the fact table.
Dimension tables contain a unique key that identifies each record in the table, named the surrogate key. The table can contain a business key that is a key from a source system. A good practice is to generate a surrogate key instead of using a business key.
There are several approaches to creating a surrogate key:
-Hashing: a surrogate key can be generated using a hash function like MD5, SHA256(e.g. md5(key_1, key_2, key_3) ).
-Incrementing: a surrogate key that is generated by using a number that is always incrementing (e.g. row_number(), identity).
-Concatenating: a surrogate key that is generated by concatenating the unique key columns (e.g. concat(key_1, key_2, key_3) ).
-Unique generated: a surrogate key that is generated by using a function that generates a unique identifier (e.g. GENERATE_UUID())
The method that you will choose depends on the engine that you use to process and store data. It can impact performance of querying data.
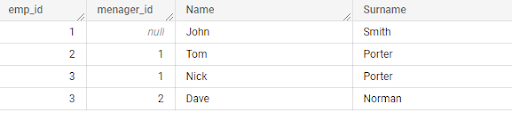
Dimensional tables often contain hierarchies.
a) For example, the parent-child hierarchy can be used to represent the relationship between an employee and their manager.
Image by author
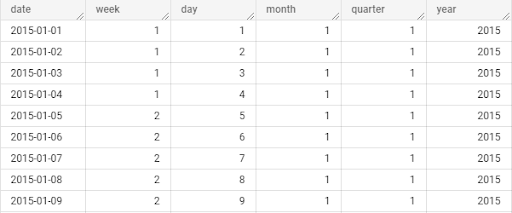
b) Hierarchical relationships between attributes. For example, a time dimension might have attributes like year, quarter, month, and day, forming a hierarchical structure.
Image by author
Types of dimension tables
Conformed Dimension:
A conformed dimension is a dimension that can be used by multiple fact tables. For example, a region table can be utilized by different fact tables.
Degenerate Dimension:
A degenerate dimension occurs when an attribute is stored in the fact table instead of a dimension table. For instance, the transaction number can be found in a fact table.
Junk Dimension:
This one contains non-meaningful attributes that do not fit well in existing dimension tables, or are combinations of flags and binary values representing various combinations of states.
Role-Playing Dimension:
The same dimension key includes more than one foreign key in the fact table. For example, a date dimension can refer to different dates in a fact table, such as creation date, order date, and delivery date.
Static Dimension:
A static dimension is a dimension that typically never changes. It can be loaded from reference data without requiring updates. An example could be a list of branches in a company.
Bridge Table:
Bridge tables are used when there are one-to-many relationships between a fact table and a dimension table.
Slowly changing dimension
A Slowly Changing Dimension (SCD) is a concept in dimensional modeling. It handles changes to dimension attributes over time in dimension tables. SCD provides a mechanism for maintaining historical and current data within a dimension table as business entities evolve and their attributes change. There are six types of SCD, but the three most popular ones are:
SCD Type 0: In this type, only new records are imported into dimension tables without any updates.
SCD Type 1: In this type, new records are imported into dimension tables, and existing records are updated.
SCD Type 2: In this type, new records are imported, and new records with new values are created for changed attributes.
For example, when John Smith moves to another city, we use SCD Type 2 to keep information about transactions related to London. In this case, we create a new record and update the previous one. As a result, historical reports will retain information that his purchases were made in London.
Image by authorImage by author
MERGE INTO client AS tgt
USING (
    SELECT
Client_id,
Name,
Surname,
City
      GETDATE() AS ValidFrom
    ‘20199-01-01’ AS ValidTo
from client_stg
) AS src
ON (tgt.Clinet_id = src.Clinet_id AND tgt.iscurrent = 1)
WHEN MATCHED THEN
    UPDATE SET tgt.iscurrent = 0, ValidTo = GETDATE()
WHEN NOT MATCHED THEN
    INSERT (Client_id, name, Surname, City, ValidFrom, ValidTo, iscurrent)
    VALUES (Client_id, name, Surname, City, ValidFrom, ValidTo,1);
This is how SCD 3 looks when we keep new and previous values in separate columns.
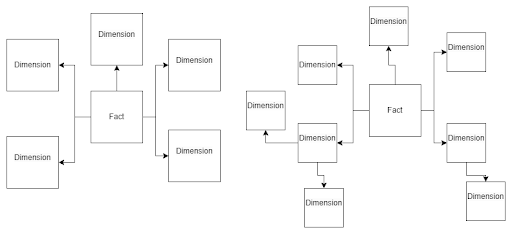
Star schema vs. snowflake schema
The most popular approach to designing a data warehouse is to utilize either a star schema or a snowflake schema. The star schema has fact tables and dimensional tables that are in relation to the fact table. In a star schema, there are fact tables and dimensional tables that are directly related to the fact table. On the other hand, a snowflake schema consists of a fact table, dimension tables related to the fact table, and additional dimensions related to those dimension tables.
Image by author
The main differences between these two designs lie in their normalization approach. The star schema keeps data denormalized, while the snowflake schema ensures normalization. The star schema is designed for better query performance. The snowflake schema is specifically tailored to handle updates on large dimensions. If you encounter challenges with updates to extensive dimension tables, consider transitioning to a snowflake schema.
Data loading strategies
In our data warehouse, data lake, and data lake house we can have various load strategies like:
Full Load: The full load strategy involves loading all data from source systems into the data warehouse. This strategy is typically used in the case of performance issues or lack of columns that could inform about row modification.
Incremental Load: The incremental load strategy involves loading only new data since the last data load. If rows in the source system can’t be changed, we can load only new records based on a unique identifier or creation date. We need to define a “watermark” that we will use to select new rows.
Delta Load: The delta load strategy focuses on loading only the changed and new records since the last load. It differs from incremental load in that it specifically targets the delta changes rather than all records. Delta load strategies can be efficient when dealing with high volumes of data changes and significantly reduce the processing time and resources required.
The most common strategy to load data is to populate dimension tables and then fact tables. The order here is important because we need to use primary keys from dimension tables in fact tables to create relationships between tables. There is an exception. When we need to load a fact table before a dimension table, this technique name is late arriving dimensions.
In this technique, we can create surrogate keys in a dimension table, and update it by ETL process after populating the fact table.
Summary
After a thorough reading of the article, if you have any questions or would like to further discuss data modeling and effective dimensional models, feel free to reach out to me on LinkedIn. Implementing data modeling can unlock the potential of your data, providing valuable insights for informed decision-making while gaining knowledge in methods and best practices.
Navigating the Latest GenAI Announcements — July 2024
A guide to new models GPT-4o mini, Llama 3.1, Mistral NeMo 12B and other GenAI trends
Image Created by Author with GPT-4o to represent different models
Introduction
Since the launch of ChatGPT in November 2022, it feels like almost every week there’s a new model, novel prompting approach, innovative agent framework, or other exciting GenAI breakthrough. July 2024 is no different: this month alone we’ve seen the release of Mistral Codestral Mamba, Mistral NeMo 12B, GPT-4o mini, and Llama 3.1 amongst others. These models bring significant enhancements to areas like inference speed, reasoning ability, coding ability, and tool calling performance making them a compelling choice for business use.
In this article we’ll cover the highlights of recently released models and discuss some of the major trends in GenAI today, including increasing context window sizes and improving performance across languages and modalities.
Overview of July Release Models
Mistral Codestral Mamba
Overview: Codestral Mamba 7B is designed for enhanced reasoning and coding capabilities using the Mamba architecture instead of the Transformer architecture used by most Language Models. This architecture enables in context retrieval for much longer sequences and has been tested for sequences up to 256K tokens. By comparison, most Transformer based models allow between 8-128K token context windows. The Mamba architecture also enables faster inference speeds than Transformer based models.
Availability: Codestral Mamba is an open source model under the Apache 2.0 License.
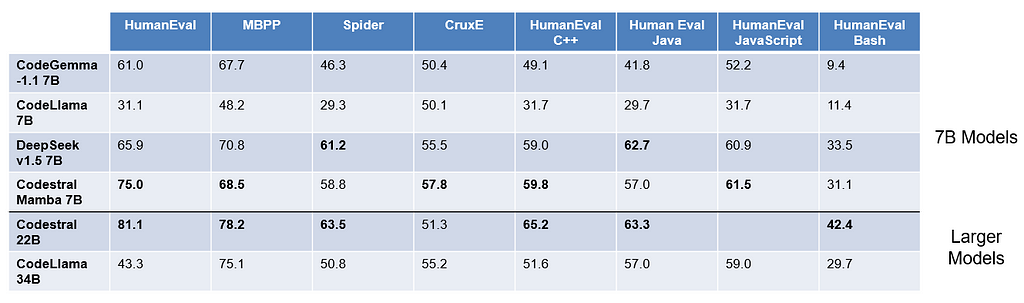
Performance: Codestral Mamba 7B outperforms CodeGemma-1.1 7B, CodeLlama 7B, and DeepSeekv1.5 7B on the HumanEval, MBPP, CruxE, HumanEval C++, and Human Eval JavaScript benchmarks. It performs similarly to Codestral 22B across these benchmarks despite it’s smaller size.
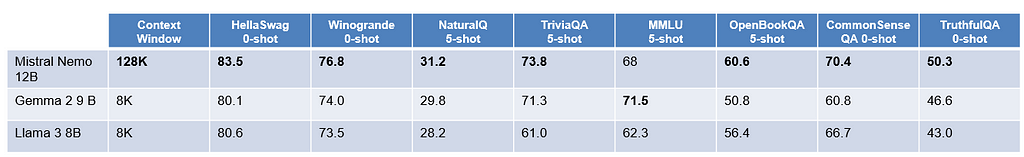
Overview: Mistral NeMo 12B was produced by Mistral and Nvidia to offer a competitive language model in the 12B parameter range with a far larger context window than most models of this size. Nemo 12B has a 128K token context window while similarly sized models Gemma 2 9B and Llama 3 8B offer only 8K token context windows. NeMo is designed for multilingual use cases and provides a new tokenizer, Tekken, which outperforms the Llama 3 tokenizer for compressing text across 85% of languages. The HuggingFace model card indicates NeMo should be used with lower temperatures than earlier Mistral models, they recommend setting the temperature to 0.3.
Availability: NeMo 12B is an open source model (offering both base and instruction-tuned checkpoints) under the Apache 2.0 License.
Performance: Mistral NeMo 12B outperforms Gemma 2 9B and Llama 3 8B across multiple zero and five shot benchmarks by as much as 10%. It also performs almost 2x better than Mistral 7B on WildBench which is designed to measure model’s performance on real world tasks requiring complex reasoning and multiple conversation turns.
Overview: GPT-4o mini is a small, cost effective model that supports text and vision and offers competitive reasoning and tool calling performance. It has a 128K token context window with an impressive 16K token output length. It is the most cost effective model from OpenAI at 15 cents per million input tokens and 60 cents per million output tokens. OpenAI notes that this price is 99% cheaper than their text-davinci-003 model from 2022 indicating a trend towards cheaper, smaller, more capable models in a relatively short time frame. While GPT-4o mini does not support image, video, and audio inputs like GPT-4o does, OpenAI reports these features are coming soon. Like GPT-4o, GPT-4o mini has been trained with built-in safety measures and is the first OpenAI model that applies the instruction hierarchy method designed to make the model more resistant to prompt injections and jailbreaks. GPT-4o mini leverages the same tokenizer as GPT-4o which enables improved performance on non-English text.
Availability: GPT-4o mini is a closed source model available through OpenAI’s Assistants API, Chat Completions API, and Batch API. It is also available through Azure AI.
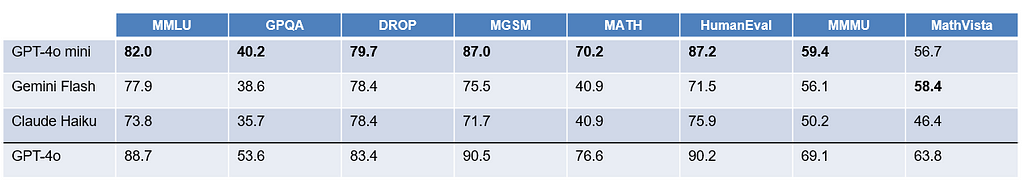
Performance: GPT-4o mini outperforms Gemini Flash and Claude Haiku, models of similar size, on multiple benchmarks including MMLU (Massive Multitask Language Understanding) which is designed to measure reasoning ability, MGSM (Multilingual Grade School Math) which measures mathematical reasoning, HumanEval which measures coding ability, and MMMU (Massive Multi-discipline Multimodal Understanding and Reasoning Benchmark) which measures multimodal reasoning.
Overview: Llama 3.1 introduces a 128K token context window, a significant jump from the 8K token context window for Llama 3, which was released only three months ago in April. Llama 3.1 is available in three sizes: 405B, 70B, and 8B. It offers improved reasoning, tool-calling, and multilingual performance. Meta’s Llama 3.1 announcement calls Llama 3.1 405B the “first frontier-level open source AI model”. This demonstrates a huge stride forward for the open source community and demonstrates Meta’s commitment to making AI accessible, Mark Zuckerberg discusses this in more detail in his article “Open Source AI is the Path Forward”. The Llama 3.1 announcement also includes guidance on enabling common use cases like real-time and batch inference, fine-tuning, RAG, continued pre-training, synthetic data generation, and distillation. Meta also released the Llama Reference System to support developers working on agentic based use cases with Llama 3.1 and additional AI safety tools including Llama Guard 3 to moderate inputs and outputs in multiple languages, Prompt Guard to mitigate prompt injections, and CyberSecEval 3 to reduce GenAI security risks.
Availability: Llama 3.1 is an open source model. Meta has changed their license to allow developers to use the outputs from Llama models to train and improve other models. Models are available through HuggingFace, llama.meta.com, and through other partner platforms like Azure AI.
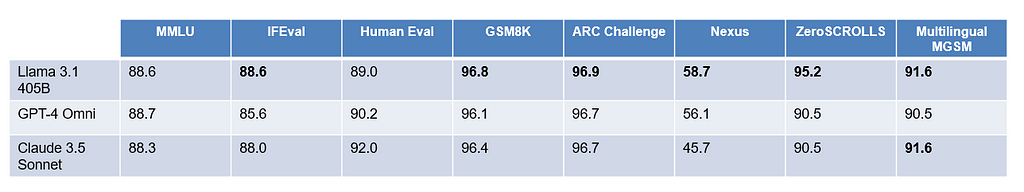
Performance: Each of the Llama 3.1 models outperform other models in their size class across nearly all the common language model benchmarks for reasoning, coding, math, tool use, long context, and multilingual performance.
Overall, there is a trend towards increasingly capable models of all sizes with longer context windows, longer token output lengths, and lower price points. The push towards improved reasoning, tool calling, and coding abilities reflect the increasing demand for agentic systems capable of taking complex actions on behalf of users. To create effective agent systems, models need to understand how to break down a problem, how to use the tools available to them, and how to reconcile lots of information at one time.
The recent announcements from OpenAI and Meta reflect the growing discussion around AI safety with both companies demonstrating different ways to approach the same challenge. OpenAI has taken a closed source approach and improved model safety through applying feedback from experts in social psychology and misinformation and implementing new training methods. In contrast, Meta has doubled down on their open source initiatives and released new tools focused on helping developers mitigate AI safety concerns.
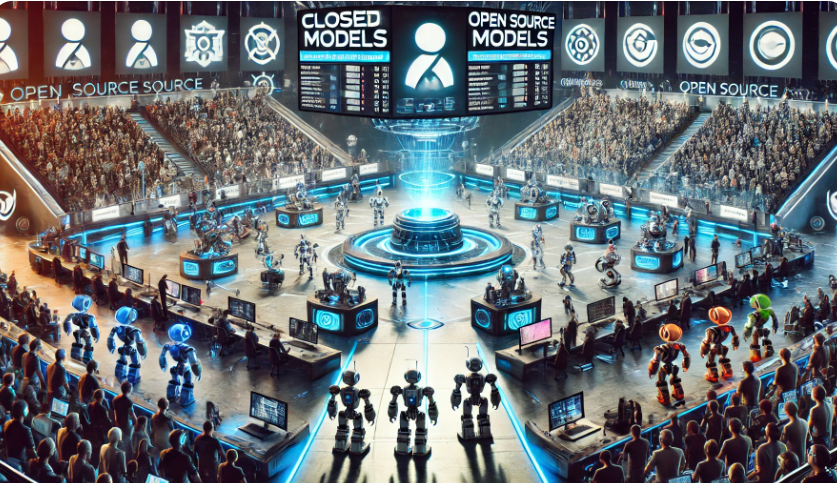
Image created by author with GPT-4o depicting an arena with closed and open source models competing.
Conclusion
In the future, I think we’ll continue to see advancements in generalist and specialist models with frontier models like GPT-4o and Llama 3.1 getting better and better at breaking down problems and performing a variety of tasks across modalities, while specialist models like Codestral Mamba will excel in their domain and become more adept at handling longer contexts and nuanced tasks within their area of expertise. Additionally, I expect we’ll see new benchmarks focused on models’ ability to follow multiple directions at once within a single turn and a proliferation of AI systems that leverage generalist and specialist models to perform tasks as a team.
Furthermore, while model performance is typically measured based on standard benchmarks, what ultimately matters is how humans perceive the performance and how effectively models can further human goals. The Llama 3.1 announcement includes an interesting graphic demonstrating how people rated responses from Llama 3.1 compared to GPT-4o, GPT-4, and Claude 3.5. The results show that Llama 3.1 received a tie from humans in over 50% of the examples with the remaining win rates roughly split between Llama 3.1 and it’s challenger. This is significant because it suggests that open source models can now readily compete in a league that was previously dominated by closed source models.
Interested in discussing further or collaborating? Reach out on LinkedIn!
Today, we are excited to announce a new capability in Amazon SageMaker inference that can help you reduce the time it takes for your generative artificial intelligence (AI) models to scale automatically. You can now use sub-minute metrics and significantly reduce overall scaling latency for generative AI models. With this enhancement, you can improve the […]
Amazon Q Business is a fully managed, generative artificial intelligence (AI)-powered assistant that helps enterprises unlock the value of their data and knowledge. With Amazon Q, you can quickly find answers to questions, generate summaries and content, and complete tasks by using the information and expertise stored across your company’s various data sources and enterprise […]
As conversational artificial intelligence (AI) agents gain traction across industries, providing reliability and consistency is crucial for delivering seamless and trustworthy user experiences. However, the dynamic and conversational nature of these interactions makes traditional testing and evaluation methods challenging. Conversational AI agents also encompass multiple layers, from Retrieval Augmented Generation (RAG) to function-calling mechanisms that […]
We use cookies on our website to give you the most relevant experience by remembering your preferences and repeat visits. By clicking “Accept”, you consent to the use of ALL the cookies.
This website uses cookies to improve your experience while you navigate through the website. Out of these, the cookies that are categorized as necessary are stored on your browser as they are essential for the working of basic functionalities of the website. We also use third-party cookies that help us analyze and understand how you use this website. These cookies will be stored in your browser only with your consent. You also have the option to opt-out of these cookies. But opting out of some of these cookies may affect your browsing experience.
Necessary cookies are absolutely essential for the website to function properly. These cookies ensure basic functionalities and security features of the website, anonymously.
Cookie
Duration
Description
cookielawinfo-checkbox-analytics
11 months
This cookie is set by GDPR Cookie Consent plugin. The cookie is used to store the user consent for the cookies in the category "Analytics".
cookielawinfo-checkbox-functional
11 months
The cookie is set by GDPR cookie consent to record the user consent for the cookies in the category "Functional".
cookielawinfo-checkbox-necessary
11 months
This cookie is set by GDPR Cookie Consent plugin. The cookies is used to store the user consent for the cookies in the category "Necessary".
cookielawinfo-checkbox-others
11 months
This cookie is set by GDPR Cookie Consent plugin. The cookie is used to store the user consent for the cookies in the category "Other.
cookielawinfo-checkbox-performance
11 months
This cookie is set by GDPR Cookie Consent plugin. The cookie is used to store the user consent for the cookies in the category "Performance".
viewed_cookie_policy
11 months
The cookie is set by the GDPR Cookie Consent plugin and is used to store whether or not user has consented to the use of cookies. It does not store any personal data.
Functional cookies help to perform certain functionalities like sharing the content of the website on social media platforms, collect feedbacks, and other third-party features.
Performance cookies are used to understand and analyze the key performance indexes of the website which helps in delivering a better user experience for the visitors.
Analytical cookies are used to understand how visitors interact with the website. These cookies help provide information on metrics the number of visitors, bounce rate, traffic source, etc.
Advertisement cookies are used to provide visitors with relevant ads and marketing campaigns. These cookies track visitors across websites and collect information to provide customized ads.