Stream Ordering: How And Why a Geo-Scientist Sometimes Needed to Rank Rivers on a Map
Learn how to obtain Strahler or Shreve order on vector layer

Dear reader, in this article, I would like to dive into one exciting hydrological topic. I will start with the picture:
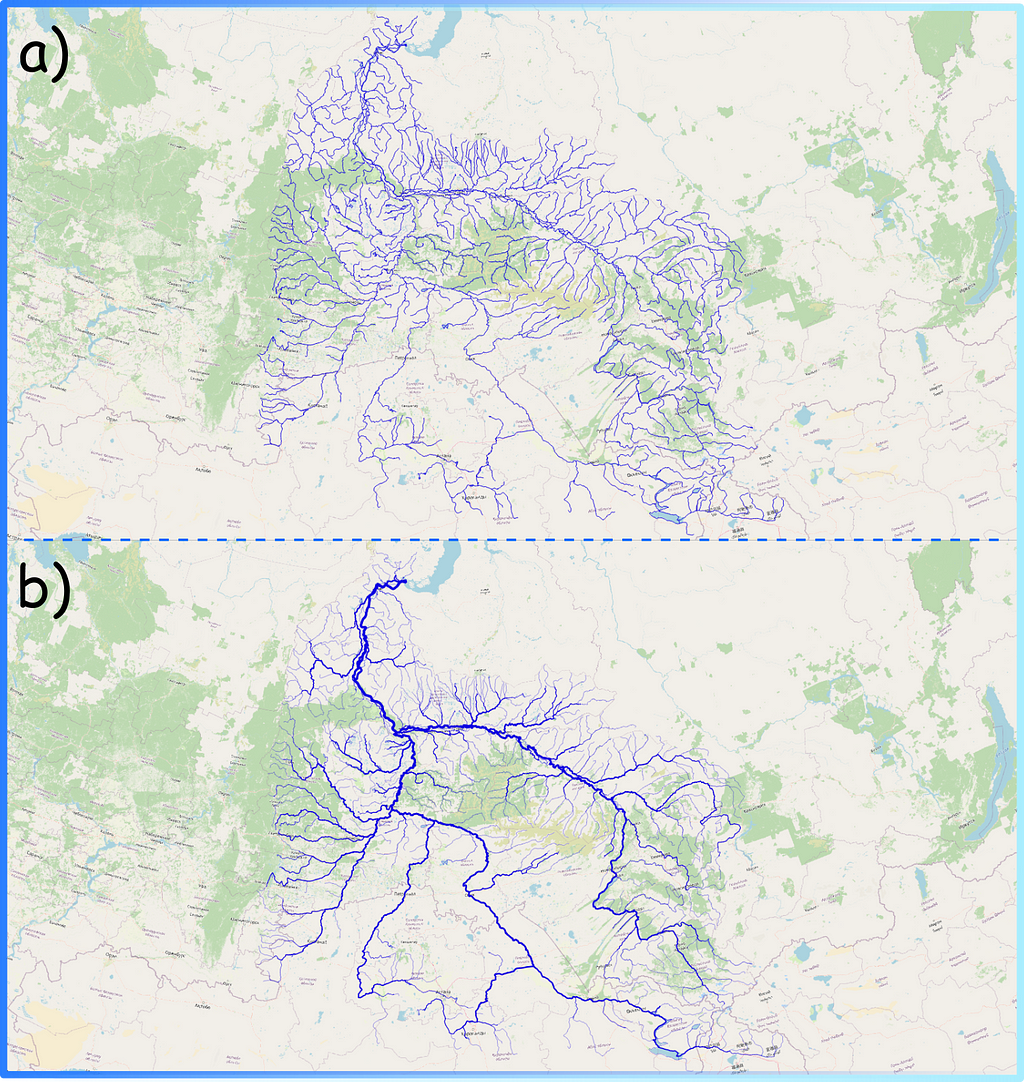
Disclaimer: this article is written both for geographers who face the problem of ranking river vector layer using geoinformation systems (GIS) and for people who have sometimes seen “nice rivers” on a map but do not know exactly how they are made. We will together sequentially explore how spatial data are represented in GIS applications, the way the structure of river networks can be analysed, and what visualisation techniques can be used.
Now the question is: Which map looks prettier? — For me, the one on the bottom (b).
Actually, the second visualisation is more correct from a common sense point of view as well. The more tributaries flowing into the riverbed, the wider and fuller the river will be. For example, one of the largest rivers in the world, the Nile, at its source (high in the mountains), barely resembles a powerful river at its mouth: with each kilometer of the way to the sea, the river absorbs more and more tributaries and becomes more and more full-flowing.
The map shown above (Figure 1b) was prepared on the basis of structural information on the river network. In this post I would like to discuss in which ways this additional information about rivers can be obtained and what tools can be used for this purpose.
What is the river
Let’s start by explaining how information about rivers is represented. In cartography and geo-sciences, rivers are represented as a linear vector layer: each river section is represented as a line with some characteristics. For example, the length of the section, its geographic coordinates (geometry of the object), ground type, average depth, flow velocity, etc. (Animation 1).
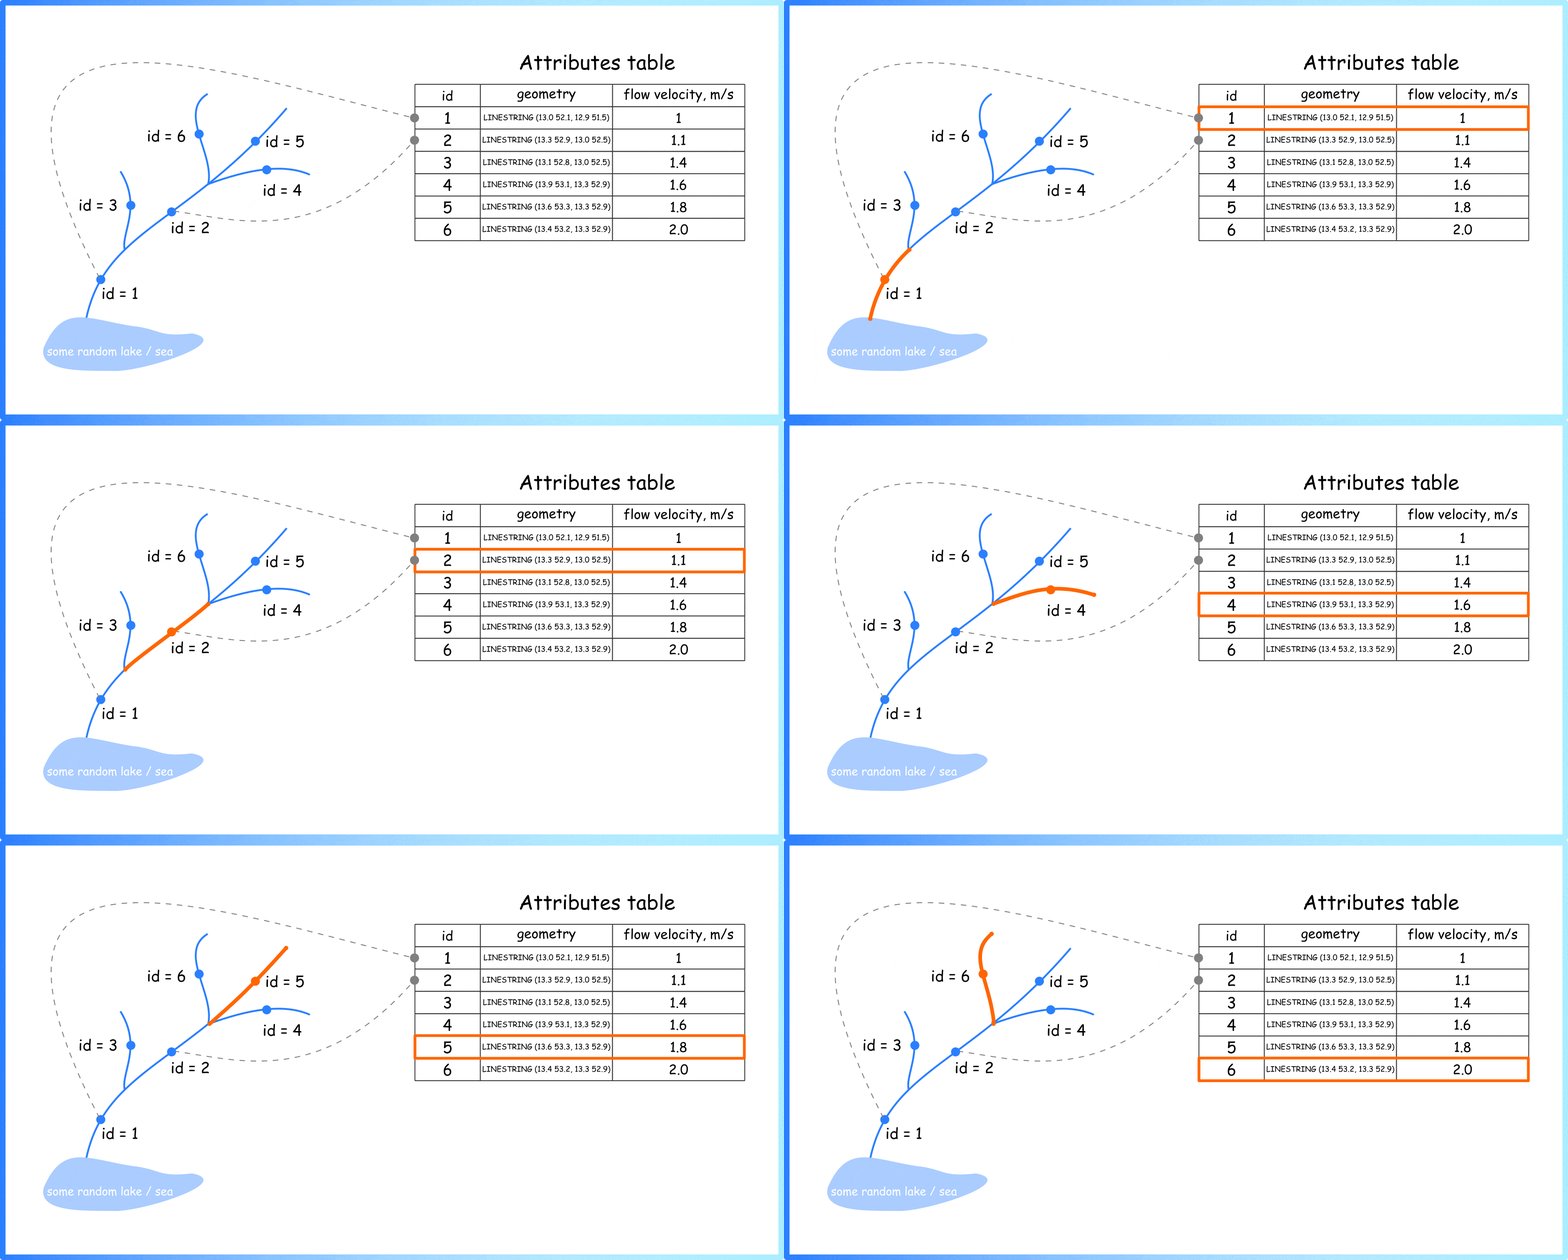
So, generally, if you see a river on a map, you see a set of these simple geometric primitives (individual rows in attrbute table) assembled into one big system. Different colours can be used to visualise stored characteristics (Figure 2).
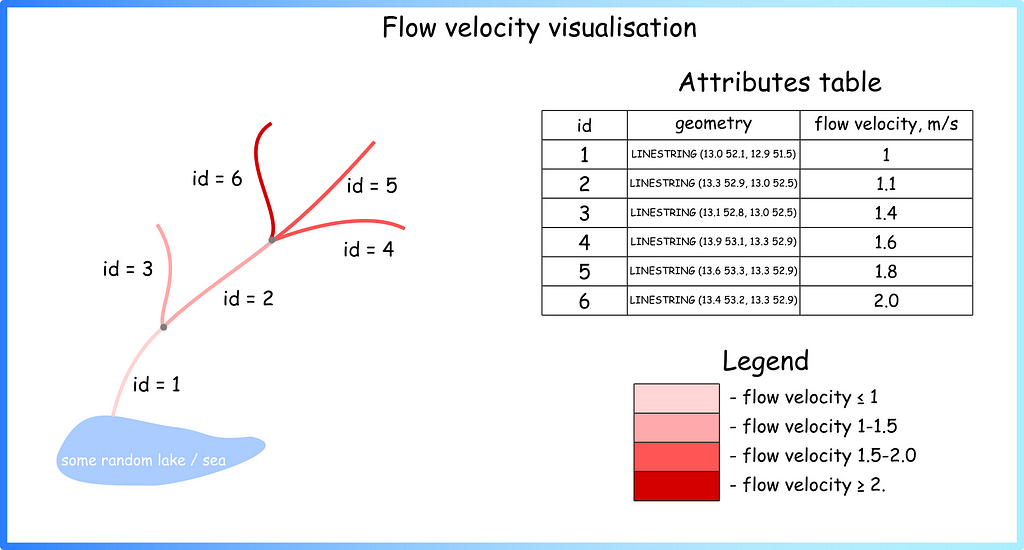
Either programming languages or specialised applications such as ArcGIS (proprietary software) or QGIS (open-source) are used for visualisation.
River structure
Such information in the attributes table on rivers can be collected in different ways: from remote sensing data, expeditions, gauges, and hydrological stations. However, information about the river structure is usually assigned by the specialist at the very last moment, when he or she sees on the map what the whole system looks like. For example, a researcher can themselves add a new column to the vector layer description in which they assign a rank to each river segment (Figure 3).
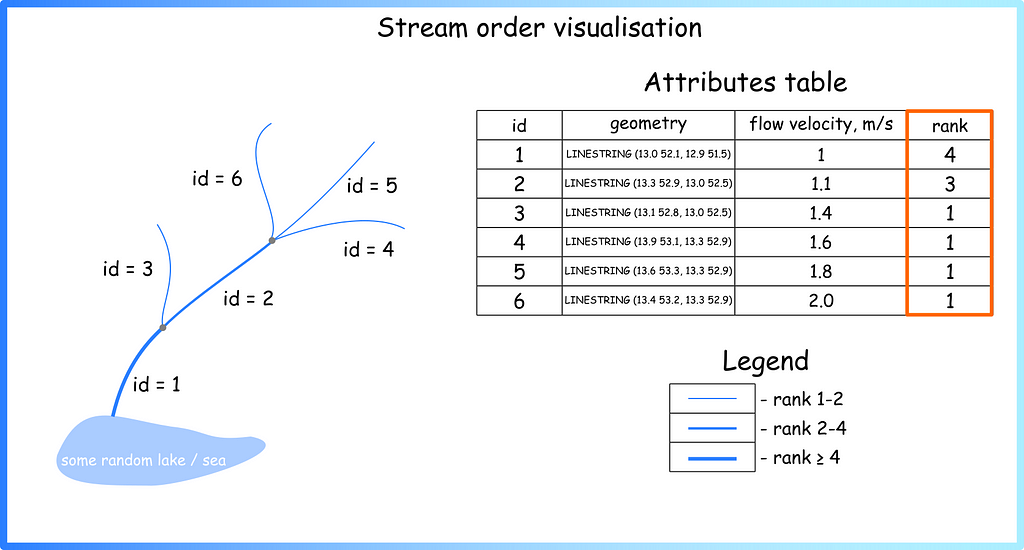
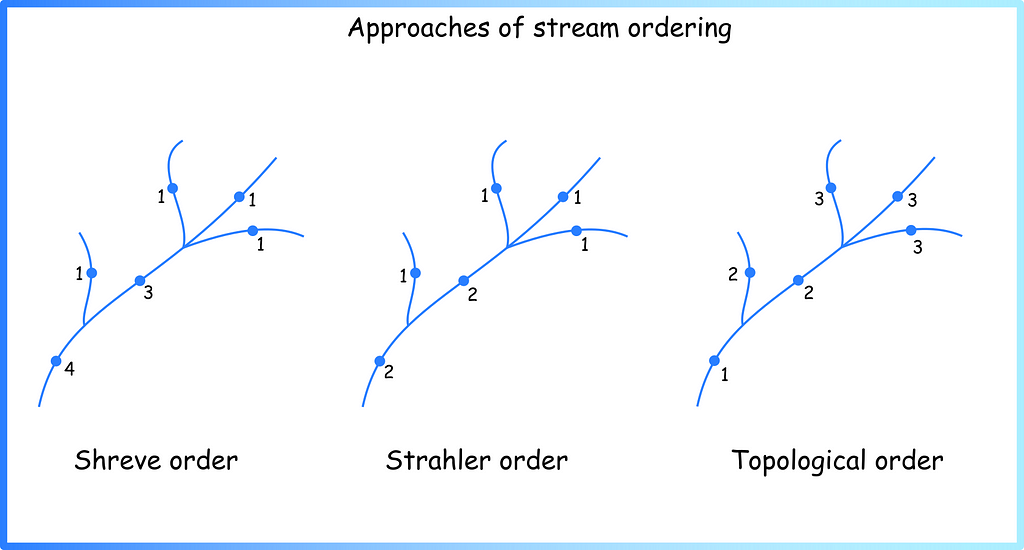
Now we can see that the picture resembles the map from the beginning of the article (Figure 1b). But the question arises: what principle can be used to assign such values? — the answer is: a lot. There are several generally accepted systems for ranking watercourses in hydrology — see the Stream order wiki page or paper Stream orders. Below are a few approaches that I have used myself during the work (Figure 4).
For what reason
Now it is time to answer the question of the purpose of such ranking systems. We can distinguish two reasons:
- Visualisation — using rank as an attribute of the size of a linear object on the map, it is possible to create nice maps (Figure 1);
- Further analysis.
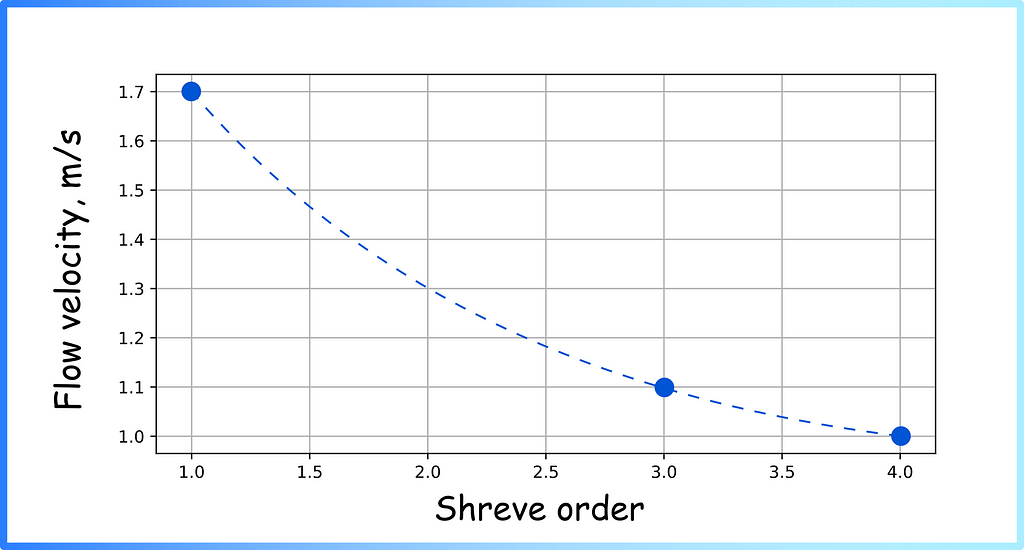
Knowledge of river network structure can be combined with other characteristics for further analysis, e.g. to identify the following patterns (Figure 5).
How to assign stream orders using existing tools
It is difficult to rank large systems manually, so specialised tools have been created for stream ordering. There are two fundamentally different ways:
- Stream ordering using raster data (digital elevation model);
- Stream ordering on vector layers.
Above, we have described how we can assign ranks to vector layers. However, spatial data are often represented in another format — as rasters (matrices) (Figure 6). Digital elevation models (matrices where each pixel has a specific size, such as 90 by 90 metres, for example, and an elevation value above the sea level surface that is stored in each cell of that matrix) are particularly commonly used.
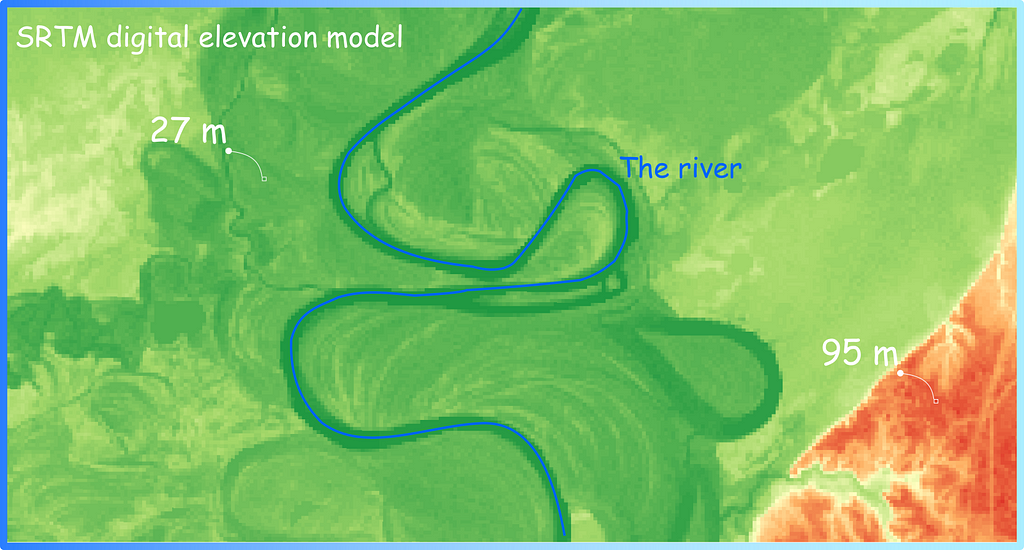
The raster layer (digital elevation model — DEM) is used to calculate the flow direction matrix and flow accumulation. The Stream Order (Spatial Analyst) tool in ArcGIS, for example, works according to this principle. In this post I will not describe in detail how such an algorithm works, as there are quite nice visualisations and descriptions in the official documentation (please check Flow Direction function page if you want to know more). Below I have listed some of the tools you can use to get an Strahler order using raster data:
- ArcGIS: Stream Order from a Digital Elevation Model (DEM) using ArcGIS;
- QGIS: Calculate Strahler Stream Orders in QGIS;
- GRASS: r.stream.order tool.
However, this all requires a lot of raster data manipulation. What should you do if you already have a vector layer? (This can happen if you have, for example, a vector layer of the river network loaded from OpenStreetMap.) I’ll tell you next!
How to obtain Shreve, Strahler and Topological order on vector layer using QGIS
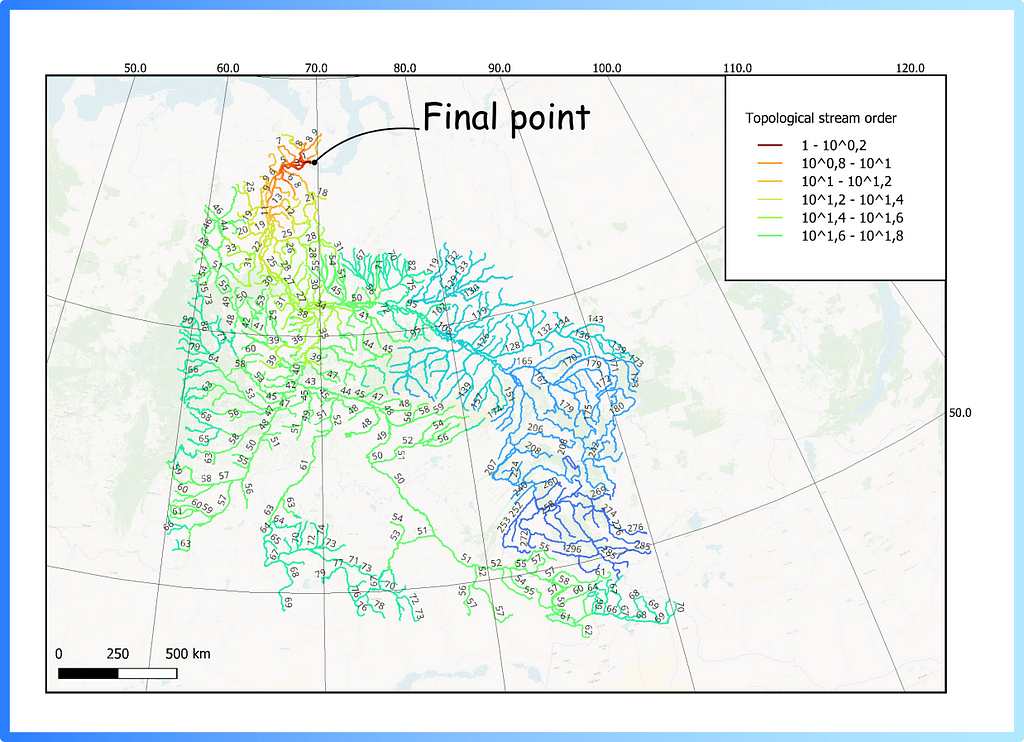
During our work four years ago, my colleagues and I came up with an algorithm that allows us to calculate Shreve, Strahler, and Topological order based only on the vector layer and the final point (the point where the river system ends and flows into a lake / sea / ocean). The first version of the algorithm is described in my first article on medium: “The Algorithm for Ranking the Segments of the River Network for Geographic Information Analysis Based on Graphs” (wiping away a tear of nostalgia). Recently, I finally got around to writing some clearer documentation for it and preparing a plugin update.
In QGIS for stream ordering, the Lines Ranking plugin can be used. To use, it will require loading a vector layer, reprojecting it into the desired metric projection, and assigning a final point (you can just click on the map) — the following result will be obtained (Figure 7).
Now you, dear reader, have dived a little deeper into the topic of stream ordering in hydrology and learned how to use different tools to get it from raw data (raster or vector). Once there is information about the river’s structure, you can prepare beautiful and clear visualisations, or continue the analysis by combining the obtained information with other characteristics.
Useful links:
- Lines ranking plugin documentation: https://linesranking.readthedocs.io/en/latest
- Repository with source code of the plugin: https://github.com/ChrisLisbon/QGIS_LinesRankingPlugin
The talk on stream ordering in hydrology was presented by Mikhail Sarafanov
Stream Ordering: How And Why a Geo-scientist Sometimes Needed to Rank Rivers on a Map was originally published in Towards Data Science on Medium, where people are continuing the conversation by highlighting and responding to this story.
Originally appeared here:
Stream Ordering: How And Why a Geo-scientist Sometimes Needed to Rank Rivers on a Map
