Sony has officially launched the mainnet of Soneium, its Ethereum layer-2 blockchain, according to a Jan. 14 statement shared with CryptoSlate. Soneium leverages the OP Stack infrastructure developed by the Optimism Foundation and prioritizes streamlined blockchain experiences. Its ecosystem includes Sony’s NFT-focused fan engagement platform, created by SNFT Inc., and the Soneium Spark incubator to […]
A whale withdrew 5.64 million ai16z tokens, valued at $6.37 million, from Gate.io.
On-chain data revealed an increase in active ai16z wallet addresses by 12% over the past week, reflecting gr
In 2024, Gate, one of the world’s leading digital asset trading platforms, experienced a year of rapid growth and deep innovation. Through sharp industry insights, innovative product strategies, a
Fire Token has announced the launch of its presale for a tokenized Bitcoin mining operation, designed to leverage Canada’s low energy costs to optimize operational efficiency. With electricity rates a
LTHs are unloading BTC, locking in massive gains as Bitcoin soared from $44k to $100k in just a year
Now, the laws of economics take over – high supply meets high demand
In the fast-changing world of cryptocurrencies, attention often jumps quickly from one token to another based on how they perform, what investors think, and market changes. PEPE ‒ once loved by meme
In A/B testing, you often have to balance statistical power and how long the test takes. Learn how Allocation, Effect Size, CUPED & Binarization can help you.
Image by author
In A/B testing, you often have to balance statistical power and how long the test takes. You want a strong test that can find any effects, which usually means you need a lot of users. This makes the test longer to get enough statistical power. But, you also need shorter tests so the company can “move” quickly, launch new features and optimize the existing ones.
Luckily, test length isn’t the only way to achieve the desired power. In this article, I’ll show you other ways analysts can reach the desired power without making the test longer. But before getting into business, a bit of a theory (’cause sharing is caring).
Statistical Power: Importance and Influential Factors
Statistical inference, especially hypothesis testing, is how we evaluate different versions of our product. This method looks at two possible scenarios: either the new version is different from the old one, or they’re the same. We start by assuming both versions are the same and only change this view if the data strongly suggests otherwise.
However, mistakes can happen. We might think there’s a difference when there isn’t, or we might miss a difference when there is one. The second type of mistake is called a Type II error, and it’s related to the concept of statistical power. Statistical power measures the chance of NOT making a Type II error, meaning it shows how likely we are to detect a real difference between versions if one exists. Having high power in a test is important because low power means we’re less likely to find a real effect between the versions.
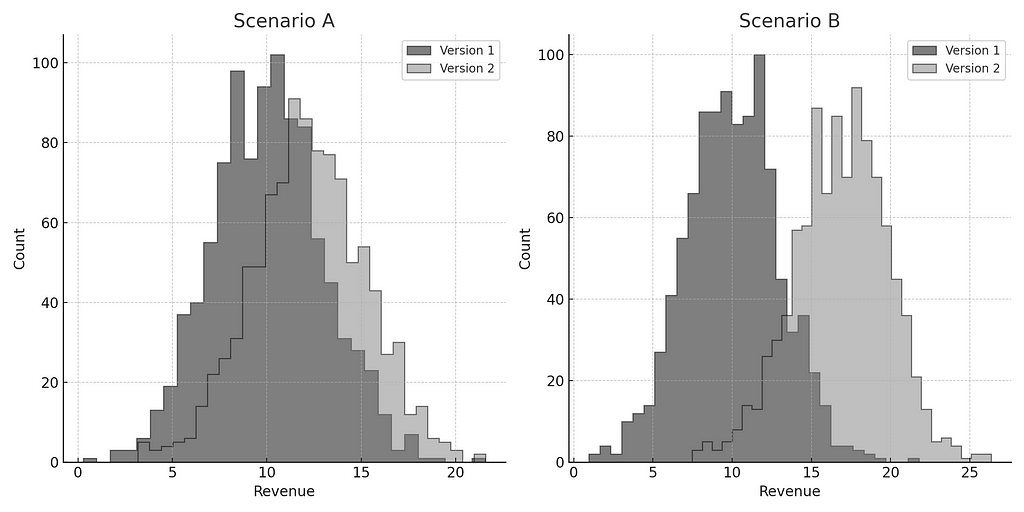
There are several factors that influence power. To get some intuition, let’s consider the two scenarios depicted below. Each graph shows the revenue distributions for two versions. In which scenario do you think there is a higher power? Where are we more likely to detect a difference between versions?
Image by author
The key intuition about power lies in the distinctness of distributions. Greater differentiation enhances our ability to detect effects. Thus, while both scenarios show version 2’s revenue surpassing version 1’s, Scenario B exhibits higher power to discern differences between the two versions. The extent of overlap between distributions hinges on two primary parameters:
Variance: Variance reflects the diversity in the dependent variable. Users inherently differ, leading to variance. As variance increases, overlapping between versions intensifies, diminishing power.
Effect size: Effect size denotes the disparity in the centers of the dependent variable distributions. As effect size grows, and the gap between the means of distributions widens, overlap decreases, bolstering power.
So how can you keep the desired power level without enlarging sample sizes or extending your tests? Keep reading.
Allocation
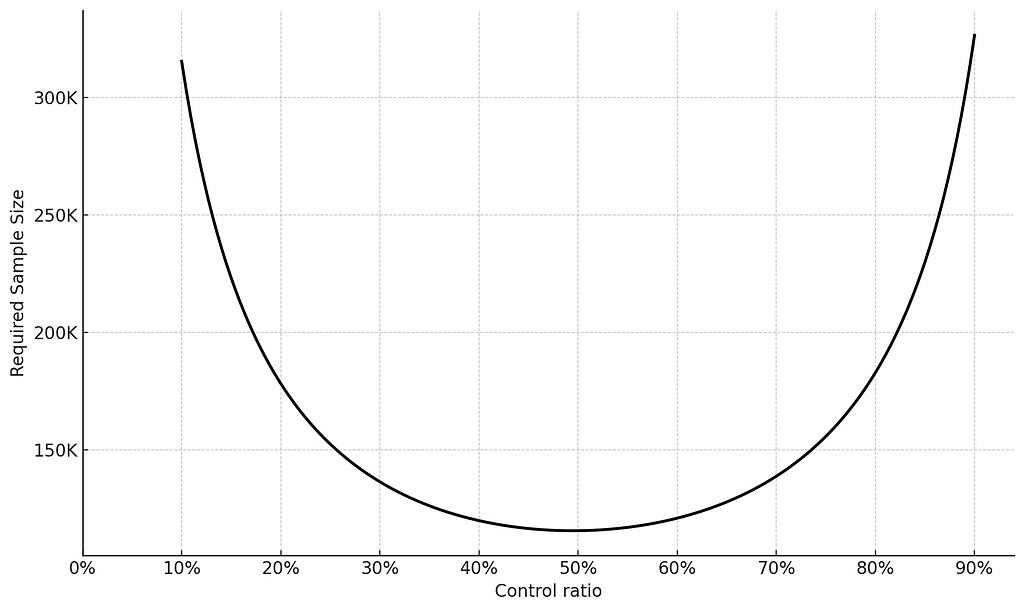
When planning your A/B test, how you allocate users between the control and treatment groups can significantly impact the statistical power of your test. When you evenly split users between the control and treatment groups (e.g., 50/50), you maximize the number of data points in each group within a necessary time-frame. This balance helps in detecting differences between the groups because both have enough users to provide reliable data. On the other hand, if you allocate users unevenly (e.g., 90/10), the group with fewer users might not have sufficient data to show a significant effect within the necessary time-frame, reducing the test’s overall statistical power.
To illustrate, consider this: if an experiment requires 115K users with a 50%-50% allocation to achieve power level of 80%, shifting to a 90%-10% would require 320K users, and therefore would extend the experiment run-time to achieve the same power level of 80%.
Image by author
However, allocation decisions shouldn’t ignore business needs entirely. Two primary scenarios may favor unequal allocation:
When there’s concern that the new version could harm company performance seriously. In such cases, starting with unequal allocation, like 90%-10%, and later transitioning to equal allocation is advisable.
During one-time events, such as Black Friday, where seizing the treatment opportunity is crucial. For example, treating 90% of the population while leaving 10% untreated allows learning about the effect’s size.
Therefore, the decision regarding group allocation should take into account both statistical advantages and business objectives, with keeping in mind that equal allocation leads to the most powerful experiment and provides the greatest opportunity to detect improvements.
Effect Size
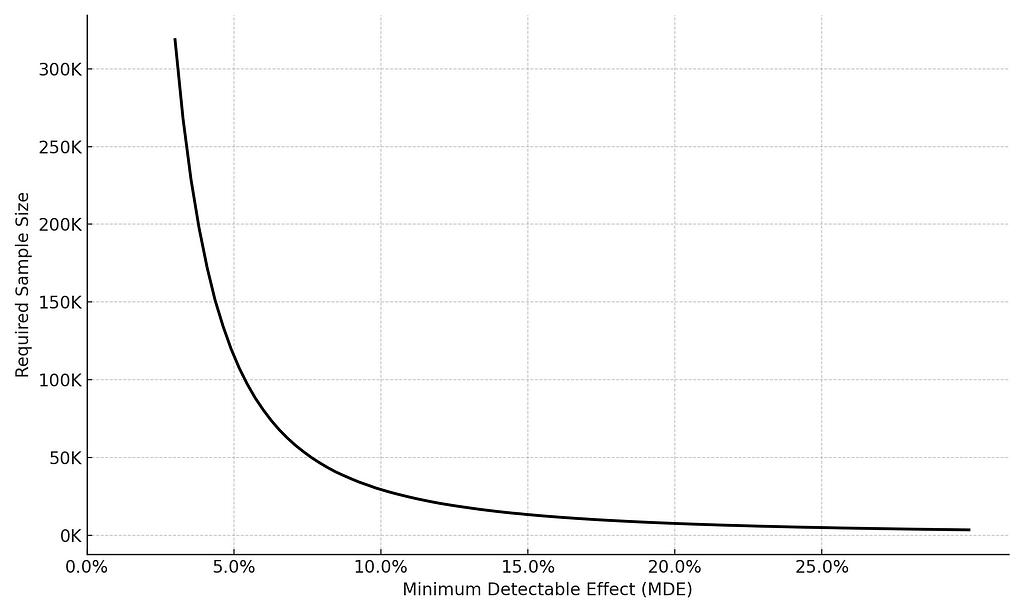
The power of a test is intricately linked to its Minimum Detectable Effect (MDE): if a test is designed towards exploring small effects, the likelihood of detecting these effects will be small (resulting in low power). Consequently, to maintain sufficient power, data analysts must compensate for small MDEs by augmenting the test duration.
This trade-off between MDE and test runtime plays a crucial role in determining the required sample size to achieve a certain level of power in the test. While many analysts grasp that larger MDEs necessitate smaller sample sizes and shorter runtimes (and vice versa), they often overlook the nonlinear nature of this relationship.
Why is this important? The implication of a nonlinear relationship is that any increase in the MDE yields a disproportionately greater gain in terms of sample size. Let’s put aside the math for a sec. and take a look at the following example: if the baseline conversion rate in our experiment is 10%, an MDE of 5% would require 115.5K users. In contrast, an MDE of 10% would only require 29.5K users. In other words, for a twofold increase in the MDE, we achieved a reduction of almost 4 times in the sample size! In your face, linearity.
Image by author
Practically, this is relevant when you have time constraints. AKA always. In such cases, I suggest clients consider increasing the effect in the experiment, like offering a higher bonus to users. This naturally increases the MDE due to the anticipated larger effect, thereby significantly reducing the required experiment’s runtime for the same level of power. While such decisions should align with business objectives, when viable, it offers a straightforward and efficient means to ensure experiment power, even under runtime constraints.
Variance reduction (CUPED)
One of the most influential factors in power analysis is the variance of the Key Performance Indicator (KPI). The greater the variance, the longer the experiment needs to be to achieve a predefined power level. Thus, if it is possible to reduce variance, it is also possible to achieve the required power with a shorter test’s duration.
One method to reduce variance is CUPED (Controlled-Experiment using Pre-Experiment Data). The idea behind this method is to utilize pre-experiment data to narrow down variance and isolate the variant’s impact. For a bit of intuition, let’s imagine a situation (not particularly realistic…) where the change in the new variant causes each user to spend 10% more than they have until now. Suppose we have three users who have spent 100, 10, 1 dollars so far. With the new variant, these users will spend 110, 11, 1.1 dollars. The idea of using past data is to subtract the historical data for each user from the current data, resulting in the difference between the two, i.e., 10, 1, 0.1. We do not need to get into the detailed computation to see that variance is much higher for the original data compared to the difference data. If you insist, we would reveal that we actually reduced variance by a factor of 121 just by using data we have already collected!
In the last example, we simply subtracted the past data for each user from the current data. The implementation of CUPED is a bit more complex and takes into account the correlation between the current data and the past data. In any case, the idea is the same: by using historical data, we can narrow down inter-user variance and isolate the variance caused by the new variant.
To use CUPED, you need to have historical data on each user, and it should be possible to identify each user in the new test. While these requirements are not always met, from my experience, they are quite common in some companies and industries, e.g. gaming, SAAS, etc. In such cases, implementing CUPED can be highly significant for both experiment planning and the data analysis. In this method, at least, studying history can indeed create a better future.
Binarization
KPIs broadly fall into two categories: continuous and binary. Each type carries its own merits. The advantage of continuous KPIs is the depth of information they offer. Unlike binary KPIs, which provide a simple yes or no, continuous KPIs have both quantitative and qualitative insights into the data. A clear illustration of this difference can be seen by comparing “paying user” and “revenue.” While paying users yield a binary result — paid or not — revenue unveils the actual amount spent.
But what about the advantages of a binary KPI? Despite holding less information, its restricted range leads to smaller variance. And if you’ve been following till now, you know that reduced variance often increases statistical power. Thus, deploying a binary KPI requires fewer users to detect the effect with the same level of power. This can be highly valuable when there are constraints on the test duration.
So, which is superior — a binary or continuous KPI? Well, it’s complicated.. If a company faces constraints on experiment duration, utilizing a binary KPI for planning can offer a viable solution. However, the main concern revolves around whether the binary KPI would provide a satisfactory answer to the business question. In certain scenarios, a company may decide that a new version is superior if it boosts paying users; in others, it might prefer basing the version transition on more comprehensive data, such as revenue improvement. Hence, binarizing a continuous variable can help us manage the limitations of an experiment duration, but it demands judicious application.
Conclusions
In this article, we’ve explored several simple yet potent techniques for enhancing power without prolonging test durations. By grasping the significance of key parameters such as allocation, MDE, and chosen KPIs, data analysts can implement straightforward strategies to elevate the effectiveness of their testing endeavors. This, in turn, enables increased data collection and provides deeper insights into their product.
We use cookies on our website to give you the most relevant experience by remembering your preferences and repeat visits. By clicking “Accept”, you consent to the use of ALL the cookies.
This website uses cookies to improve your experience while you navigate through the website. Out of these, the cookies that are categorized as necessary are stored on your browser as they are essential for the working of basic functionalities of the website. We also use third-party cookies that help us analyze and understand how you use this website. These cookies will be stored in your browser only with your consent. You also have the option to opt-out of these cookies. But opting out of some of these cookies may affect your browsing experience.
Necessary cookies are absolutely essential for the website to function properly. These cookies ensure basic functionalities and security features of the website, anonymously.
Cookie
Duration
Description
cookielawinfo-checkbox-analytics
11 months
This cookie is set by GDPR Cookie Consent plugin. The cookie is used to store the user consent for the cookies in the category "Analytics".
cookielawinfo-checkbox-functional
11 months
The cookie is set by GDPR cookie consent to record the user consent for the cookies in the category "Functional".
cookielawinfo-checkbox-necessary
11 months
This cookie is set by GDPR Cookie Consent plugin. The cookies is used to store the user consent for the cookies in the category "Necessary".
cookielawinfo-checkbox-others
11 months
This cookie is set by GDPR Cookie Consent plugin. The cookie is used to store the user consent for the cookies in the category "Other.
cookielawinfo-checkbox-performance
11 months
This cookie is set by GDPR Cookie Consent plugin. The cookie is used to store the user consent for the cookies in the category "Performance".
viewed_cookie_policy
11 months
The cookie is set by the GDPR Cookie Consent plugin and is used to store whether or not user has consented to the use of cookies. It does not store any personal data.
Functional cookies help to perform certain functionalities like sharing the content of the website on social media platforms, collect feedbacks, and other third-party features.
Performance cookies are used to understand and analyze the key performance indexes of the website which helps in delivering a better user experience for the visitors.
Analytical cookies are used to understand how visitors interact with the website. These cookies help provide information on metrics the number of visitors, bounce rate, traffic source, etc.
Advertisement cookies are used to provide visitors with relevant ads and marketing campaigns. These cookies track visitors across websites and collect information to provide customized ads.