According to a Sept. 3 statement, 21.co, the parent company of 21Shares, has introduced its Wrapped Bitcoin product (21BTC) on the Ethereum blockchain. The company stated that it was collaborating with Flow Traders, a leading global market maker, to launch a product that would give customers “peace of mind as they explore decentralized applications and […]
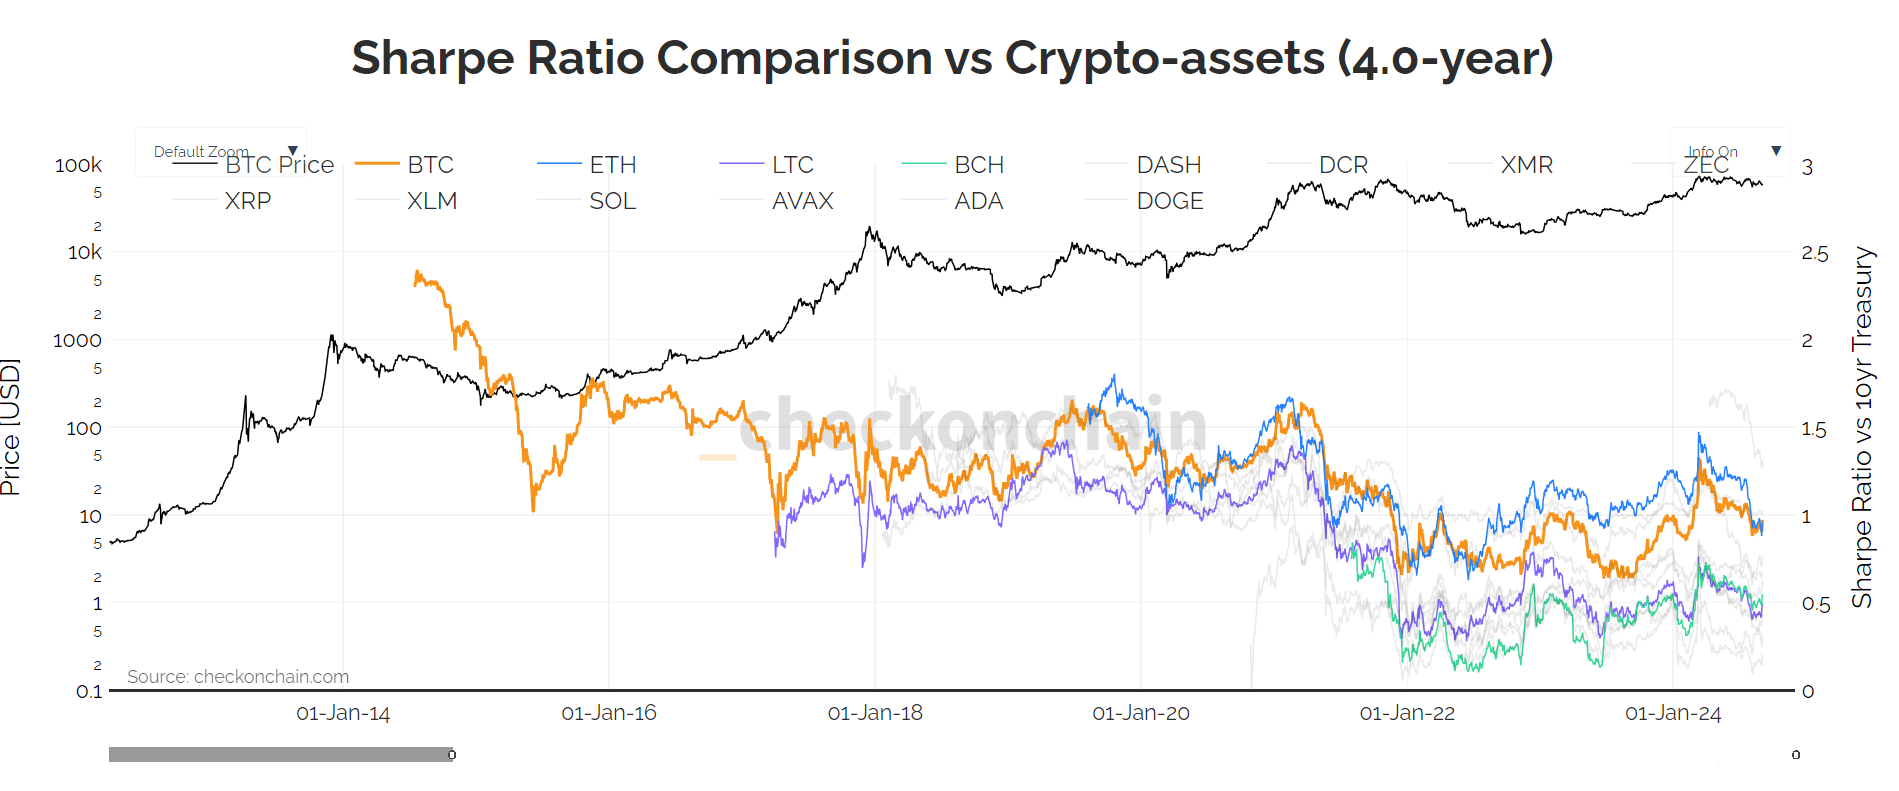
Quick Take The Sharpe ratio is a key financial metric used to evaluate an investment’s risk-adjusted return. It helps investors understand how much return they are receiving for the risk taken. It is calculated by dividing the difference between an investment’s return and the risk-free rate by the investment’s standard deviation (a measure of risk […]
Binance CEO Richard Teng has condemned the Nigerian government for its harsh treatment of Tigran Gambaryan—the detained American executive of the exchange who the authorities have held since February. In a Sept. 3 post on X, Teng highlighted a viral video showing Gambaryan struggling to walk into a courtroom and stated: “This inhumane treatment of […]
XRP has seen a 3% price increase in early September, sparking bullish sentiment among analysts.
Despite the positive outlook, declining active addresses raise questions about the sustainability
Customizable R package for Graph / Network visualization
Clinical Flowchart
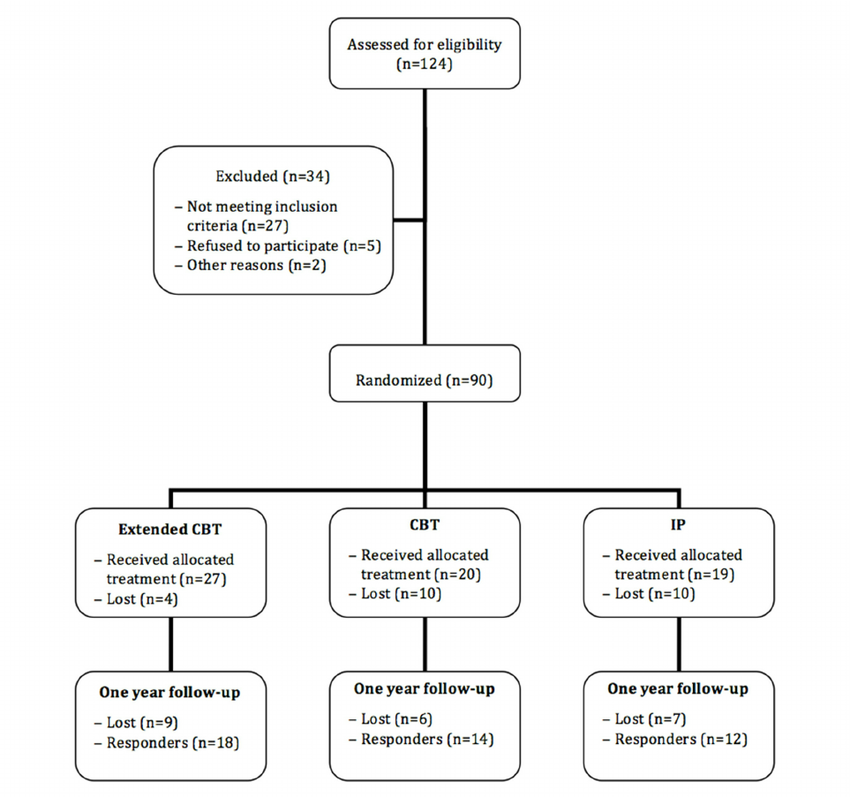
A Clinical (Trial) Flowchart is a visual representation of each step and procedure in a clinical trial or treatment process.
It starts with patients, lists which therapeutic methods are used, which patients are excluded from the trial and for what reason, how the groups are assigned, and so on, and looks like the example below.
Exclude 34 patients due to ineligibility or declining to participate
The remaining 90 patients are randomly assigned to a group (Extended CBT, CBT, IP) to compare treatments.
In each group, 4, 10, and 10 people drop out of the course (although ideally 30 people would be split), and the rest receive the assigned treatment.
When the patients were followed up after 1 year, 9, 6, and 7 were unresponsive, respectively.
The trial started with 124 patients and ended up with only 44 patients, which shows how difficult and expensive clinical trials can be.
Anyway, there is no set way to draw this flowchart, and you can use any commercial software such as PowerPoint or Keynote, or web-based diagramming tools such as draw.io or lucidchart.
Clinical Flowchart with R
I don’t know exactly why, but this time I needed to use R to plot the chart.
The advantages of using a programming approach like R include automation and reuse, integration with other functions (e.g., a program that plots from data source to chart), and a level of customization not available in commercial programs.
Since the original purpose of the package was to draw participant flow diagrams, this is the closest I could get to what I was trying to achieve. I think it’s the best choice unless you have special circumstances.
R package for network visualization graphs based on vis.js.
However, as it turns out, all four methods failed.
This is because there was a special situation with the figure I was trying to draw.
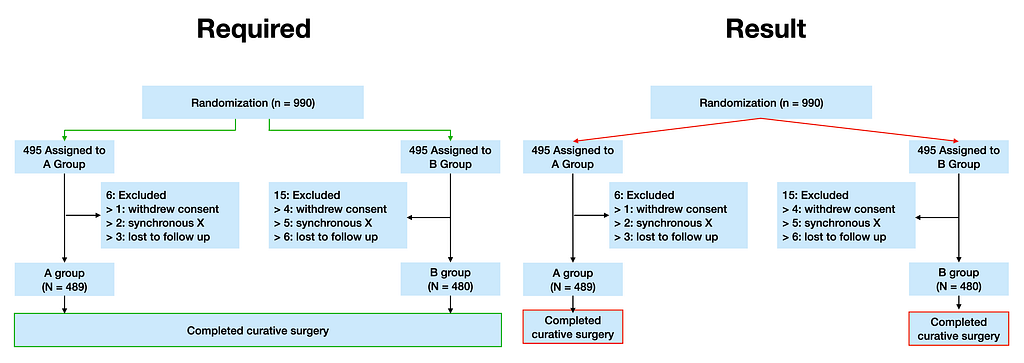
The following figure shows the actual drawing, with only the numbers and groups replaced with 1000, 1,2,3… A, B.
Image by the author
There were two problematic parts: the Completed curative surgery part in the middle, where the two nodes from the previous step connect to one long node, and the difficulty of positioning the edge.
Image by the author
I considered several ways to do this, and eventually decided to use an old friend, shinyCyJS, which I can customize to my purpose.
shinyCyJSis a R package to leverage the network/graph visualization capabilities of cytoscape.js in R. It was the first thing I wrote when I was looking for genomic network visualization when I graduated (at the time, there was only igraph and RCyjs) and didn’t find what I was looking for, which is how I ended up at my current job.
2 Custom feature with shinyCyJS
Positioning Edges
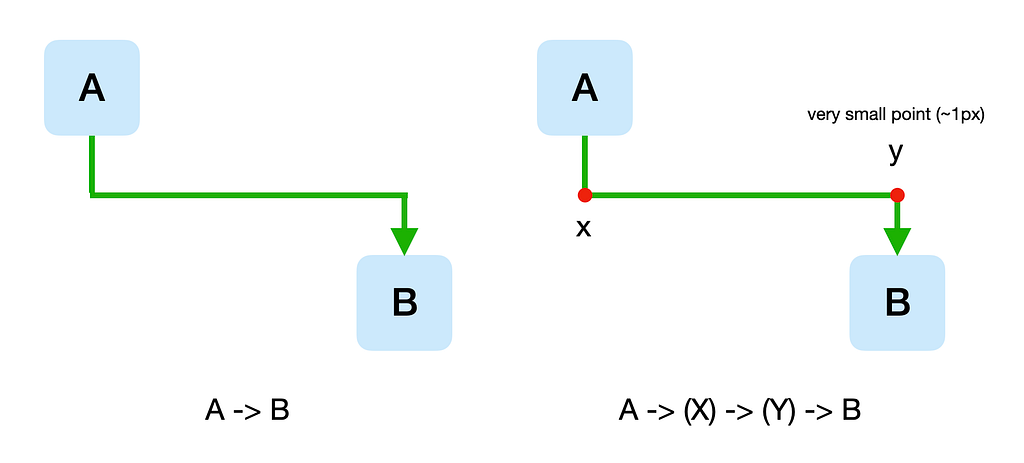
In order to implement the positioning of the edges in the two custom features above, I initially tried to use taxi edges.
However, again, this only determines the edge based on the position of the node, and it is not possible to move the edge, so I switched to adding a microscopic node in the middle and traversing the edge to it, as shown below (since it is possible to specify the position of the “micro” node).
Image by the author
One Big Node
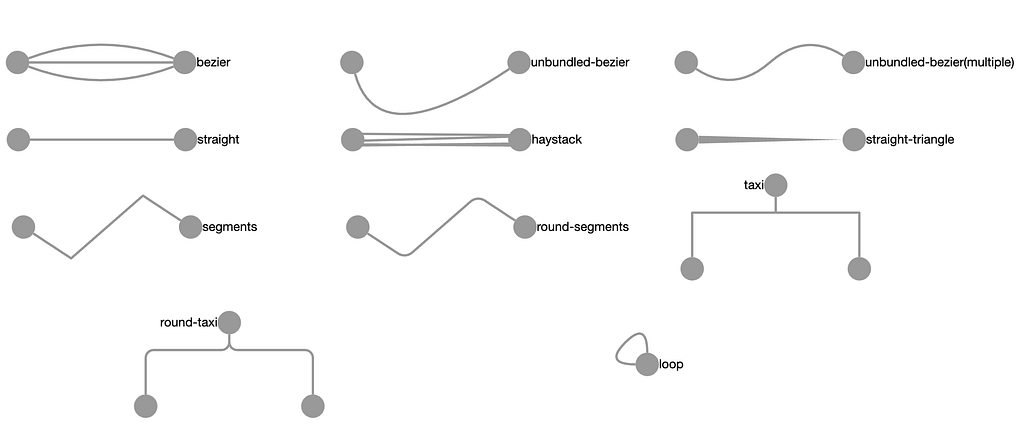
In cytoscape.js, by default, nodes are connected by edges that consider the shortest distance between the center and the center, and if they go through other points along the way, like the taxi mentioned above, the points are not specified and are calculated algorithmically.
The problem with allowing intermediate points to be specified is that when there are multiple edges between nodes, like in the bezier and haystack examples, it is annoying to have to specify intermediate points for all of them.
In the previous example, there are only three edges, so it’s not a big deal, but in the case of genomic networks, which I studied in graduate school, a single gene often interacts with dozens or hundreds of other genes, so it’s a big deal.
In the worst case scenario, the edges overlap and missing a few edges can cause the graph to produce completely different information.
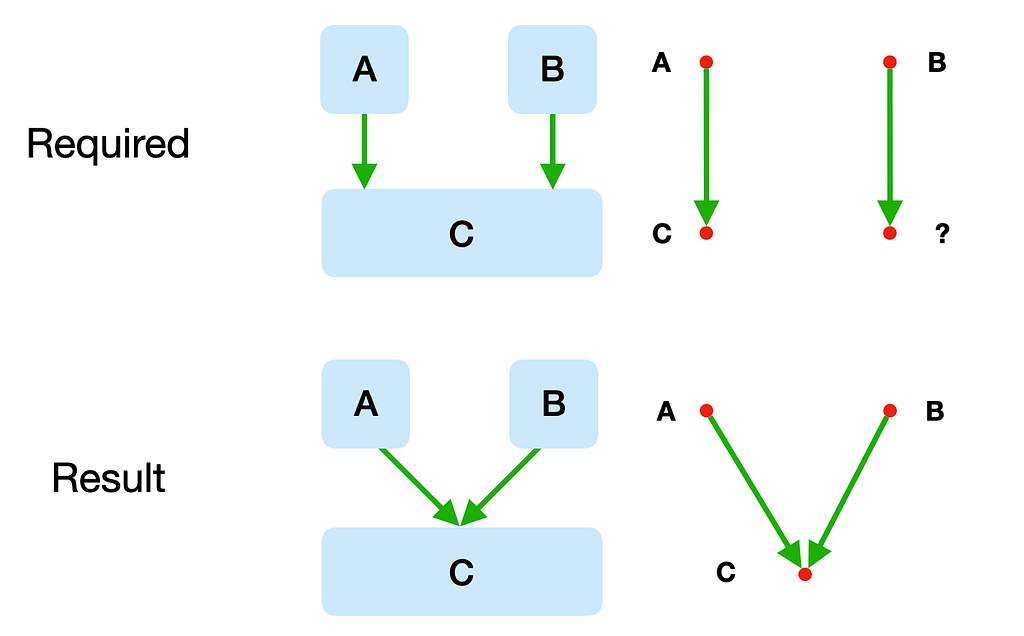
In other words, in the problem of connecting to one long node, the long node is only a graphical (width) perspective for the user,
But from the computer’s point of view, it is irrational behavior to connect an edge to a node that doesn’t even exist, as shown in the image below, so there is no reason to consider this option in the first place.
Image by the author
To solve this problem, I created a micro node and modified it to connect to the appropriate part, just like the previous edge midpoint problem.
Image by the author
Here is a partial view of the graph I ended up creating in R. (Again, groups and numbers are arbitrarily modified)
Image by the author
Another problem, download as PNG
Technically, you can use the Export as PNG button in Rstudio viewer as shown below, and if that doesn’t work, you can take a screenshot, but cytoscape.js has a function to save the graph as png, so I used it.
Image by the author
*I actually had a request to add a download to png feature to shinyCyJS a while back, and I replied “why not just take a screenshot?”.
This required using an internet browser (chrome) (As cytoscape.js is Javascript) and that meant I had to go beyond R and implement it on the web using Shiny.
Of course, shinyCyJS is a package that was built with shiny integration in mind from the start, so it was no problem.
Below is the code you need to run in Chrome’s developer tools to download it
shinyCyJS is an R package I wrote, and it literally does everything cytoscape does, plus custom features like this if needed, so if you need to do network/graph visualization in R, you can try it out or ask for what you need.
Of course, if you don’t need to use R, draw.io seems better.
Additionally, if you want to package other Javascript libraries for use with R, you can send me an email.
ESIA, the association representing Europe’s semiconductor industry, has called for an “immediate Chips Act 2.0” — if the bloc is to maintain momentum in the global race for technological leadership. The group comprises major chipmakers such as NXP and Infineon as well as research organisations including imec and Fraunhofer. The EU’s Chips Act entered into force in September 2023. It aims to mobilise €43bn in public and private investments that will the help the bloc to produce 20% of the world’s semiconductors by 2030. In a statement on Monday, ESIA acknowledged the act as “a fundamental building block.” However, it…
It takes a special kind of person to decide to found a startup. The long hours require energy, devotion, and continuous motivation. In the beginning, you need to be a jack of all trades, able to understand and jump on parts of the business you may not be familiar with, until you have the capital to hire people who are better at those tasks. But founders are human just like the rest of us. Although they may seem superhuman at times, weaving through discussions on product development, marketing, and taking sales calls late into the night, at the end of…
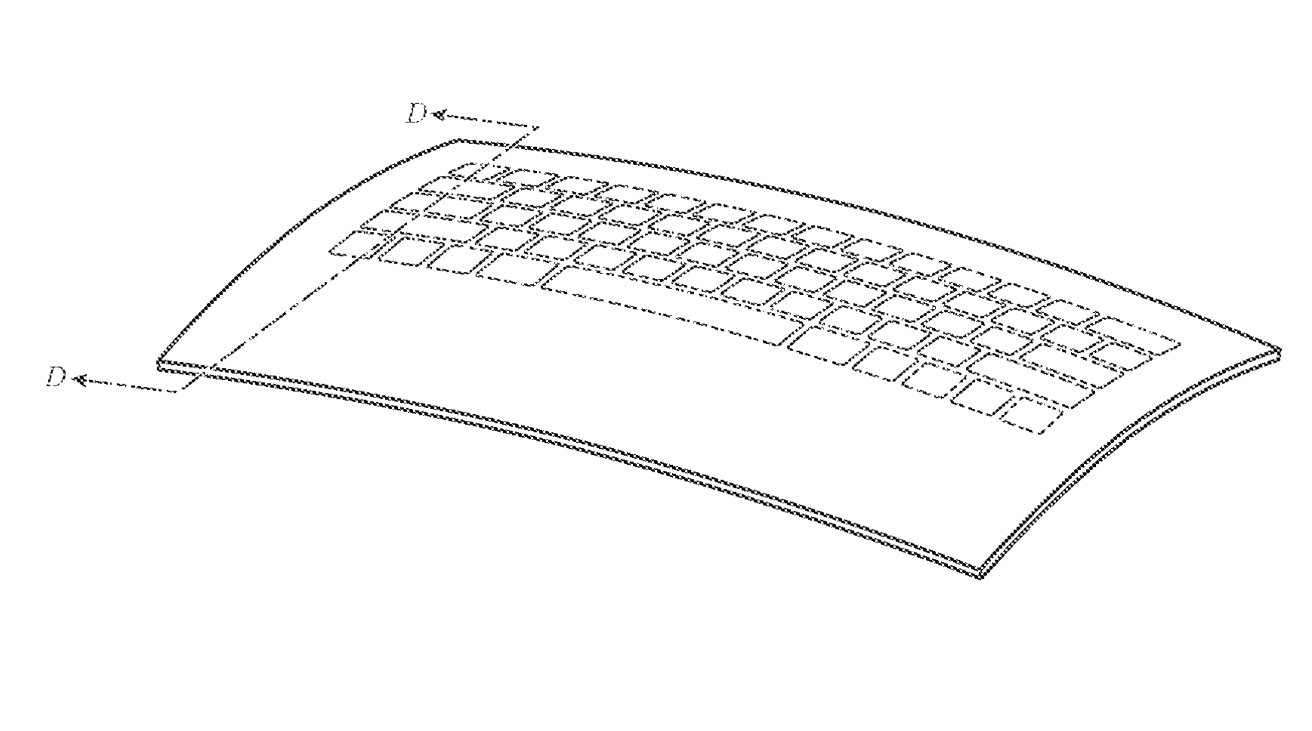
Apple looked at using single glass panels and touch-sensitive membranes when it was trying to solve its MacBook Pro butterfly keyboard problems, but the now newly-patented technology also solves dust and wear issues.
A glass keyboard could be flexible, and also have a display underneath
Due to their design, keyboards are able to be affected by elements gumming up the mechanism, preventing the keys from smoothly lowering and raising when pressed.
While old-fashioned keyboards are less susceptible, the chiclet-style notebook keyboards, like the ones used in the MacBook Pro lineup, may be prone. They can easily be stopped from working efficiently if dust, crumbs, or liquids enter under the keys and impact the mechanism.
We use cookies on our website to give you the most relevant experience by remembering your preferences and repeat visits. By clicking “Accept”, you consent to the use of ALL the cookies.
This website uses cookies to improve your experience while you navigate through the website. Out of these, the cookies that are categorized as necessary are stored on your browser as they are essential for the working of basic functionalities of the website. We also use third-party cookies that help us analyze and understand how you use this website. These cookies will be stored in your browser only with your consent. You also have the option to opt-out of these cookies. But opting out of some of these cookies may affect your browsing experience.
Necessary cookies are absolutely essential for the website to function properly. These cookies ensure basic functionalities and security features of the website, anonymously.
Cookie
Duration
Description
cookielawinfo-checkbox-analytics
11 months
This cookie is set by GDPR Cookie Consent plugin. The cookie is used to store the user consent for the cookies in the category "Analytics".
cookielawinfo-checkbox-functional
11 months
The cookie is set by GDPR cookie consent to record the user consent for the cookies in the category "Functional".
cookielawinfo-checkbox-necessary
11 months
This cookie is set by GDPR Cookie Consent plugin. The cookies is used to store the user consent for the cookies in the category "Necessary".
cookielawinfo-checkbox-others
11 months
This cookie is set by GDPR Cookie Consent plugin. The cookie is used to store the user consent for the cookies in the category "Other.
cookielawinfo-checkbox-performance
11 months
This cookie is set by GDPR Cookie Consent plugin. The cookie is used to store the user consent for the cookies in the category "Performance".
viewed_cookie_policy
11 months
The cookie is set by the GDPR Cookie Consent plugin and is used to store whether or not user has consented to the use of cookies. It does not store any personal data.
Functional cookies help to perform certain functionalities like sharing the content of the website on social media platforms, collect feedbacks, and other third-party features.
Performance cookies are used to understand and analyze the key performance indexes of the website which helps in delivering a better user experience for the visitors.
Analytical cookies are used to understand how visitors interact with the website. These cookies help provide information on metrics the number of visitors, bounce rate, traffic source, etc.
Advertisement cookies are used to provide visitors with relevant ads and marketing campaigns. These cookies track visitors across websites and collect information to provide customized ads.