BONK encounters significant resistance, which could potentially impede its rally.
Successfully breaking through this barrier could propel BONK to reach its March peak of 0.00003389.
BTC broke its 200-day moving average, turning previous resistance into potential new support, signaling a bullish trend.
Rising market sentiment towards greed and increased BTC withdrawals from
Few groups of people can be as challenging to understand as members of a National Congress. In almost any country in the world, the figure of the hypocritical politician is infamous among the population. Backroom dealings and beige envelopes are ever-present in political drama series. At the same time, they are one of the most crucial groups to comprehend, as their actions directly impact the country’s future.
To understand Congress, I will base myself on the popular saying — judge people by their actions, not words. Therefore, I will compare and group members of Congress based on their voting history. In this way, we can uncover obscure patterns and understand the true dynamic of a National Congress.
For this project, I will focus on my home country’s National Congress — Brazil’s Camara dos Deputados — but the method can be applied to any country.
Gathering Data
First of all, we need data.
I downloaded data on all the laws voted on and how each member of Congress voted from 2023 to 2024 up to May 18th. All the data is available at the Brazilian Congress’s open data portal. I then created two different pandas dataframes, one with all the laws voted on and another with how each congress member voted in each vote.
To the votacoes dataframe, I selected only the entries with idOrgao of 180, which means they were voted in the main chamber of Congress. So, we have the data for the votes of most congress members. Then I used this the list of the votacoes_Ids to filter the votacoes_votos_dep dataframe.
Now, in the votacoes_votos_dep, each vote is a row with the congress member’s name and the voting session ID to identify who and what the vote refers to. Therefore, I created a pivot table so that each row represents a congress member and each column refers to a vote, encoding Yes as 1 and No as 0 and dropping any vote where more than 280 deputies didn’t vote.
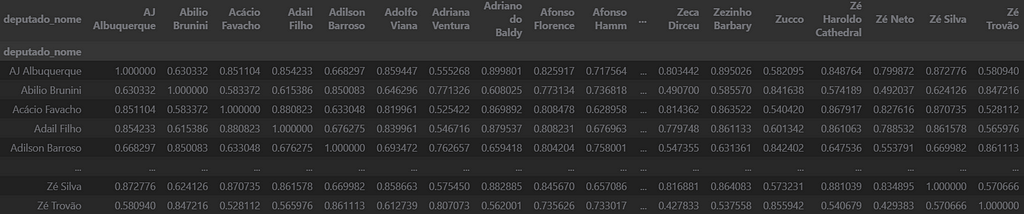
Before computing the similarity matrix, I filled all remaining NAs with 0.5 so as not to interfere with the positioning of the congress member. Finally, we compute the similarity between the vectors of each deputy using cosine similarity and store it in a dataframe.
Now, use the information about the voting similarities between congressmen to build a network using Networkx. A node will represent each member.
import networkx as nx

names = similarity_df.columns
# Create the graph as before
G = nx.Graph()
for i, name in enumerate(names):
    G.add_node(name)
Then, the edges connecting two nodes represent a similarity of at least 75% of the two congressmen’s voting behavior. Also, to address the fact that some congress members have dozens of peers with high degrees of similarity, I only selected the first 25 congressmen with the highest similarity to be given an edge.
threshold = 0.75
for i in range(len(similarity_matrix)):
    for j in range(i + 1, len(similarity_matrix)):
        if similarity_matrix[i][j] > threshold:
            # G.add_edge(names[i], names[j], weight=similarity_matrix[i][j])
            counter[names[i]].append((names[j], similarity_matrix[i][j]))
for source, target in counter.items():
    selected_targets = sorted(target, key=lambda x: x[1], reverse=True)[:26]
    for target, weight in selected_targets:
        G.add_edge(source, target, weight=weight)
To visualize the network, you need to decide the position of each node in the plane. I decided to use the spring layout, which uses the edges as springs holding nodes close while trying to separate. Adding a seed allows for reproducibility since it is a random process.
Well, it’s a good start. Different clusters of congressmen can be seen, which suggests that it accurately captures the political alignment and alliances in Congress. But it is a mess, and it is impossible to really discern what’s going on.
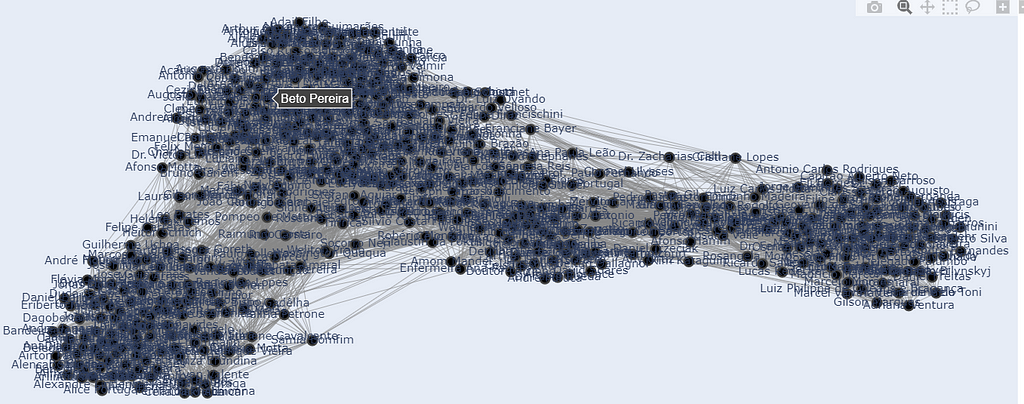
To improve the visualization, I made the name appear only when you hover over the node. Also, I colored the nodes according to the political parties and coalitions available on Congress’s site and sized them based on how many edges they are connected to.
Image by the Author
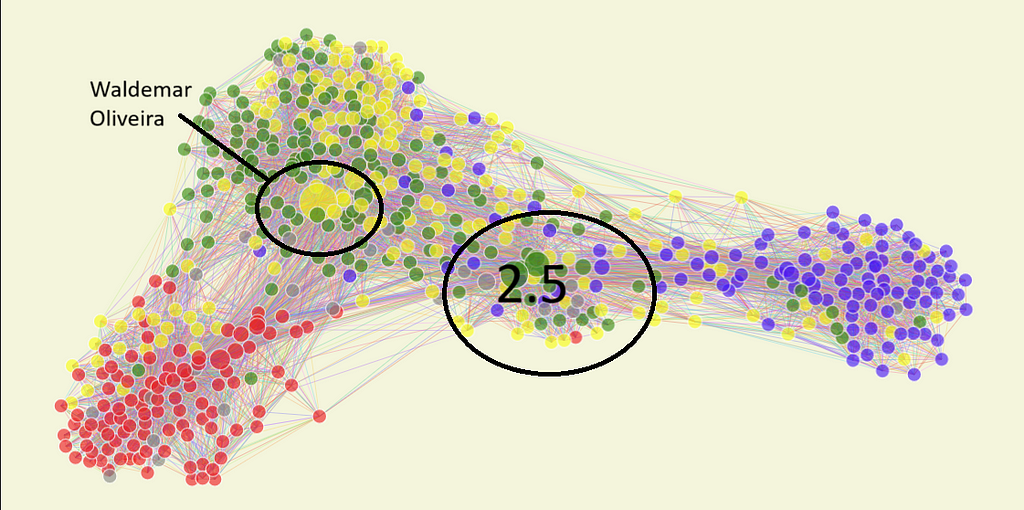
It’s a lot better. We have three clusters, with some nodes between them and a few bigger ones in each. Also, in each cluster, there is a majority of a particular color. Well, let’s dissect it.
Interpreting the Results
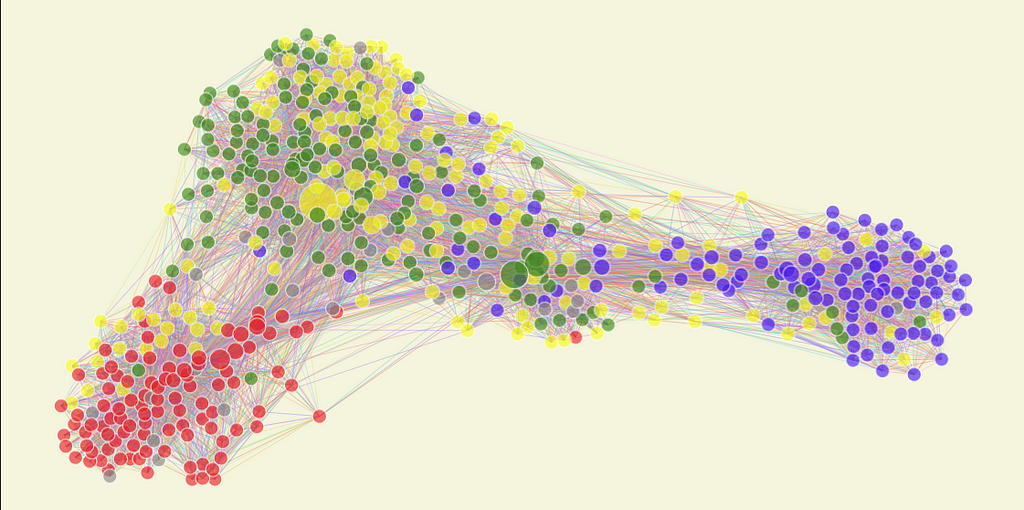
First of all, let me explain the colors. Red represents the base of the current left-wing government, so the congressmen of the party of the president or public allies, PT, PSOL, PCdoB, and others. Blue is the opposition led by PL, the party of the ex-president, and another right-wing party, NOVO.
Green and Yellow represent a phenomenon in Brazil’s politics called “Centrao” or “big center.” Centrao is compromised by non-aligned political parties that are always allied with the current government and trade their support for appointments to positions in government or public companies. The Yellow represents the group centered around UNIAO, Brazil’s biggest political party. Green is centered around MDB, a historical party that used to be in charge of most of the “Centrao.”
So, back to the graph:
Image by the Author
Group 1 seems to be mostly composed of red, the current government, and its closest allies. The yellow dots inside are mostly from AVNATE, which, despite publicly being in the same alliance as UNIAO, seems to be more politically aligned with the left.
Another interesting dynamic the network model captures is the grouping of specific parties and ideologies inside each more extensive community. In group 1, right below the base of the number 1, seven nodes are very close to each other. They represent the congress members from PSOL, a radical left party. It’s interesting to see that even inside the left-wing block, they are represented in a sort of sub-group in the network.
Group 2 seems to be mostly compromised from what we can call “Centrao,” as explained before. As always, they are part of the government’s base; they are closer to group 1 than 3, and we can see a mix of Green and yellow, as expected, and some Blue dots. That means many members of Congress who should be in the opposition vote similarly to the government. Why? Well, PL, the current “opposition” party, used to be an average “Centrao” party. Hence, historical members still behave like the average “Centrao”.
Notably, we have the biggest nodes in group 2. One is yellow and represents Waldemar Oliveira, the leader of the government in the house. He is relevant in Congress, as a big part of it votes according to his directives. The other two biggest nodes are also in group 2, but in what I call group 2.5.
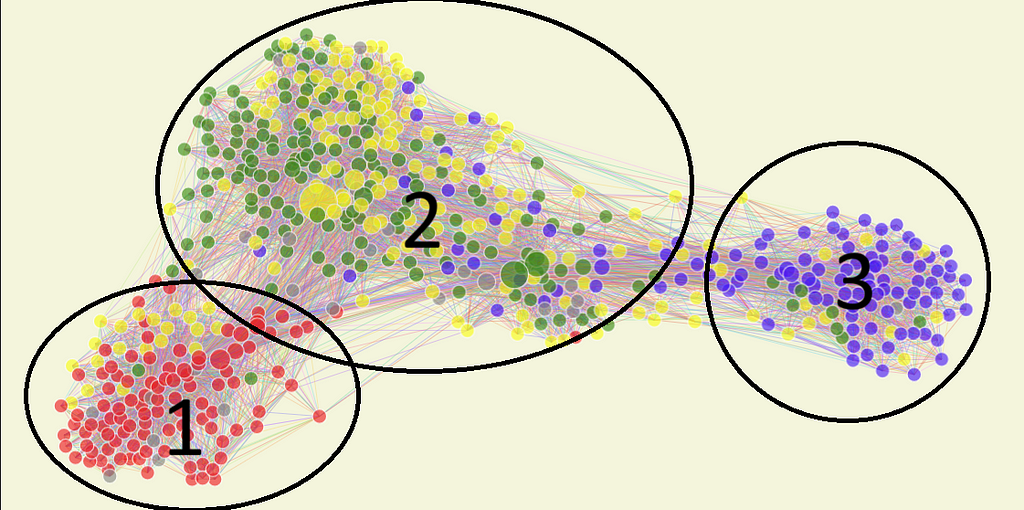
Image by the Author
The reason behind Group 2.5’s behavior is beyond the article; to summarize, it is a group of congressmen who were elected identifying as “right-wing” but still behave more like “Centrao.” Only occasionally do they vote with the right, hence their proximity to Group 3, but whenever votes that interest Group 2 come up, they break away to vote with Group 2.
Finally, group 3 has a different distribution than the other two. It is the smallest one in Congress and is compromised overwhelmingly by PL deputies. It is more “spread out” as there are a lot of members between them and group 2, showing that they do not always vote together. At the same time, there are no oversized nodes, so no clear leader exerts influence on the whole block. This pattern makes sense and aligns with reality since the opposition hasn’t been able to achieve much success in the current Congress.
Conclusion
In conclusion, using networks to analyze the Brazilian Congress yielded valuable insights into political alignments and voting behaviors. Our visualization of voting patterns has revealed three distinct groups: the government’s base, the “Centrao,” and the opposition. The graph effectively illustrates the nuanced relationships between parties, exposing deviations from public stances and highlighting influential figures.
This data-driven approach enhances our understanding of political dynamics, providing a clear visual representation of the complex interplay within the legislative body. By utilizing such analytical tools, we can promote greater transparency in the political process and facilitate more informed discussions about a country’s political situation.
Now that the graph is ready, we can use it to answer questions like:
When does the Centrao vote with the government or the opposition?
Is there a connection between the importance of the network and spending on employees?
Is there a correlation between alignment in the network and geographival location?
If you liked the article and want to read other insights about politics analyzed with data science, follow me here, and don’t miss out. Thank you for reading.
Let me know in the comments what you think of this methodology to analyze political dynamics and if I did anything wrong.
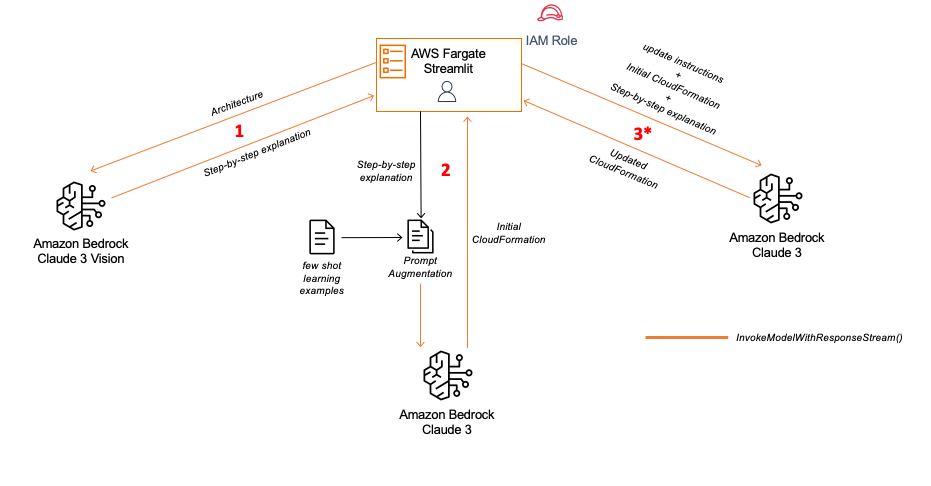
In this post, we explore some ways you can use Anthropic’s Claude 3 Sonnet’s vision capabilities to accelerate the process of moving from architecture to the prototype stage of a solution.
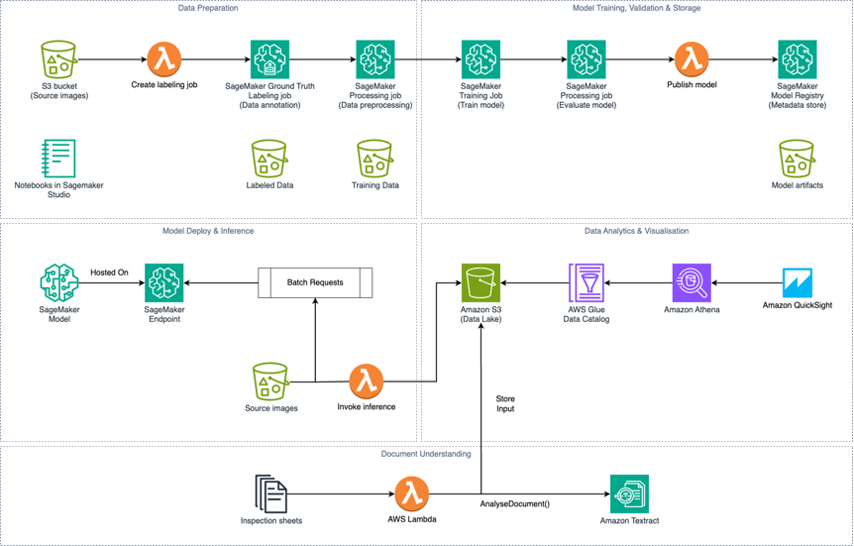
In this post, we share how Northpower has worked with their technology partner Sculpt to reduce the effort and carbon required to identify and remediate public safety risks. Specifically, we cover the computer vision and artificial intelligence (AI) techniques used to combine datasets into a list of prioritized tasks for field teams to investigate and mitigate.
We’re just weeks away from October Prime Day, but there are already countless deals on the latest iPhones, Samsung Galaxy phones, Google Pixels, and more.
OpenAI is reportedly telling investors that it plans on charging $22 a month to use ChatGPT by the end of the year. The company also plans to aggressively increase the monthly price over the next five years up to $44.
The documents obtained by The New York Times shows that OpenAI took in $300 million in revenue this August, and expects to make $3.7 billion in sales by the end of the year. Various expenses such as salaries, rent and operational costs will cause the company to lose $5 billion this year.
OpenAI is reportedly circulating the documents the NYT reported on as part of a drive to find new investors to prevent or lessen its financial shortfall. Fortunately, OpenAI is raising money on a $150 billion valuation, and a new round of investments could bring in as much as $7 billion.
OpenAI is also reportedly in the midst of switching from a non to for-profit company. The business model allows for the removal of any caps on investor returns so they’ll have more room to negotiate for new investors at possibly higher rates.
This article originally appeared on Engadget at https://www.engadget.com/ai/openai-reportedly-plans-to-increase-chatgpts-price-to-44-within-five-years-225413308.html?src=rss
Threads seems to be rolling out a new location tagging feature that allows users to add a location to their posts. Some users have reported seeing the change in Threads’ app, though it doesn’t seem to be available to everyone just yet.
The feature is similar to location tagging on Instagram. When you give Threads access to your location, you’ll see a list of nearby places to tag, though you can also manually search for a place. For example, I saw that a few users already jokingly tagged their posts as “hell.”
According to an in-app disclaimer from Meta, the company plans to use location sharing to better customize Threads by showing “personalized content” about places nearby. The change could help improve Threads’ search functionality, which still often falls short, and make the app slightly more useful for following breaking news and other timely events.
Threads
The change could also come in handy in the future when Meta finally flips the switch on advertising in Threads. Mark Zuckerberg has said the company plans to continue growing the service before bringing ads to the platform, but getting users’ consent to sharing locations would provide a crucial bit of information for the company’s ad machine.
Meta didn’t immediately respond to questions about the feature, but the company appears to still be rolling it out. Location sharing appeared for me in the Threads app, but then disappeared about an hour later. It doesn’t seem to be visible at all yet on the web version of Threads.
This article originally appeared on Engadget at https://www.engadget.com/social-media/threads-is-adding-location-location-sharing-to-posts-224114320.html?src=rss
We use cookies on our website to give you the most relevant experience by remembering your preferences and repeat visits. By clicking “Accept”, you consent to the use of ALL the cookies.
This website uses cookies to improve your experience while you navigate through the website. Out of these, the cookies that are categorized as necessary are stored on your browser as they are essential for the working of basic functionalities of the website. We also use third-party cookies that help us analyze and understand how you use this website. These cookies will be stored in your browser only with your consent. You also have the option to opt-out of these cookies. But opting out of some of these cookies may affect your browsing experience.
Necessary cookies are absolutely essential for the website to function properly. These cookies ensure basic functionalities and security features of the website, anonymously.
Cookie
Duration
Description
cookielawinfo-checkbox-analytics
11 months
This cookie is set by GDPR Cookie Consent plugin. The cookie is used to store the user consent for the cookies in the category "Analytics".
cookielawinfo-checkbox-functional
11 months
The cookie is set by GDPR cookie consent to record the user consent for the cookies in the category "Functional".
cookielawinfo-checkbox-necessary
11 months
This cookie is set by GDPR Cookie Consent plugin. The cookies is used to store the user consent for the cookies in the category "Necessary".
cookielawinfo-checkbox-others
11 months
This cookie is set by GDPR Cookie Consent plugin. The cookie is used to store the user consent for the cookies in the category "Other.
cookielawinfo-checkbox-performance
11 months
This cookie is set by GDPR Cookie Consent plugin. The cookie is used to store the user consent for the cookies in the category "Performance".
viewed_cookie_policy
11 months
The cookie is set by the GDPR Cookie Consent plugin and is used to store whether or not user has consented to the use of cookies. It does not store any personal data.
Functional cookies help to perform certain functionalities like sharing the content of the website on social media platforms, collect feedbacks, and other third-party features.
Performance cookies are used to understand and analyze the key performance indexes of the website which helps in delivering a better user experience for the visitors.
Analytical cookies are used to understand how visitors interact with the website. These cookies help provide information on metrics the number of visitors, bounce rate, traffic source, etc.
Advertisement cookies are used to provide visitors with relevant ads and marketing campaigns. These cookies track visitors across websites and collect information to provide customized ads.