Privacy tokens underwent nearly 60 delistings by centralized exchanges this year, a record since 2021, according to a recent Kaiko report. The report tracked Monero (XMR), Dash (DASH), Decred (DCR), Mask (MASK), Rose (ROSE), and Zcash (ZEC). XMR suffered the most delistings, with a 6x yearly increase, while DASH experienced the second-highest number of delistings. […]
A symmetrical triangle and ascending trendline hint at an upcoming bullish rebound for Ethereum.
Ethereum’s leverage ratio and open interest show key trends that could influence price movemen
Arbitrum is trading within an ascending triangle pattern with strong resistance at $0.62.
A decline in DeFi activity and whale inactivity could see prices continue rangebound trading.
Part of communicating the significance of your research is having figures that tell your story. Coding allows the investigator the opportunity to create applications that not only facilitate research, but generate figures that tell a unique story. The intention of this blog is to make code available that I have collected over the years which I have found to help me to tell better stories. I hope that others will not only be able to use the tools here to further their research, but to also tell really interesting stories in structural biology. The bottom line for me is that even if it isn’t as useful as I might hope, it is still a lot of fun to play around with!
Parsing PDB Files with Biopython
When creating protein structure network (PSN) visualizations, I typically begin by extracting key components from the Protein Data Bank (PDB) structure file using PDBParser from the Biopython package. For clarification, the PDB archive is a publicly accessible database that stores 3D structural data of biological molecules, such as proteins and nucleic acids, for use in scientific research and education. For the purpose of demonstration I am using the PDB structure 4PLD which is a human liver receptor homolog (LRH-1). It is worth noting that the workflow presented here is based on research conducted as part of a drug screening study on LRH-1. Note that you will need to update the line pdb_file = ‘7tt8.pdb’to match the path where your PDB file is stored.
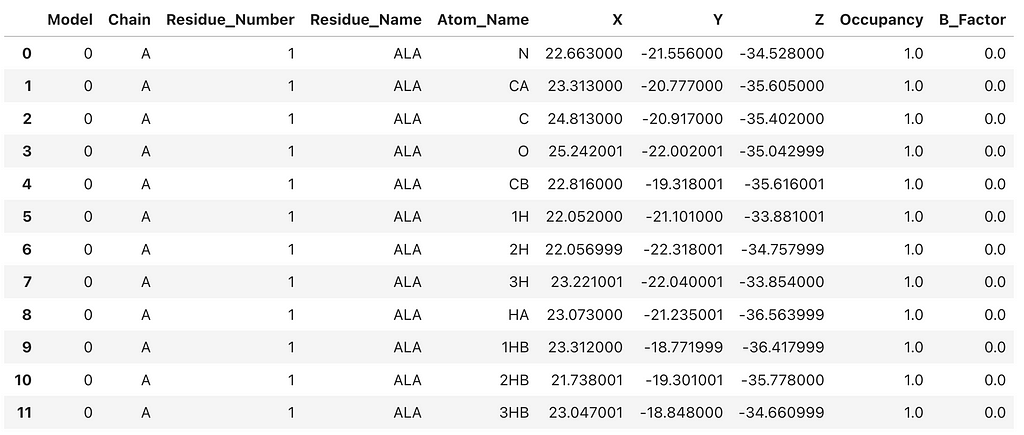
If you’re using a Jupyter Notebook, running this snippet should produce the following output:
This creates a Pandas DataFrame that contains basic atomic information from the crystal structure. To create a 3D network representation of the 4PLD protein structure, we need extract key information from the PDB file. When constructing PSNs I prefer to combine the residue number and name for each node so that on visual inspection the researcher can ‘get a feel’ for how the primary sequence structure is mapped to the network topology. In PSNs each residue is represented as a node. As a rule, I limit the network to chain A and only include C-alpha atoms. Therefore, each residue is represented by that residue’s C-alpha atom and corresponding x,y,z coordinates. The C-alpha coordinates are extracted as node features to construct the 3D network. It’s an exciting and insightful process!
Creating PSNs Using the Residue Interaction Network Generator
The Residue Interaction Network Generator (RING) is an online server that transforms protein structures into network representations. As mentioned earlier, residues are treated as nodes and interactions between them as edges. Generally, an interaction is interpreted in terms of proximity, i.e., Euclidean distances. However, other types of interactions are included, such as hydrogen bonds, salt bridges (ionic bonds), π-π stacking and van der Waals. The RING helps visualize and quantify the topological, or structural, features that emerges from residue-residue interaction network. Quantifying these structural features allows researchers to ask questions about functional hot spots, potential allosteric sites, and signaling pathways which may advance our understanding of protein dynamics and contribute to computational drug repurposing.
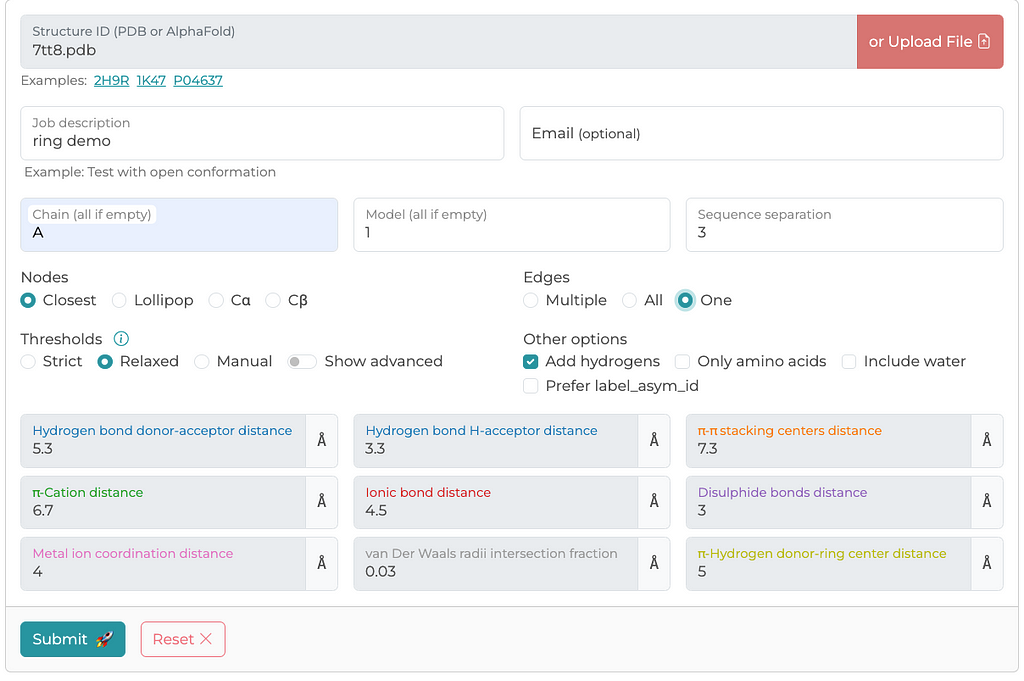
There are other methods for generating PSNs — residue-residue interactions. However, the RING server has been peer-reviewed and provides detailed documentation on how edges are calculated and what defines a connection. Below is a screenshot of a typical configuration I use for generating PSNs. I generally select parameters that I think are maximize edge inclusion. The RING server allows you to either retrieve a structure file from the PDB archive or upload a local file, which is what I have done in this case.
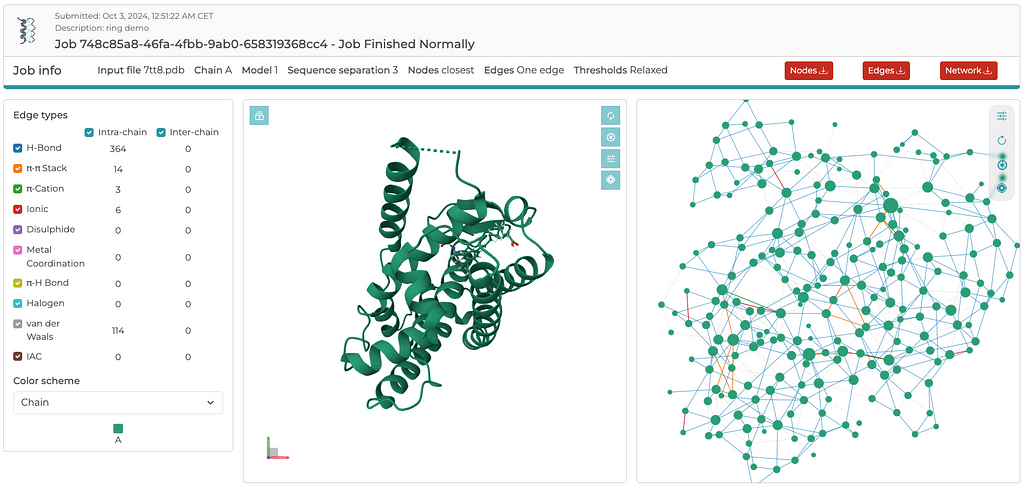
Once the server is finished with its computations, you’ll see an output similar to the screenshot below. Rather than going through the details of the results here, I encourage readers to explore the RING server and become familiar with its output by simply tinkering around. There are three three files that are generated for download: a .cif_ringNodes, a .cif_ringEdges, and a .json file, which contain everything needed to build either a 2D or 3D network. The entire 3D network, including x,y,z coordinates, is contained in the .json file. In a separate post, I will demonstrate how to read the .json file and plot the 3D network using Plotly. Again, the reason I extract coordinates from the PDB file, rather than the coordinates available in the .json file, is to ensure that the edges between residues map to the C-alpha atoms. It is a convention that structural biologists easily recognize and understand.
RING server results
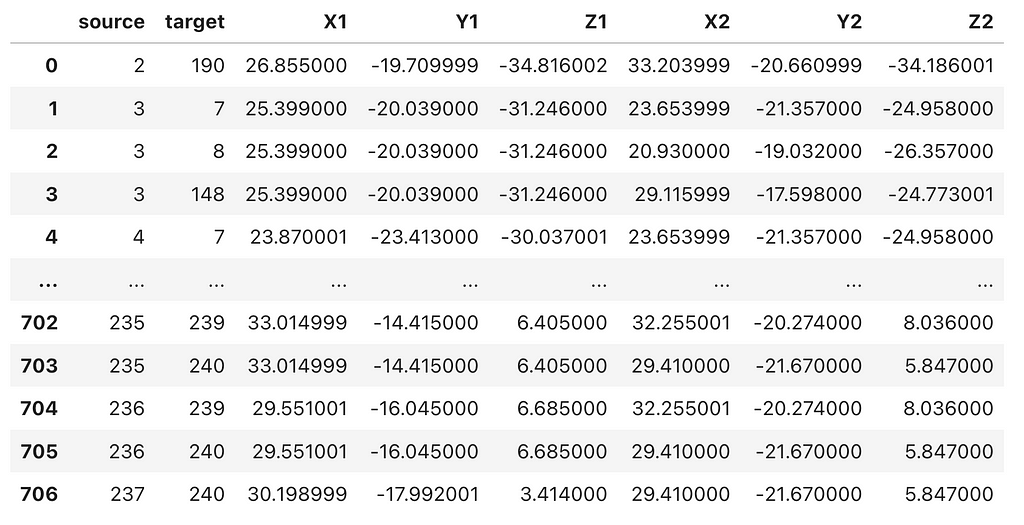
Next, we will import the .cif_ringEdges file downloaded from the RING server into a Pandas DataFrame, and then merge the residue-residue interactions (edges) with the C-alpha atom coordinates from the PDB file.
This should produce a data frame with ‘source’ and ‘target’ node columns, followed by the corresponding x, y, z coordinates for both the ‘source’ and ‘target’ nodes, similar to the example shown below.
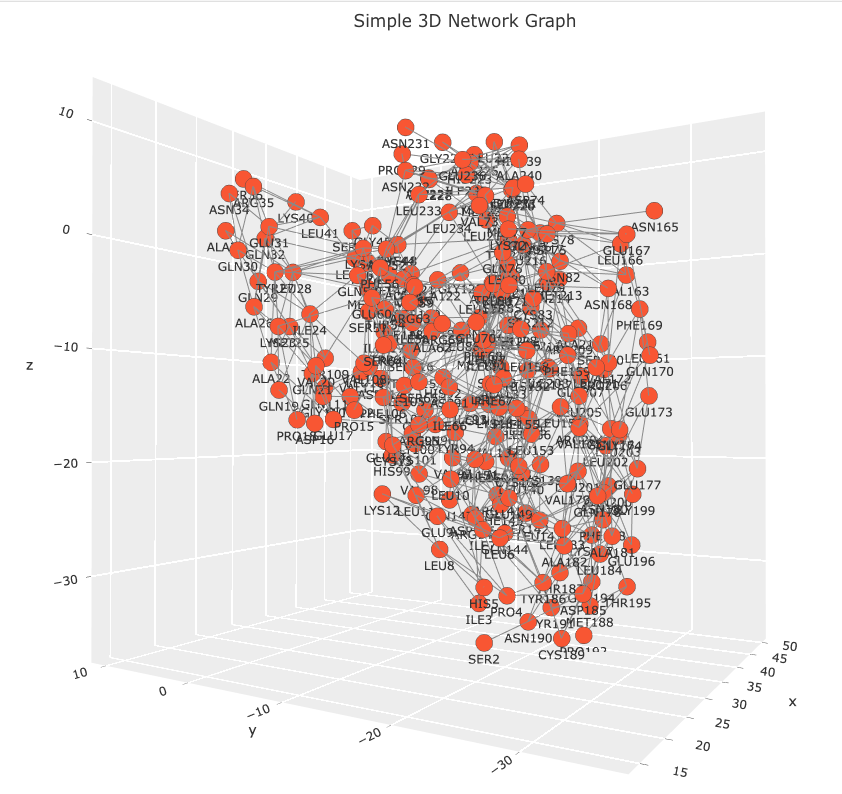
Lastly, with the Plotly and NetworkX libraries, we can create a script to generate an interactive 3D network visualization.
Observe that the code creates a Networkx graph object from the edgelist_7tt8_coords data frame. Please, note that the graph object isn’t necessary to create the 3D network visualization. This code snippet is included for a future post, where the graph object will be used to calculate various measures of centrality which will be mapped to the network’s visual features. The data frame is parsed using standard Python operations. Coordinates for each residue are extracted and with duplicate nodes being removed. Each residue is linked to a text marker in the 3D plot displaying a residue names and sequence position label. Hover labels are also assigned, but note that the label information is redundant. This information was left as a place holder. In a future post I will demonstrate how the hover label can be used to annotate the network with other information such as centrality score, evolutionary conservation score, or links to other databases. The Plotly figure is easily customizable with figure title, axis grids, and node and edge properties. The result is an interactive 3D network that allows users to explore the relationships between residues in any PSN. Images of the 7TT8 PSN are displayed below.
3D protein structure network using Plotly
There’s a lot more we can do with this figure. We can enhance it by adding widgets that dynamically resize nodes based on different centrality measures, or include biological and analytical annotations in the hover information. I’ll explore these enhancements in a future post. You can find the Jupyter Notebook for this exercise on GitHub. If you have any questions, feel free to contact me at [email protected].
Unless otherwise noted, all images are created by the author.
Stockholm-based Lovable has raised $7.5mn in pre-seed funding for its newly-launched AI coding assistant that promises to make everyone a dev. Dubbed GPT Engineer, the AI coding tool generates production-ready code in real-time, without requiring developer experience. According to the startup, users need only chat with the assistant to build websites and web apps. “We want to expand the world’s coding capabilities beyond the current 1% of the population who can program, and make software more accessible as a result,” Anton Osika, co-founder of Lovable, said in a statement. The GPT Engineer GPT Engineer is powered by customised Lange Language Models…
It doesn’t simply take a village to raise a startup. It takes a whole ecosystem, driven by the collaboration between governments, corporates, ecosystem builders — and of course, visionary founders. Startup ecosystems have naturally emerged as the foundation of technological innovation and as key drivers for business growth and regional development. But there isn’t a single recipe for success. What’s the best way to build a startup hub? What are the essential support mechanisms for young businesses, from accelerators and incubation programmes to startup visas? How to efficiently attract Foreign Direct Investment (FDI) and talent? The list of questions is…
Dan Rosckes, Apple’s Vice President of Global Sourcing and Supply Management, is retiring after a career spanning more than two decades at the company.
Dan Rosckes, Apple’s global head of procurement, is set to retire after 24 years at the company.
Rosckes, who has been with Apple for 24 years, ran the company’s hardware procurement group since 2022. His duties included negotiating deals with various suppliers and obtaining hardware components for Apple’s products, which says a lot about the importance of his role at the company.
Every year, Apple orders a wide variety of components in overwhelmingly large quantities. The iPhone maker’s hardware procurement group is tasked with sourcing the various components and making agreements with suppliers that ensure both a clear profit for Apple and the timely delivery of new hardware.
Apple’s global head of procurement, Dan Rosckes, to retire after 24 years
Originally appeared here:
Apple’s global head of procurement, Dan Rosckes, to retire after 24 years
We use cookies on our website to give you the most relevant experience by remembering your preferences and repeat visits. By clicking “Accept”, you consent to the use of ALL the cookies.
This website uses cookies to improve your experience while you navigate through the website. Out of these, the cookies that are categorized as necessary are stored on your browser as they are essential for the working of basic functionalities of the website. We also use third-party cookies that help us analyze and understand how you use this website. These cookies will be stored in your browser only with your consent. You also have the option to opt-out of these cookies. But opting out of some of these cookies may affect your browsing experience.
Necessary cookies are absolutely essential for the website to function properly. These cookies ensure basic functionalities and security features of the website, anonymously.
Cookie
Duration
Description
cookielawinfo-checkbox-analytics
11 months
This cookie is set by GDPR Cookie Consent plugin. The cookie is used to store the user consent for the cookies in the category "Analytics".
cookielawinfo-checkbox-functional
11 months
The cookie is set by GDPR cookie consent to record the user consent for the cookies in the category "Functional".
cookielawinfo-checkbox-necessary
11 months
This cookie is set by GDPR Cookie Consent plugin. The cookies is used to store the user consent for the cookies in the category "Necessary".
cookielawinfo-checkbox-others
11 months
This cookie is set by GDPR Cookie Consent plugin. The cookie is used to store the user consent for the cookies in the category "Other.
cookielawinfo-checkbox-performance
11 months
This cookie is set by GDPR Cookie Consent plugin. The cookie is used to store the user consent for the cookies in the category "Performance".
viewed_cookie_policy
11 months
The cookie is set by the GDPR Cookie Consent plugin and is used to store whether or not user has consented to the use of cookies. It does not store any personal data.
Functional cookies help to perform certain functionalities like sharing the content of the website on social media platforms, collect feedbacks, and other third-party features.
Performance cookies are used to understand and analyze the key performance indexes of the website which helps in delivering a better user experience for the visitors.
Analytical cookies are used to understand how visitors interact with the website. These cookies help provide information on metrics the number of visitors, bounce rate, traffic source, etc.
Advertisement cookies are used to provide visitors with relevant ads and marketing campaigns. These cookies track visitors across websites and collect information to provide customized ads.