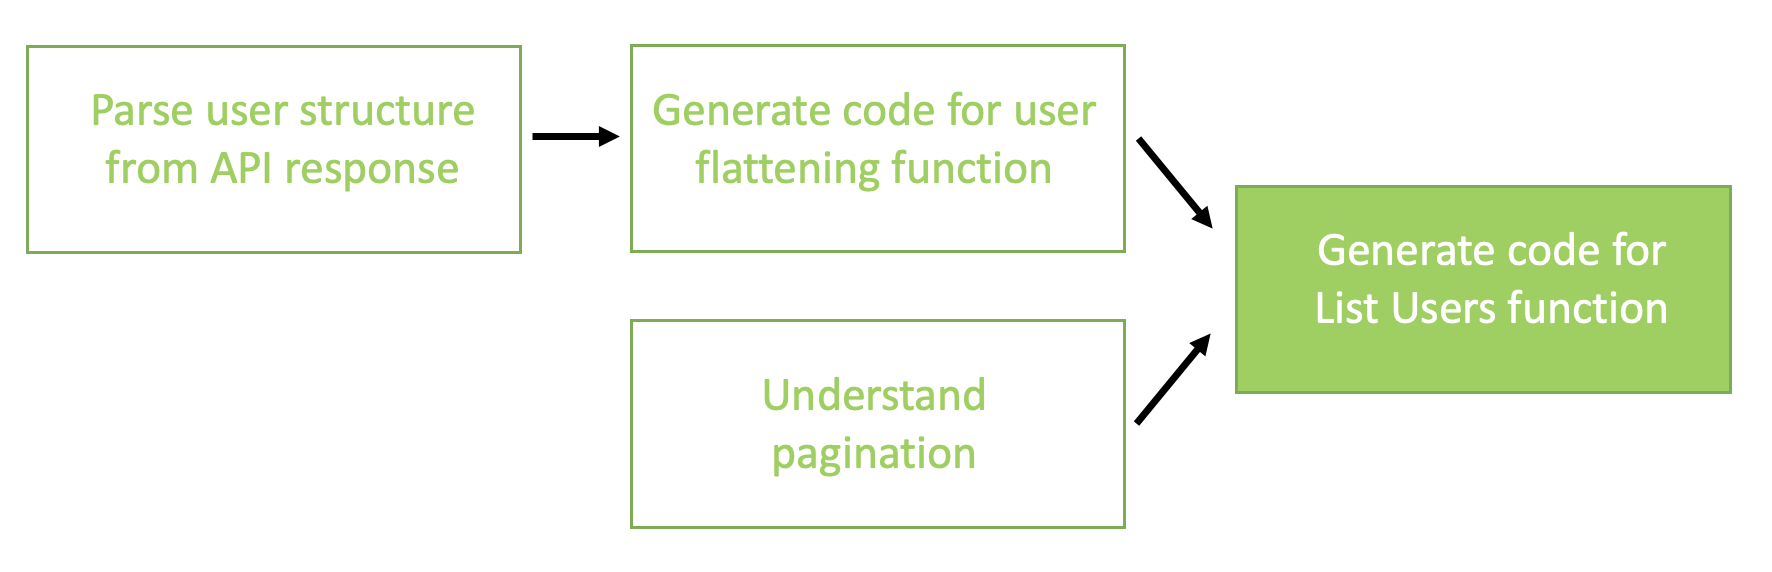
In this post, we highlight how the AWS Generative AI Innovation Center collaborated with SailPoint Technologies to build a generative AI-based coding assistant that uses Anthropic’s Claude Sonnet on Amazon Bedrock to help accelerate the development of software as a service (SaaS) connectors.
In this post, we demonstrate the power of SageMaker geospatial capabilities by mapping the world’s vegetation in under 20 minutes. This example not only highlights the efficiency of SageMaker, but also its impact how geospatial ML can be used to monitor the environment for sustainability and conservation purposes.
Clustering is a powerful technique within unsupervised machine learning that groups a given data based on their inherent similarities. Unlike supervised learning methods, such as classification, which rely on pre-labeled data to guide the learning process, clustering operates on unlabeled data. This means there are no predefined categories or labels and instead, the algorithm discovers the underlying structure of the data without prior knowledge of what the grouping should look like.
The main goal of clustering is to organize data points into clusters, where data points within the same cluster have higher similarity to each other compared to those in different clusters. This distinction allows the clustering algorithm to form groups that reflect natural patterns in the data. Essentially, clustering aims to maximize intra-cluster similarity while minimizing inter-cluster similarity. This technique is particularly useful in use-cases where you need to find hidden relationships or structure in data, making it valuable in areas such as fraud detection and anomaly identification.
By applying clustering, one can reveal patterns and insights that might not be obvious through other methods, and its simplicity and flexibility makes it adaptable to a wide variety of data types and applications.
Using Clustering to Detect Fraudulent Behavior in Online Systems
A practical application of clustering is fraud detection in online systems. Consider an example where multiple users are making requests to a website, and each request includes details like the IP address, time of the request, and transaction amount.
Here’s how clustering can help detect fraud:
Imagine that most users are making requests from unique IP addresses, and their transaction patterns naturally differ.
However, if multiple requests come from the same IP address and show similar transaction patterns (such as frequent, high-value transactions), it could indicate that a fraudster is making multiple fake transactions from one source.
By clustering all user requests based on IP address and transaction behavior, we could detect suspicious clusters of requests that all originate from a single IP. This can flag potentially fraudulent activity and help in taking preventive measures.
An example diagram that visually demonstrates the concept of clustering is shown in the figure below.
Imagine you have data points representing transaction requests, plotted on a graph where:
X-axis: Number of requests from the same IP address.
Y-axis: Average transaction amount.
On the left side, we have the raw data. Without labels, we might already see some patterns forming. On the right, after applying clustering, the data points are grouped into clusters, with each cluster representing a different user behavior.
Example of clustering of fraudulent user behavior. Image source (CC BY 4.0)
Defining Similarity Measures for Effective Clustering
To group data effectively, we must define a similarity measure, or metric, that quantifies how close data points are to each other. This similarity can be measured in multiple ways, depending on the data’s structure and the insights we aim to discover. There are two key approaches to measuring similarity — manual similarity measures and embedded similarity measures.
A manual similarity measure involves explicitly defining a mathematical formula to compare data points based on their raw features. This method is intuitive and we can use distance metrics like Euclidean distance, cosine similarity, or Jaccard similarity to evaluate how similar two points are. For instance, in fraud detection, we could manually compute the Euclidean distance between transaction attributes (e.g transaction amount, frequency of requests) to detect clusters of suspicious behavior. Although this approach is relatively easy to set up, it requires careful selection of the relevant features and may miss deeper patterns in the data.
On the other hand, an embedded similarity measure leverages the power of machine learning models to create learned representations, or embeddings of the data. Embeddings are vectors that capture complex relationships in the data and can be generated from models like Word2Vec for text or neural networks for images. Once these embeddings are computed, similarity can be measured using traditional metrics like cosine similarity, but now the comparison occurs in a transformed, lower-dimensional space that captures more meaningful information. Embedded similarity is particularly useful for complex data, such as user behavior on websites or text data in natural language processing. For example, in a movie or ads recommendation system, user actions can be embedded into vectors, and similarities in this embedding space can be used to recommend content to similar users.
While manual similarity measures provide transparency and greater control on feature selection and setup, embedded similarity measures give the ability to capture deeper and more abstract relationships in the data. The choice between the two depends on the complexity of the data and the specific goals of the clustering task. If you have well-understood, structured data, a manual measure may be sufficient. But if your data is rich and multi-dimensional, such as in text or image analysis, an embedding-based approach may give more meaningful clusters. Understanding these trade-offs is key to selecting the right approach for your clustering task.
In cases like fraud detection, where the data is often rich and based on behavior of user activity, an embedding-based approach is generally more effective for capturing nuanced patterns that could signal risky activity.
Introducing the Behavioral Analysis and Cluster Classification System (BACCS) for Detecting Coordinated Fraudulent Attacks
Coordinated fraudulent attack behaviors often exhibit specific patterns or characteristics. For instance, fraudulent activity may originate from a set of similar IP addresses or rely on consistent, repeated tactics. Detecting these patterns is crucial for maintaining the integrity of a system, and clustering is an effective technique for grouping entities based on shared traits. This helps the identification of potential threats by examining the collective behavior within clusters.
However, clustering alone may not be enough to accurately detect fraud, as it can also group benign activities alongside harmful ones. For example, in a social media environment, users posting harmless messages like “How are you today?” might be grouped with those engaged in phishing attacks. Hence, additional criteria is necessary to separate harmful behavior from benign actions.
To address this, we introduce the Behavioral Analysis and Cluster Classification System (BACCS) as a framework designed to detect and manage abusive behaviors. BACCS works by generating and classifying clusters of entities, such as individual accounts, organizational profiles, and transactional nodes, and can be applied across a wide range of sectors including social media, banking, and e-commerce. Importantly, BACCS focuses on classifying behaviors rather than content, making it more suitable for identifying complex fraudulent activities.
The system evaluates clusters by analyzing the aggregate properties of the entities within them. These properties are typically boolean (true/false), and the system assesses the proportion of entities exhibiting a specific characteristic to determine the overall nature of the cluster. For example, a high percentage of newly created accounts within a cluster might indicate fraudulent activity. Based on predefined policies, BACCS identifies combinations of property ratios that suggest abusive behavior and determines the appropriate actions to mitigate the threat.
The BACCS framework offers several advantages:
It enables the grouping of entities based on behavioral similarities, enabling the detection of coordinated attacks.
It allows for the classification of clusters by defining relevant properties of the cluster members and applying custom policies to identify potential abuse.
It supports automatic actions against clusters flagged as harmful, ensuring system integrity and enhancing protection against malicious activities.
This flexible and adaptive approach allows BACCS to continuously evolve, ensuring that it remains effective in addressing new and emerging forms of coordinated attacks across different platforms and industries.
Let’s understand more with the help of an analogy: Let’s say you have a wagon full of apples that you want to sell. All apples are put into bags before being loaded onto the wagon by multiple workers. Some of these workers don’t like you, and try to fill their bags with sour apples to mess with you. You need to identify any bag that might contain sour apples. To identify a sour apple you need to check if it is soft, the only problem is that some apples are naturally softer than others. You solve the problem of these malicious workers by opening each bag and picking out five apples, and you check if they are soft or not. If almost all the apples are soft it’s likely that the bag contains sour apples, and you put it to the side for further inspection later on. Once you’ve identified all the potential bags with a suspicious amount of softness you pour out their contents and pick out the healthy apples which are hard and throw away all the soft ones. You’ve now minimized the risk of your customers taking a bite of a sour apple.
BACCS operates in a similar manner; instead of apples, you have entities (e.g., user accounts). Instead of bad workers, you have malicious users, and instead of the bag of apples, you have entities grouped by common characteristics (e.g., similar account creation times). BACCS samples each group of entities and checks for signs of malicious behavior (e.g., a high rate of policy violations). If a group shows a high prevalence of these signs, it’s flagged for further investigation.
Just like checking the materials in the classroom, BACCS uses predefined signals (also referred to as properties) to assess the quality of entities within a cluster. If a cluster is found to be problematic, further actions can be taken to isolate or remove the malicious entities. This system is flexible and can adapt to new types of malicious behavior by adjusting the criteria for flagging clusters or by creating new types of clusters based on emerging patterns of abuse.
This analogy illustrates how BACCS helps maintain the integrity of the environment by proactively identifying and mitigating potential issues, ensuring a safer and more reliable space for all legitimate users.
The system offers numerous advantages:
Better Precision: By clustering entities, BACCS provides strong evidence of coordination, enabling the creation of policies that would be too imprecise if applied to individual entities in isolation.
Explainability: Unlike some machine learning techniques, the classifications made by BACCS are transparent and understandable. It is straightforward to trace and understand how a particular decision was made.
Quick Response Time: Since BACCS operates on a rule-based system rather than relying on machine learning, there is no need for extensive model training. This results in faster response times, which is important for immediate issue resolution.
BACCS might be the right solution for your needs if you:
Focus on classifying behavior rather than content: While many clusters in BACCS may be formed around content (e.g., images, email content, user phone numbers), the system itself does not classify content directly.
Handle issues with a relatively high frequancy of occurance: BACCS employs a statistical approach that is most effective when the clusters contain a significant proportion of abusive entities. It may not be as effective for harmful events that sparsely occur but is more suited for highly prevalent problems such as spam.
Deal with coordinated or similar behavior: The clustering signal primarily indicates coordinated or similar behavior, making BACCS particularly useful for addressing these types of issues.
Here’s how you can incorporate BACCS framework in a real production system:
Setting up BACCS in production. Image by Author
When entities engage in activities on a platform, you build an observation layer to capture this activity and convert it into events. These events can then be monitored by a system designed for cluster analysis and actioning.
Based on these events, the system needs to group entities into clusters using various attributes — for example, all users posting from the same IP address are grouped into one cluster. These clusters should then be forwarded for further classification.
During the classification process, the system needs to compute a set of specialized boolean signals for a sample of the cluster members. An example of such a signal could be whether the account age is less than a day. The system then aggregates these signal counts for the cluster, such as determining that, in a sample of 100 users, 80 have an account age of less than one day.
These aggregated signal counts should be evaluated against policies that determine whether a cluster appears to be anomalous and what actions should be taken if it is. For instance, a policy might state that if more than 60% of the members in an IP cluster have an account age of less than a day, these members should undergo further verification.
If a policy identifies a cluster as anomalous, the system should identify all members of the cluster exhibiting the signals that triggered the policy (e.g., all members with an account age of less than one day).
The system should then direct all such users to the appropriate action framework, implementing the action specified by the policy (e.g., further verification or blocking their account).
Typically, the entire process from activity of an entity to the application of an action is completed within several minutes. It’s also crucial to recognize that while this system provides a framework and infrastructure for cluster classification, clients/organizations need to supply their own cluster definitions, properties, and policies tailored to their specific domain.
Example: Mitigating Spam Through IP-Based Clustering and Blocking
Let’s look at the example where we try to mitigate spam via clustering users by ip when they send an email, and blocking them if >60% of the cluster members have account age less than a day.
Clustering and blocking in action. Image by Author
Members can already be present in the clusters. A re-classification of a cluster can be triggered when it reaches a certain size or has enough changes since the previous classification.
When selecting clustering criteria and defining properties for users, the goal is to identify patterns or behaviors that align with the specific risks or activities you’re trying to detect. For instance, if you’re working on detecting fraudulent behavior or coordinated attacks, the criteria should capture traits that are often shared by malicious actors. Here are some factors to consider when picking clustering criteria and defining user properties:
Selecting Clustering Criteria
The clustering criteria you choose should revolve around characteristics that represent behavior likely to signal risk. These characteristics could include:
Time-Based Patterns: For example, grouping users by account creation times or the frequency of actions in a given time period can help detect spikes in activity that may be indicative of coordinated behavior.
Geolocation or IP Addresses: Clustering users by their IP address or geographical location can be especially effective in detecting coordinated actions, such as multiple fraudulent logins or content submissions originating from the same region.
Content Similarity: In cases like misinformation or spam detection, clustering by the similarity of content (e.g., similar text in posts/emails) can identify suspiciously coordinated efforts.
Behavioral Metrics: Characteristics like the number of transactions made, average session time, or the types of interactions with the platform (e.g., likes, comments, or clicks) can indicate unusual patterns when grouped together.
The key is to choose criteria that are not just correlated with benign user behavior but also distinct enough to isolate risky patterns, which will lead to more effective clustering.
Defining User Properties
Once you’ve chosen the criteria for clustering, defining meaningful properties for the users within each cluster is critical. These properties should be measurable signals that can help you assess the likelihood of harmful behavior. Common properties include:
Account Age: Newly created accounts tend to have a higher risk of being involved in malicious activities, so a property like “Account Age < 1 Day” can flag suspicious behavior.
Connection Density: For social media platforms, properties like the number of connections or interactions between accounts within a cluster can signal abnormal behavior.
Transaction Amounts: In cases of financial fraud, the average transaction size or the frequency of high-value transactions can be key properties to flag risky clusters.
Each property should be clearly linked to a behavior that could indicate either legitimate use or potential abuse. Importantly, properties should be boolean or numerical values that allow for easy aggregation and comparison across the cluster.
A neat trick: Enhancing Detection with Lowered ML Thresholds + Clustering for Increased Recall
Another advanced strategy is using a machine learning classifier’s output as a property, but with an adjusted threshold. Normally, you would set a high threshold for classifying harmful behavior to avoid false positives. However, when combined with clustering, you can afford to lower this threshold because the clustering itself acts as an additional signal to reinforce the property.
Let’s consider that there is a model X, that catches scam and disables email accounts that have model X score > 0.95. Assume this model is already live in production and is disabling bad email accounts at threshold 0.95 with 100% precision. We have to increase the recall of this model, without impacting the precision.
First, we need to define clusters that can group coordinated activity together. Let’s say we know that there’s a coordinated activity going on, where bad actors are using the same subject line but different email ids to send scammy emails. So using BACCS, we will form clusters of email accounts that all have the same subject name in their sent emails.
Next, we need to lower the raw model threshold and define a BACCS property. We will now integrate model X into our production detection infra and create property using lowered model threshold, say 0.75. This property will have a value of “True” for an email account that has model X score >= 0.75.
Then we’ll define the anomaly threshold and say, if 50% of entities in the campaign name clusters have this property, then classify the clusters as bad and take down ad accounts that have this property as True.
So we essentially lowered the model’s threshold and started disabling entities in particular clusters at significantly lower threshold than what the model is currently enforcing at, and yet can be sure the precision of enforcement does not drop and we get an increase in recall. Let’s understand how –
Supposed we have 6 entities that have the same subject line, that have model X score as follows:
Entities actioned by ML model. Image by Author
If we use the raw model score (0.95) we would have disabled 2/6 email accounts only.
If we cluster entities on subject line text, and define a policy to find bad clusters having greater than 50% entities with model X score >= 0.75, we would have taken down all these accounts:
Entities actioned by clustering, using ML scores as properties. Image by Author
So we increased the recall of enforcement from 33% to 83%. Essentially, even if individual behaviors seem less risky, the fact that they are part of a suspicious cluster elevates their importance. This combination provides a strong signal for detecting harmful activity while minimizing the chances of false positives.
By lowering the threshold, you allow the clustering process to surface patterns that might otherwise be missed if you relied on classification alone. This approach takes advantage of both the granular insights from machine learning models and the broader behavioral patterns that clustering can identify. Together, they create a more robust system for detecting and mitigating risks and catching many more entities while still keeping a lower false positive rate.
Conclusion
Clustering techniques remain an important method for detecting coordinated attacks and ensuring system safety, particularly on platforms more prone to fraud, abuse or other malicious activities. By grouping similar behaviors into clusters and applying policies to take down bad entities from such clusters, we can detect and mitigate harmful activity and ensure a safer digital ecosystem for all users. Choosing more advanced embedding-based approaches helps represent complex user behavioral patterns better than manual methods of similarity detection measures.
As we continue advancing our security protocols, frameworks like BACCS play a crucial role in taking down large coordinated attacks. The integration of clustering with behavior-based policies allows for dynamic adaptation, enabling us to respond swiftly to new forms of abuse while reinforcing trust and safety across platforms.
In the future, there is a big opportunity for further research and exploration into complementary techniques that could enhance clustering’s effectiveness. Techniques such as graph-based analysis for mapping complex relationships between entities could be integrated with clustering to offer even higher precision in threat detection. Moreover, hybrid approaches that combine clustering with machine learning classification can be a very effective approach for detecting malicious activities at higher recall and lower false positive rate. Exploring these methods, along with continuous refinement of current methods, will ensure that we remain resilient against the evolving landscape of digital threats.
Since the original DRESS Kit was first released in 2021, it has been successfully implemented in a handful of biomedical research projects. If you have never heard of the DRESS Kit, then you may be interested to know that it is a fully open-sourced, dependency-free, plain ES6 JavaScript library specifically designed for performing advanced statistical analysis and machine learning tasks. The DRESS Kit was aimed to serve biomedical researchers who are not trained biostatisticians and have no access to dedicated statistics software.
Not only was the DRESS Kit proven to be a practical and effective tool for analyzing complex datasets and building machine-learning models, but these real-world experiences have also provided us with valuable opportunities to identify potential areas of improvement to the DRESS Kit. To support certain new features and to achieve a substantial performance improvement, however, much of the original codebase has to be rewritten from scratch. After many sleepless nights and countless cups of coffee, we are finally ready to share with you — DRESS Kit V2.
Although the new version of the DRESS Kit is no longer backward compatible with the previous one, we have tried our best to preserve the method signatures (i.e. the name of the methods and the expected parameters) as much as possible. This means that research projects that were implemented using DRESS Kit V1 can be migrated to V2 with only a few modifications. This also means, however, that many of the feature enhancements may not be immediately obvious just by scanning through the source code. We will, therefore, spend some time in this article exploring the new features and notable changes in the latest version of the DRESS Kit.
New Features
Incremental Training One of the most exciting new features in DRESS Kit V2 is the ability to perform incremental training on any regression or classification machine-learning algorithms. In the previous version of the DRESS Kit, this capability was only supported by the kNN algorithm and the multilayer perceptron algorithm. This feature allows models to be trained using larger datasets, but in a resource-efficient manner, or to adapt to evolving data sources in real time.
Here is the pseudocode to implement incremental training using the random forest algorithm.
// Create an empty model.
let model = DRESS.randomForst([], outcome, numericals, categoricals);
// Train the existing model using new samples. Repeat this step whenever a sufficient number of new training samples is accumulated.
model.train(samples);
Incremental training is implemented differently on different machine-learning algorithms. With the kNN algorithm, new samples are added to existing training samples, as a result, the model will increase in size over time. With the logistic regression or linear regression algorithm, existing regression coefficients are updated using the new training samples. With the random forest or gradient boosting algorithm, existing decision trees or branches of a decision tree can be pruned and new trees or new branches can be added based on the new training samples. With the multilayer perceptron algorithm, the weights and the biases of the neural network are updated as new training samples are added.
Model Tuning Another exciting new feature in DRESS Kit V2 is the addition of the `dress-modeling.js` module, which contains methods to facilitate the tedious process of fine-tuning machine-learning models. These methods are designed to work with any regression or classification model created using the `dress-regression.js` module, the `dress-tree.js` module, and the `dress-neural.js` module. Because all of these tasks are rather computationally intensive, these methods are designed to work asynchronously by default.
Permutation Feature Importance The first method in this module is `DRESS.importances`, which computes permutation feature importance. It allows one to estimate the relative contribution of each feature to a trained model by randomly permuting the values of one of the features, thus breaking the correlation between said feature and the outcome.
// Split a sample dataset into training/vadilation dataset
const [trainings, validations] = DRESS.split(samples);
// Create a model using a training dataset.
let model = DRESS.gradientBoosting(trainings, outcome, numericals, categoricals);
// Compute the permutation feature importances using a validation dataset.
DRESS.print(
 DRESS.importances(model, validations)
);
Cross Validation The second method in this module is `DRESS.crossValidate`, which performs k-fold cross-validation. It automatically divides a dataset into k (default is 5) equally sized folds, and applies each fold as a validation set while training a machine-learning model on the remaining k-1 folds. It helps assess model performance more robustly.
// Training parameters
const trainParams = [outcomes, features];
// Validation parameters
const validateParams = [0.5];
// Perform cross validation on sample dataset using the logistic regression algorithm. Note that the training parameters and validations parameters MUST be passed as arrays.
DRESS.print(
 DRESS.crossValidate(DRESS.logistic, samples, trainParams, validateParams)
);
Hyperparameter Optimization The third, and perhaps the most powerful, method in this module is `DRESS.hyperparameters`, which performs automatic hyperparameter optimization, on any numerical hyperparameters, using a grid search approach with early stopping. It uses the `DRESS.crossValidate` method internally to assess model performance. There are several steps to the process. First, one must specify the initial values of the hyperparameters. Any hyperparameter that is not explicitly defined will be set to its default value by the machine-learning algorithm. Second, one must specify the end value of the search space for each hyperparameter that is being optimized. The order in which these hyperparameters are specified also determines the search order, therefore, it is advisable to specify the most pertinent hyperparameter first. Third, one must select a performance metric (e.g. `f1` for classification and `r2` for regression) for assessing model performance. Here is the pseudocode to perform automatic hyperparameter optimization on a multilayer perceptron algorithm.
// Specify the initial hyperparameter values. Hyperparameters that are not defined will be set to the default values by the multilayer perceptron algorithm itself.
const initial = {
 alpha: 0.001,
 epoch: 100,
 dilution: 0.1,
 layout: [20, 10]
}
// Specify the end values of the search space. Only hyperparameters that are being optimized are included.
const eventual = {
 dilution: 0.6, // the dilution hyperparameter will be searched first.
 epoch: 1000 // the epoch hyperparameter will be searched second.
 // the alpha hyperparameter will not be optimized.
 // the layout hyperparameter cannot be optimized since it is not strictly a numerical value.
}
// Specify the performace metric.
const metric = 'f1',
// Training parameters
const trainParams = [outcome, features];
DRESS.print(
 DRESS.hyperparameters(initial, eventual, metric, DRESS.multilayerPerceptron, samples, trainParams)
)
Model Import & Export One of the primary motivations for creating the DRESS Kit using plain JavaScript, instead of another high performance language, is to ensure cross-platform compatibility and ease of integration with other technologies. DRESS Kit V2 now includes methods to facilitate the distribution of trained models. The internal representations of the models have also been optimized to maximize portability.
// To export a model in JSON format.
DRESS.save(DRESS.deflate(model), 'model.json');
// To import a model from a JSON file.
DRESS.local('model.json').then(json => {
 const model = DRESS.inflate(json)
})
Dataset Inspection One of the most often requested features for DRESS Kit V2 is a method that is comparable to `pandas.DataFrame.info` in Python. We have, therefore, released a new method `DRESS.summary` in the `dress-descriptive.js` module for generating a concise summary from a dataset. Simply pass an array of objects as the parameter and the method will automatically identify the enumerable features, the data type (numeric vs categoric), and the number of `null` values found in these objects.
// Print a concise summary of the specified dataset.
DRESS.print(
 DRESS.summary(samples)
);
Last but not least, DRESS Kit V2 comes with a brand new toy dataset for testing and learning the various statistical methods and machine-learning algorithms. This toy dataset contains 6000 synthetic subjects modeled after a cohort of patients with various chronic liver diseases. Each subject includes 23 features, which consist of a combination of numerical and categorical features with varying cardinalities. Here is the structure of each subject:
{
 ID: number, // Unique identifier
 Etiology: string, // Etiology of liver disease (ASH, NASH, HCV, AIH, PBC)
 Grade: number, // Degree of steatotsis (1, 2, 3, 4)
 Stage: number, // Stage of fibrosis (1, 2, 3, 4)
 Admissions: number[], // List of numerical IDs representing hospital admissions
Demographics: {
 Age: number, // Age of subject
 Barriers: string[], // List of psychosocial barriers
 Ethnicity: string, // Ethnicity (white, latino, black, asian, other)
 Gender: string // M or F
 },
Exams: {
 BMI: number // Body mass index
 Ascites: string // Ascites on exam (none, small, large)
 Encephalopathy: string // West Haven encephalopathy grade (0, 1, 2, 3, 4)
 Varices: string // Varices on endoscopy (none, small, large)
 },
Labs: {
 WBC: number, // WBC count (1000/uL)
 Hemoglobin: number, // Hemoglobin (g/dL)
 MCV: number, // MCV (fL)
 Platelet: number, // Platelet count (1000/uL)
 AST: number, // AST (U/L)
 ALT: number, // ALT (U/L)
 ALP: number, // Alkaline Phosphatase (IU/L)
 Bilirubin: number, // Total bilirubin (mg/dL)
 INR: number // INR
 }
}
This intentionally crafted toy dataset supports both classification and regression tasks. Its data structure closely resembles that of real patient data, making it suitable for debugging real-world scenario workflows. Here is a concise summary of the toy dataset generated using the aforementioned `DRESS.summary` method.
Propensity and Proximity Matching The `DRESS.propensity` method, which performs propensity score matching, now supports both numerical and categorical features as confounders. Internally, the method uses `DRESS.logistic` to estimate the propensity score if only numerical features are specified; otherwise, it uses `DRESS.gradientBoosting`. We have also introduced a new method called `DRESS.proximity` that uses `DRESS.kNN` to perform K-nearest neighbor matching.
// Split samples to controls and subjects.
const [controls, subjects] = DRESS.split(samples);
// If only numerical features are specified, then the method will build a logistic regression model.
let numerical_matches = DRESS.propensity(subjects, controls, numericals);
// If only categorical features (or both categorical and numberical features) are specified, then the method will build a gradient boosting regression model.
let categorical_matches = DRESS.propensity(subjects, controls, numericals, categoricals);
Categorize and Numericize The `DRESS.categorize` method in the `dress-transform.js` module has been completely rewritten and behaves very differently, but more intuitively, now. The new `DRESS.categorize` method accepts an array of numerical values as boundaries and converts a numerical feature into a categorical feature based on the specified boundaries. The old `DRESS.categorize` method has been renamed as `DRESS.numericize`, which converts a categorical feature into a numerical feature by matching the feature value against an ordered array of categories.
// Define boundaries.
const boundaries = [3, 6, 9];
// Categorize any feature value less than 3 as 0, values between 3 and 6 as 1, values between 6 and 9 as 2, and values greater than 9 as 3.
DRESS.categorize(samples, [feature], boundaries);
// Define categories.
const categories = [A, [B, C], D];
// Numericize any feature value A to 0, B or C to 1, and D to 2.
DRESS.numericize(samples, [feature], categories);
Linear, Logistic, and Polytomous Regression In DRESS Kit V1, the `DRESS.logistic` regression algorithm was implemented using Newton’s method, while the `DRESS.linear` regression algorithm utilized the matrix approach. In DRESS Kit V2, both regression algorithms were implemented using the same optimized gradient descent regression method, which also supports hyperparameters such as learning rate and ridge (L2) regularization. We have also introduced a new method called `DRESS.polytomous`, which uses `DRESS.logistic` internally to perform multiclass classification using the one-vs-rest approach.
Precision-Recall Curve The `dress-roc.js` module now contains a method, `DRESS.pr`, to generate precision-recall curves based on one or more numerical classifiers. This method has a method signature identical to that of `DRESS.roc` and can be used as a direct replacement for the latter.
// Generate a receiver-operating characteristic (roc) curve.
let roc = DRESS.roc(samples, outcomes, classifiers);
// Generate a precision-recall (pr) curve.
let pr = DRESS.pr(samples, outcomes, classifiers);
Breaking Changes
JavaScript Promise DRESS Kit V2 uses Promise exclusively to handle all asynchronous operations. Callback functions are no longer supported. Most notably, the coding pattern of passing a custom callback function named `processJSON` to `DRESS.local` or `DRESS.remote` (as shown in the examples from DRESS Kit V1) is no longer valid. Instead, the following coding pattern is preferred.
DRESS.local('data.json').then(subjects => {
 // Do something with the subjects.
})
kNN Model Several breaking changes have been made to the `DRESS.kNN` method. First, the outcome of the model must be specified during the training phase, instead of during the prediction phase, similar to how other machine learning models in the DRESS Kit, such as `DRESS.gradientBoosting`, `DRESS.multilayerPerceptron` are created.
The kNN imputation functionality has been moved from the model object returned by the `DRESS.kNN` method to a separate method named `DRESS.nearestNeighbor` in the `dress-imputation.js` module in order to better differentiate the machine-learning algorithm from its application.
The `importances` parameter has been removed and relative feature importances should be specified as a hyperparameter instead.
Model Performance The method for evaluating/validating a machine learning model’s performance has been renamed from `model.performance` to `model.validate` in order to improve linguistic coherence (i.e. all method names are verbs).
Module Organization The module containing the core statistical methods has been renamed from `dress-core.js` to `dress.js`, which must be included at all times when using DRESS Kit V2 in a modular fashion.
The module containing the decision-tree-based machine learning algorithms, including random forest and gradient boosting, has been renamed from `dress-ensemble.js` to `dress-tree.js` in order to better describe the underlying learning algorithm.
The methods for loading and saving data files as well as printing text output onto an HTML document have been moved from `dress-utility.js` to `dress-io.js`. Meanwhile, the `DRESS.async` method has been moved to its own module `DRESS-async.js`.
Default Boolean Parameters All optional boolean (true/false) parameters are assigned a default value of `false`, in order to maintain a coherent syntax. The default behavoirs of the methods are carefully designed to be suitable for most common use-cases. For instance, the default behavior of the kNN machine learning model is to use the weighted kNN algorithm; the boolean parameter to select between the weighted vs unweighted kNN algorithm has, therefore, been renamed as `unweighted` and is set to a default value of `false`.
As a result of this change, however, the default behavior of all machine learning algorithms is set to produce a regression model, instead of a classification model.
Removed Methods The following methods have been removed entirely because they were deemed ill-constructed or redundant: – `DRESS.effectMeasures` from the `dress-association.js` module. – `DRESS.polynomial` from the `dress-regression.js` module. – `DRESS.uuid` from the `dress-transform.js` module.
Final Note
Apart from the major new features mentioned earlier, numerous enhancements have been made to nearly every method included in the DRESS Kit. Most operations are noticeably faster than before yet the minified codebase remains nearly the same size. If you have previously utilized DRESS Kit V1, upgrading to V2 is highly recommended. For those who haven’t yet incorporated the DRESS Kit into their research projects, now is an opportune moment to explore its capabilities. We genuinely value your interest in and your ongoing support for the DRESS Kit. Please do not hesitate to share your feedback and comments so that we can continue to improve this library.
Please do not hesitate to grab the latest version of the DRESS Kit from its GitHub repository and start building.
Exploring DRESS Kit V2 was originally published in Towards Data Science on Medium, where people are continuing the conversation by highlighting and responding to this story.
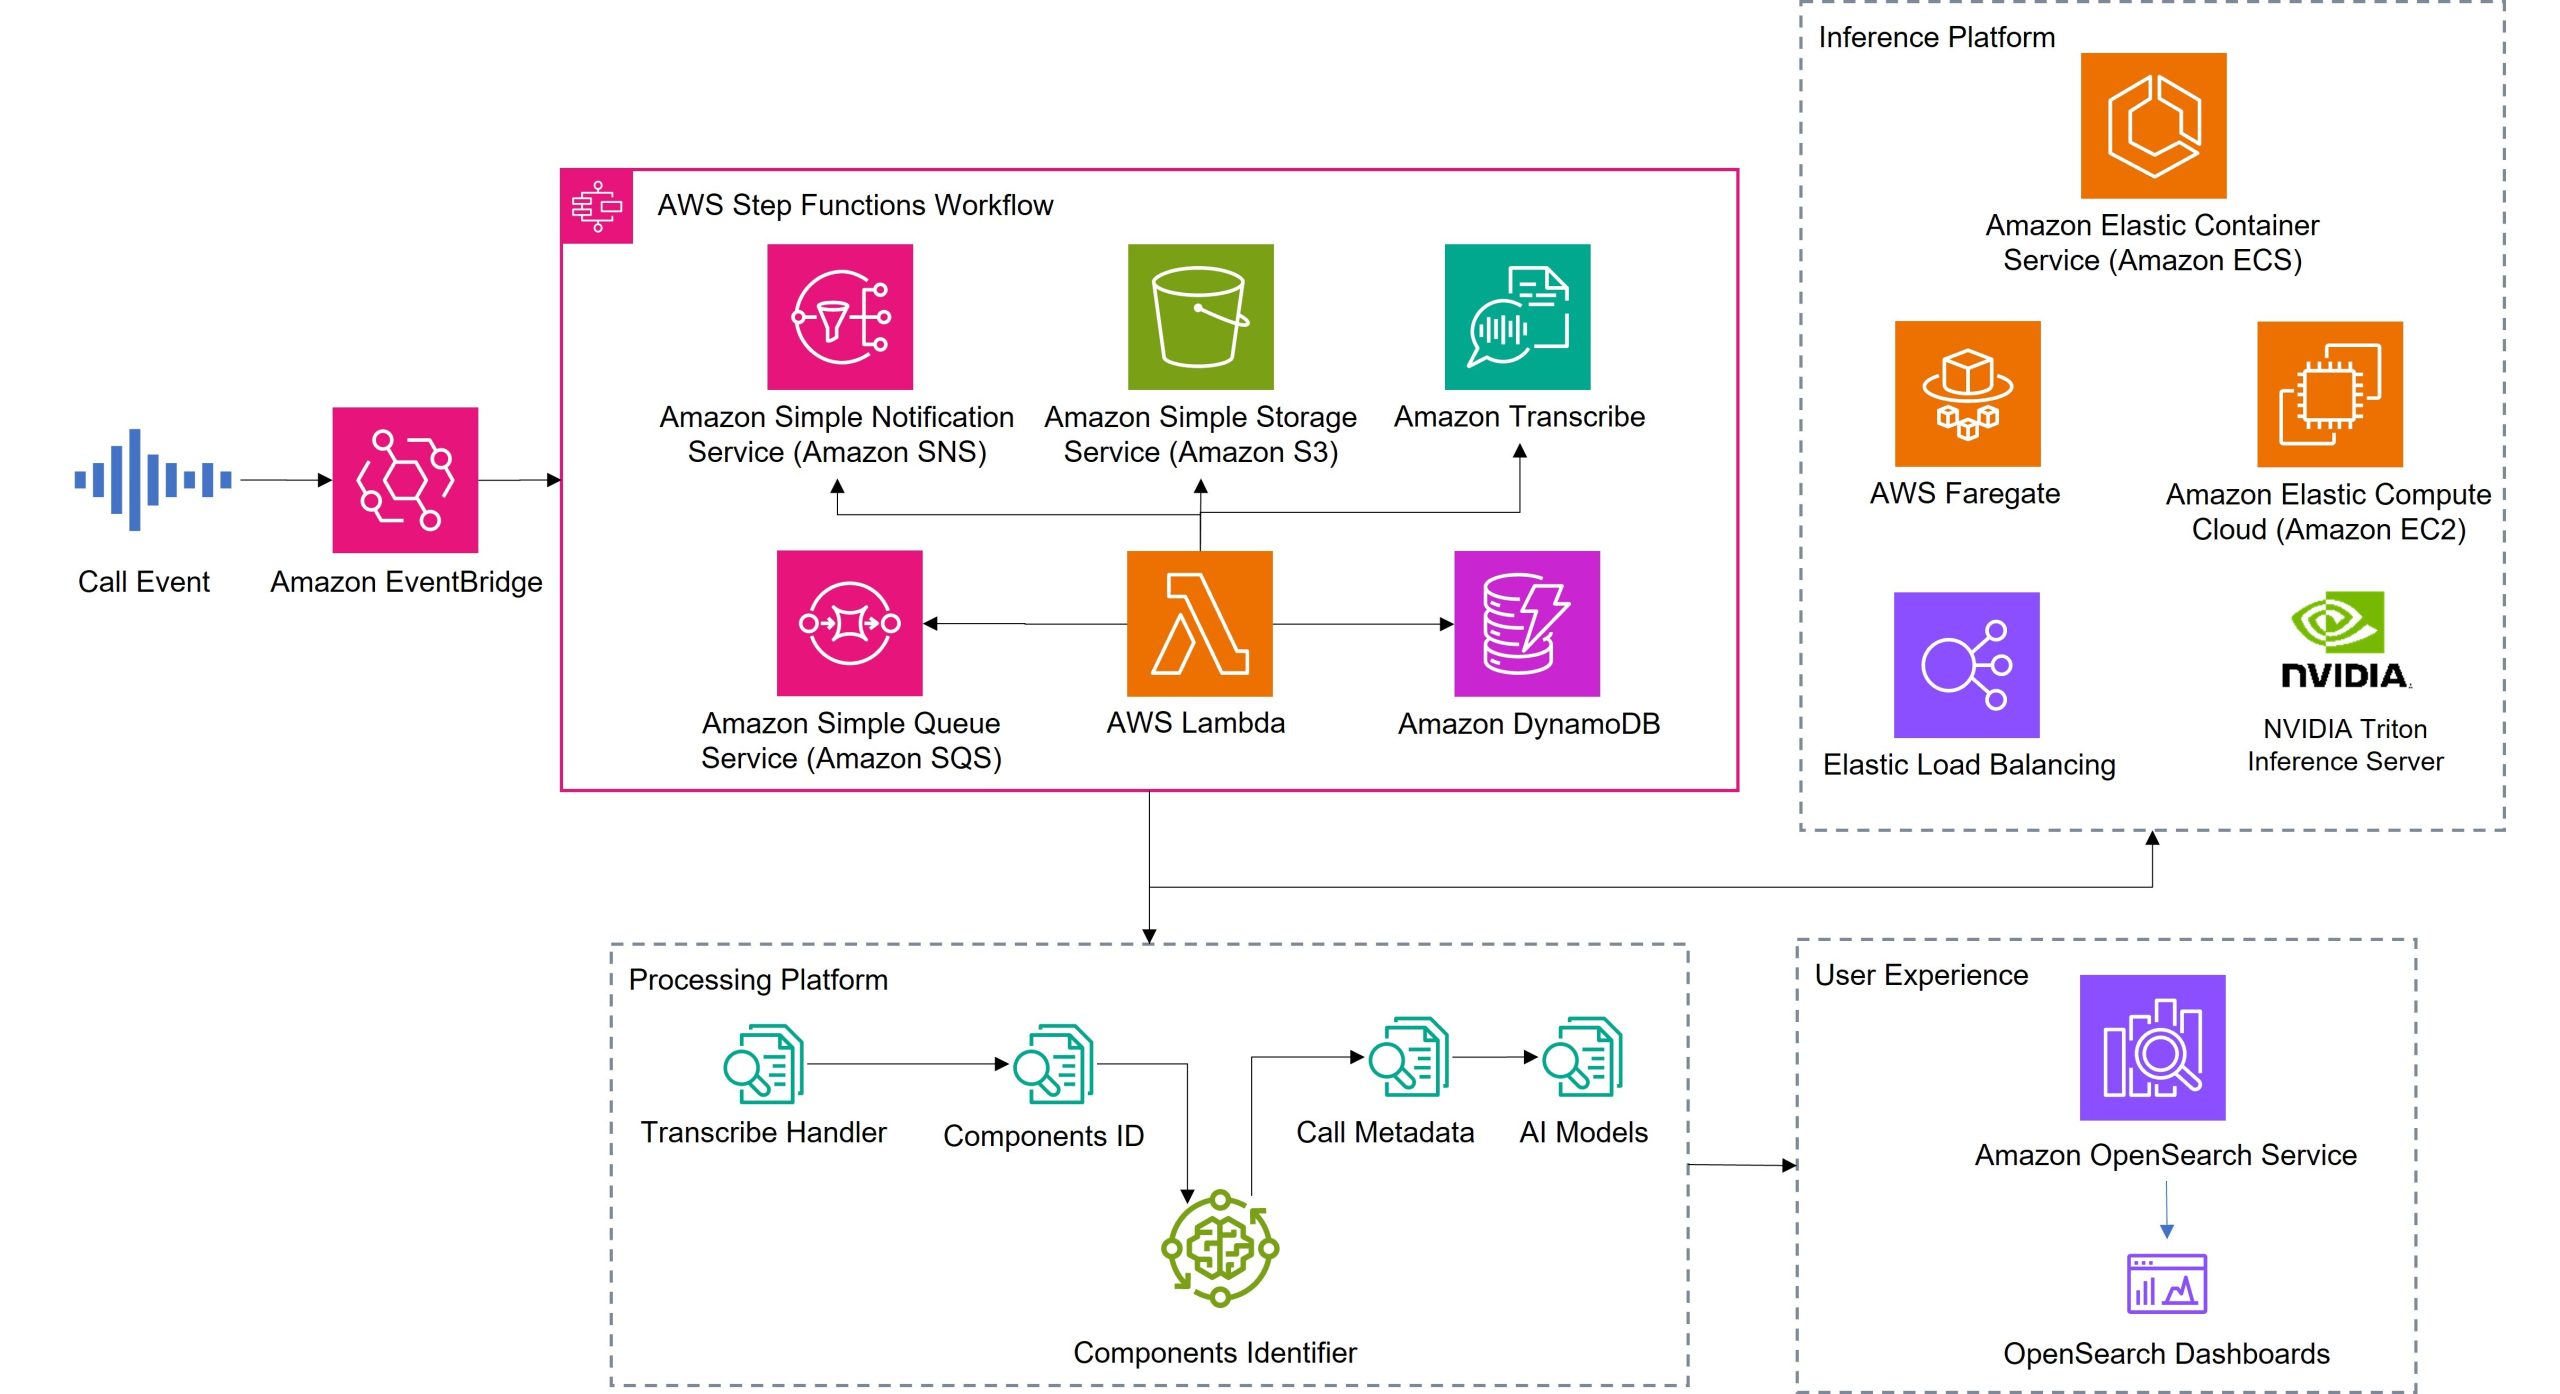
In this post, we demonstrate how Intact’s Call Quality solution used Amazon Transcribe and other AWS services to improve critical KPIs with AI-powered contact center call auditing and analytics.
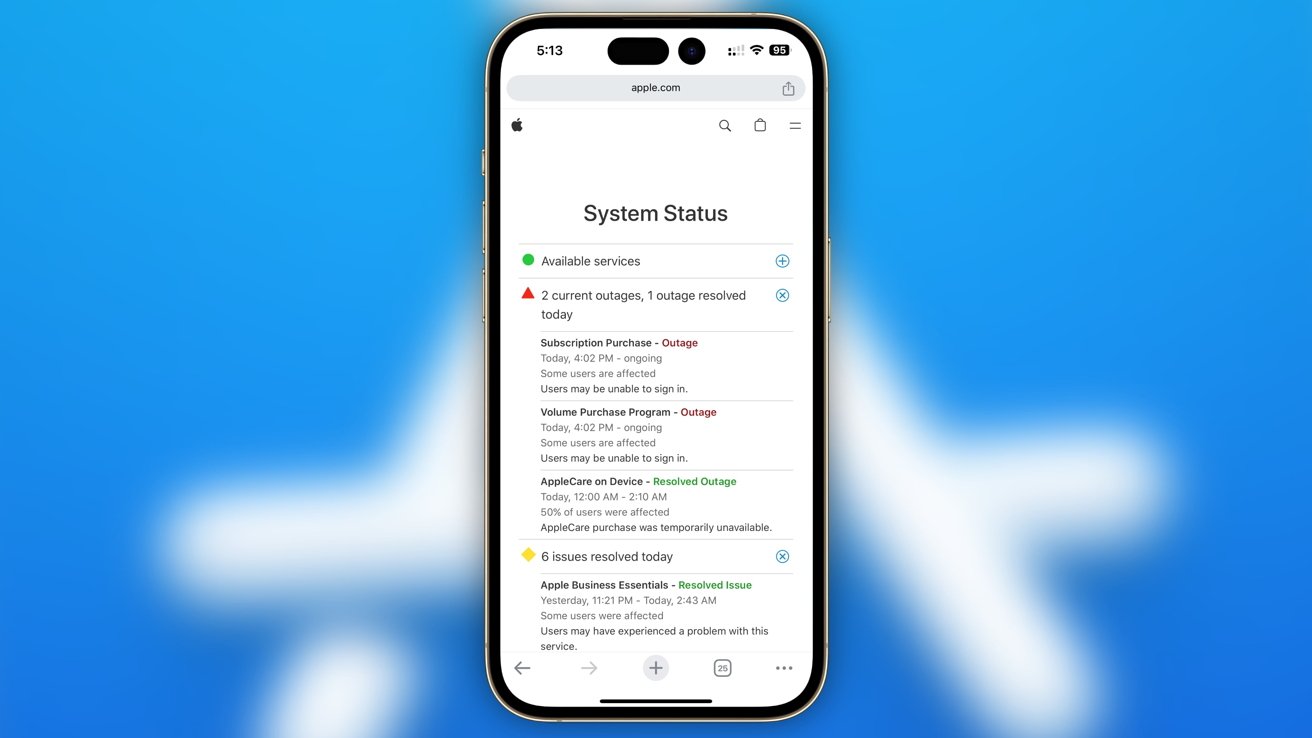
Apple’s App Store and Mac App Store are having issues on Wednesday, with users unable to download apps among other problems with the digital sales platform.
Apple System Status
A number of Mac and iPhone users discovered that they were not able to download apps from the App Store and the Mac App Store. AppleInsider editorial team members were able to confirm the problem existed, but it was a periodic issue for some writers.
It is unclear how many people are affected by the outages, but some have taken to X to post about their inability to install apps. It doesn’t appear to stop users from browsing the App Store, only downloading new apps.
Despite Apple’s dominance in consumer tech, its smart home speaker strategy is lagging behind Amazon and Google. But the company has a new strategy.
HomePod and HomePod mini
Apple, a leader in smartphones, tablets, and wearables, has struggled to replicate its success in the smart home market. Recent reports show that the company’s smart home offerings struggle to secure a significant market share.
Apple’s woes with smart speakers are particularly evident, with Amazon’s Echo series and Google’s Home devices dominating the market. A Consumer Intelligence Research Partners (CIRP) survey reveals that Amazon’s Echo commands over two-thirds of the U.S. market, while Google holds about one-quarter.
The TCL QM8 delivers excellent picture quality, great sound, and a dedicated picture mode at an affordable price. And if you’ve been looking to invest in a truly cinema-sized TV, you can save $500 on the 85-inch model at Best Buy.
We tested the best small phones on the market to find those that are compact but don’t compromise on battery life and camera specs. These are our top picks.
If you’ve been waiting to upgrade your home theater, now is your chance to snag an awesome bundle deal from Sony that includes a Bravia 7 Mini LED TV and a Sony Bravia Bar 8.
We use cookies on our website to give you the most relevant experience by remembering your preferences and repeat visits. By clicking “Accept”, you consent to the use of ALL the cookies.
This website uses cookies to improve your experience while you navigate through the website. Out of these, the cookies that are categorized as necessary are stored on your browser as they are essential for the working of basic functionalities of the website. We also use third-party cookies that help us analyze and understand how you use this website. These cookies will be stored in your browser only with your consent. You also have the option to opt-out of these cookies. But opting out of some of these cookies may affect your browsing experience.
Necessary cookies are absolutely essential for the website to function properly. These cookies ensure basic functionalities and security features of the website, anonymously.
Cookie
Duration
Description
cookielawinfo-checkbox-analytics
11 months
This cookie is set by GDPR Cookie Consent plugin. The cookie is used to store the user consent for the cookies in the category "Analytics".
cookielawinfo-checkbox-functional
11 months
The cookie is set by GDPR cookie consent to record the user consent for the cookies in the category "Functional".
cookielawinfo-checkbox-necessary
11 months
This cookie is set by GDPR Cookie Consent plugin. The cookies is used to store the user consent for the cookies in the category "Necessary".
cookielawinfo-checkbox-others
11 months
This cookie is set by GDPR Cookie Consent plugin. The cookie is used to store the user consent for the cookies in the category "Other.
cookielawinfo-checkbox-performance
11 months
This cookie is set by GDPR Cookie Consent plugin. The cookie is used to store the user consent for the cookies in the category "Performance".
viewed_cookie_policy
11 months
The cookie is set by the GDPR Cookie Consent plugin and is used to store whether or not user has consented to the use of cookies. It does not store any personal data.
Functional cookies help to perform certain functionalities like sharing the content of the website on social media platforms, collect feedbacks, and other third-party features.
Performance cookies are used to understand and analyze the key performance indexes of the website which helps in delivering a better user experience for the visitors.
Analytical cookies are used to understand how visitors interact with the website. These cookies help provide information on metrics the number of visitors, bounce rate, traffic source, etc.
Advertisement cookies are used to provide visitors with relevant ads and marketing campaigns. These cookies track visitors across websites and collect information to provide customized ads.