Cardano formed a strategic partnership with BitcoinOS, enhancing its DeFi landscape
Collaboration could be a crucial catalyst for an ADA breakout on the charts
Currently trading within a bullish ascending triangle, AXS is nearing a support zone that could spark a major price rally.
Short-term downward pressure is anticipated as indicators suggest temp
A trader lost $454,000 in an hour due to a poorly timed memecoin investment.
Centralization on Solana raises concerns about memecoins and scams, according to Edward Snowden.
When it comes to software development, there are plenty of automated testing tools and frameworks to rely on. But for analytics teams, manual testing and data quality assurance (QA) are still the norm. Too often, it’s the customer or business team who first spots issues with data quality or completeness, rather than the analytics team.
That’s where automation can make a huge difference. By setting up an automated system with scripts to run data quality tests at scale, you can keep things running fast without sacrificing the accuracy or completeness of your data.
Of course, this gets trickier when business questions are vague or open-ended. In those cases, a mix of rule-based logic and large language models (LLMs) can really help — allowing you to generate scenarios and run automated checks. In this tutorial, we’ll walk through how to build an automated testing system that evaluates and scores the quality of your data and SQL queries, even when the business questions are written in plain English.
What You’ll Need Before We Start
To follow along with this tutorial, make sure you have the following:
A solid understanding of databases and SQL
Experience with Python for API calls and handling data
Access to GPT-4 API tokens
A dataset of business questions for testing
Designing the System Architecture
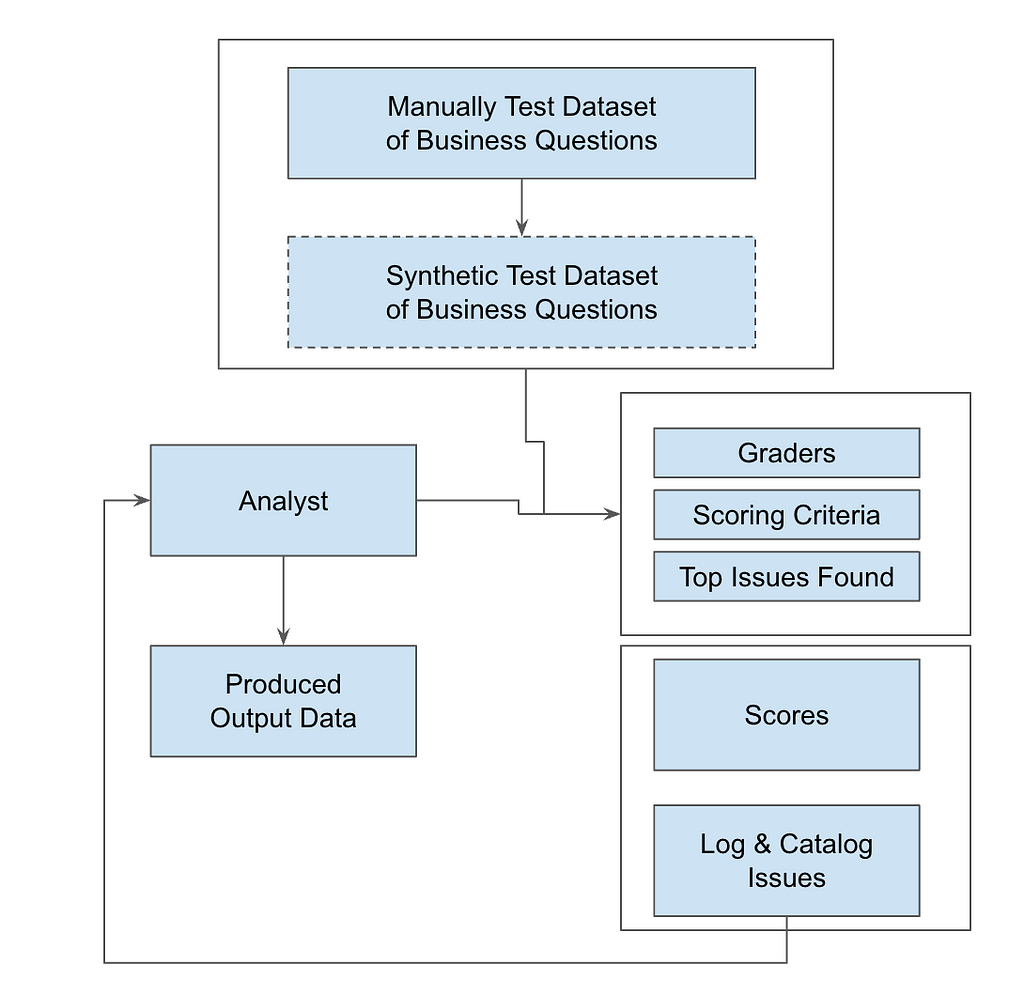
To build an automated QA system for evaluating SQL queries, the architecture must integrate rule-based logic, LLM validation, and automated scoring. This setup is perfect for handling those open-ended business questions, letting you scale your testing beyond manual processes.
Key components include:
Query Ingestion Engine: Where SQL queries are received and executed.
Evaluation Module: Combines static rules with LLM-based to validate the results.
Scoring System: Grades the results based on different user roles like Data Scientists, Business Leaders, and End Users.
The architecture includes a feedback loop that logs issue types–things like missing data, wrong granularity, or slow performance. This information get stored in a centralized database, so you can keep optimizing the system over time. We will use Python for scripting, SQL for tracking backend issues, and OpenAI’s LLM for interpreting natural language inputs. By scheduling these tests to run regularly, you’ll maintain consistent data quality and scalability, while also fine-tuning query performance to align with business goals.
The diagram below shows how data flows through the system — from SQL ingestion to automated testing, scoring, and issue tracking — so you can maintain high data quality at scale.
In the end, this system doesn’t just catch errors — it drives continuous improvement and keeps your technical execution aligned with business objectives.
Image by the author: Diagram created to illustrate technical architecture
Tutorial
Step 1: Prepare Dataset of Test Questions & Answers
To get started, collect real business questions that your internal teams or customers frequently ask the analytics team. Many of these might be ad-hoc data requests, so by having a variety of questions on hand you can make sure your testing is relevant. Here are a few examples to get you going:
Question #1: “How many of our Pro Plan users are converting from a trial?”
Question #2: “How many new users did we bring on in June 2024?”
Question #3: “What products are trending right now?”
Question #4: “What’s the current sales volume for our top products?”
Step 2: Building Your Evaluation & Scoring Criteria
2a: Define Your Graders
For thorough testing, set up graders from different perspectives to cover all bases:
End User: Focuses on usability and clarity. Is the result easy to interpret? Does it address the original business question directly?
Data Scientist: Evaluates technical accuracy and completeness. Are all the necessary datasets included? Is the analysis detailed and reproducible?
Business Leader: Looks for alignment with strategic goals. Does the output support decision-making in line with business objectives?
2b: Define Scoring Criteria
Each grader should assess queries based on specific factors:
Accuracy: Does the query provide the right answer? Are any data points missing or misinterpreted?
Relevance: Does the output contain all the necessary data while excluding irrelevant information?
Logic: Is the query well-structured? Are joins, filters, and aggregations applied correctly?
Efficiency: Is the query optimized for performance without extra complexity or delays?
2c: Track and Log Issue Types
To cover all bases, it’s important to log common issues that arise during query execution. This makes it easier to tag and run automated evaluations later on.
Wrong Granularity: Data is returned at an incorrect level of detail.
Excessive Columns: The result includes unnecessary fields, creating clutter.
Missing Data: Critical data is missing from the output.
Incorrect Values: Calculations or values are wrong.
Performance Issues: The query runs inefficiently, taking too long to execute.
import openai
import json

# Set your OpenAI API key here
openai.api_key = 'your-openai-api-key'
def evaluate_sql_query(question, query, results):
    # Define the prompt with placeholders for question, query, and results
    prompt = f"""
    As an external observer, evaluate the SQL query and results against the client's question. Provide an assessment from three perspectives:
    1. End User
    2. Data Scientist
    3. Business Leader

    For each role, provide:
    1. **Overall Score** (0-10)
    2. **Criteria Scores** (0-10):
       - Accuracy: How well does it meet the question?
       - Relevance: Is all needed data included, and is irrelevant data excluded?
       - Logic: Does the query make sense?
       - Efficiency: Is it concise and free of unnecessary complexity?
    3. **Issue Tags** (2D array: ['tag', 'details']):
       - Examples: Wrong Granularity, Excessive Columns, Missing Data, Incorrect Values, Wrong Filters, Performance Issues.
    4. **Other Observations** (2D array: ['tag', 'details'])

    Client Question:
    {question}

    SQL Query:
    {query}

    SQL Results:
    {results}

    Respond ONLY in this format:
    ```json
    {{
      "endUser": {{"overallScore": "", "criteriaScores": {{"accuracy": "", "relevance": "", "logic": "", "efficiency": ""}}, "issueTags": [], "otherObservations": []}},
      "dataScientist": {{"overallScore": "", "criteriaScores": {{"accuracy": "", "relevance": "", "logic": "", "efficiency": ""}}, "issueTags": [], "otherObservations": []}},
      "businessLeader": {{"overallScore": "", "criteriaScores": {{"accuracy": "", "relevance": "", "logic": "", "efficiency": ""}}, "issueTags": [], "otherObservations": []}}
    }}
    ```
    """
    # Call the OpenAI API with the prompt
    response = openai.Completion.create(
        engine="gpt-4",  # or whichever model you're using
        prompt=prompt,
        max_tokens=500,  # Adjust token size based on expected response length
        temperature=0  # Set temperature to 0 for more deterministic results
    )
    # Parse and return the result
    return json.loads(response['choices'][0]['text'])
# Example usage
question = "How many Pro Plan users converted from trial?"
query = "SELECT COUNT(*) FROM users WHERE plan = 'Pro' AND status = 'Converted' AND source = 'Trial';"
results = "250"
evaluation = evaluate_sql_query(question, query, results)
print(json.dumps(evaluation, indent=4))
Step 3: Automate the Testing
3a: Loop Through the Questions
Once you’ve gathered your business questions, set up a loop to feed each question, its related SQL query, and the results into your evaluation function. This lets you automate the entire evaluation process, making sure that each query is scored consistently.
3b: Schedule Regular Runs
Automate the testing process by scheduling the script to run regularly — ideally after each data refresh or query update. This keeps the testing in sync with your data, catching any issues as soon as they arise.
3c: Log Scores, Tags, and Observations in a Database
For each test run, log all scores, issue tags, and observations in a structured database. Use the Python script to populate a table (e.g., issue_catalog) with the relevant data. This gives you a history of evaluations to track trends, pinpoint frequent issues, and optimize future testing.
Step 4: Reporting Test Outcomes
4a: Pivot & Group by Scores
Leverage SQL queries or BI tools to create pivot tables that group your results by overall scores and specific criteria like accuracy, relevance, logic, and efficiency. This helps you spot trends in performance and figure out which areas need the most attention.
To calculate an overall score for each query across all graders, use a weighted formula:
Where w1, w2, w3, w4 are the weights assigned to each scoring criterion. The sum of these weights should equal 1 for normalization.
For example, you might assign higher weight to Accuracy for Data Scientists and higher weight to Relevance for Business Leaders, depending on their priorities.
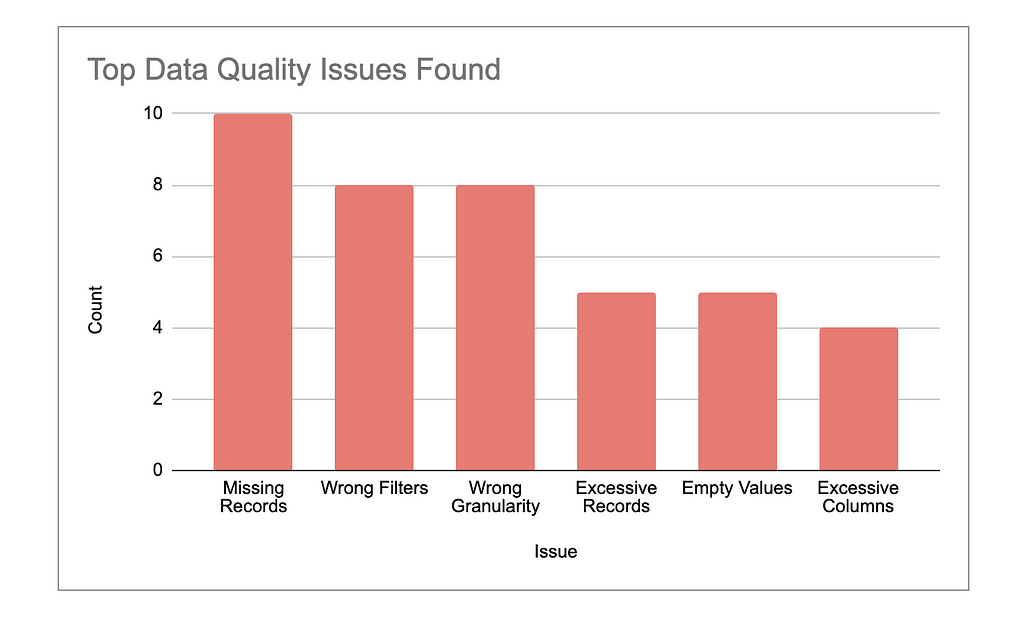
4b: Highlight Top Issues
Identify the most frequent and critical issues — things like missing data, wrong granularity, or performance inefficiencies. Provide a detailed report that breaks down how often these issues occur and which types of queries are most affected.
Focus on patterns that could lead to more significant errors if left unaddressed. For example, highlight cases where data quality issues might have skewed decision-making or slowed down business processes.
Prioritize the issues that need immediate action, such as those affecting query performance or accuracy in key datasets, and outline clear next steps to resolve them.
Image by the author: Chart Created using Sample Test Data
4c: Analyze Variance of Graders
Look closely at any discrepancies between scores from different graders (End User, Data Scientist, Business Leader). Large differences can reveal potential misalignments between the technical execution and business objectives.
For example, if a query scores high in technical accuracy but low in relevance to the business question, this signals a gap in translating data insights into actionable outcomes. Similarly, if the End User finds the results hard to interpret, but the Data Scientist finds them technically sound, it may point to communication or presentation issues.
By tracking these differences, you can better align the analytics process with both technical precision and business value, keeping all stakeholders satisfied.
To quantify this variance, you can calculate the variance of the graders’ scores. First, define the individual scores as:
S-EndUser: The overall score from the End User.
S-DataScientist: The overall score from the Data Scientist.
S-BusinessLeader: The overall score from the Business Leader.
The mean score μ across the three graders can be calculated as:
Next, calculate the variance σ², which is the average of the squared differences between each grader’s score and the mean score. The formula for variance is:
By calculating this variance, you can objectively measure how much the graders’ scores differ.
Large variances suggest that one or more graders perceive the quality of the query or relevance differently, which may indicate a need for better alignment between technical output and business needs.
Step 5: Create a Feedback Loop
5a: Pinpoint Key Issues
Throughout your testing process, you’ll likely notice certain issues cropping up repeatedly. These might include missing data, incorrect values, wrong granularity, or performance inefficiencies. It’s important to not only log these issues but also categorize and prioritize them.
For example, if critical data is missing, that should be addressed immediately, while performance tweaks can be considered as longer-term optimizations. By focusing on the most impactful and recurring problems, you’ll be able to improve data quality and tackle the root causes more effectively.
5b: Refine Your SQL Queries
Now that you’ve identified the recurring issues, it’s time to update your SQL queries to resolve them. This involves refining query logic to achieve accurate joins, filters, and aggregations. For example:
If you encounter wrong granularity, adjust the query to aggregate data at the appropriate level.
For missing data, make sure all relevant tables are joined correctly.
If there are performance problems, simplify the query, add indexes, or use more efficient SQL functions.
The goal here is to translate the feedback you’ve logged into tangible improvements in your SQL code, making your future queries more precise, relevant, and efficient.
5c: Re-Test for Validation
Once your queries have been optimized, re-run the tests to verify the improvements. Automating this step ensures that your updated queries are consistently evaluated against new data or business questions. Running the tests again allows you to confirm that your changes have fixed the issues and improved overall data quality. It also helps confirm that your SQL queries are fully aligned with business needs, which can enable quicker and more accurate insights. If any new issues arise, simply feed them back into the loop for continuous improvement.
Example Code for Automating the Feedback Loop
To automate this feedback loop, here is a Python script that processes multiple test cases (including business questions, SQL queries, and results), evaluates them using OpenAI’s API, and stores the results in a database:
for question, query, results in test_cases: # Call the OpenAI API to evaluate the SQL query and results response = openai.Completion.create( engine="text-davinci-003", # Replace with GPT-4 or relevant engine prompt=prompt.format(question=question, query=query, results=results), max_tokens=1000 )
# Process and store the response process_response(response)
The issue_catalog table serves as the main repository for storing detailed test results, giving you a clear way to track query performance and flag issues over time. By using JSONB format for storing issue tags and observations, you gain flexibility, allowing you to log complex information without needing to update the database schema frequently. Here’s the SQL code for setting it up:
CREATE TABLE issue_catalog (
    id SERIAL PRIMARY KEY,
    test_run_id INT NOT NULL,
    question TEXT NOT NULL,
    role TEXT NOT NULL,  -- e.g., endUser, dataScientist, businessLeader
    overall_score INT NOT NULL,
    accuracy_score INT NOT NULL,
    relevance_score INT NOT NULL,
    logic_score INT NOT NULL,
    efficiency_score INT NOT NULL,
    issue_tags JSONB,  -- Storing issue tags as JSON for flexibility
    other_observations JSONB,  -- Storing other observations as JSON
    created_at TIMESTAMP DEFAULT CURRENT_TIMESTAMP
);
What This Feedback Loop Accomplishes
Continuous Improvement: By keeping track of issues over time, you’ll be able to fine-tune your SQL queries and steadily boost their quality. Each test run delivers actionable insights, and by targeting the most frequent problems, your system becomes more efficient and resilient with every pass.
Data Quality Assurance: Running tests regularly on updated SQL queries helps you verify that they handle new data and test cases correctly. This ongoing process shows whether your adjustments are truly improving data quality and keeping everything aligned with business needs, lowering the risk of future issues.
Alignment with Business Needs: Sorting issues based on who raised them — whether it’s an End User, Data Scientist, or Business Leader — lets you zero in on improvements that matter to both technical accuracy and business relevance. Over time, this builds a system where technical efforts directly support meaningful business insights.
Scalable Testing and Optimization: This approach scales smoothly as you add more test cases. As your issue catalog expands, patterns emerge, making it easier to fine-tune queries that affect a wide range of business questions. With each iteration, your testing framework gets stronger, driving continuous improvements in data quality at scale.
Summary
Automating SQL testing is a game-changer for analytics teams, helping them catch data issues early and resolve them with precision. By setting up a structured feedback loop that combines rule-based logic with LLMs, you can scale testing to handle even the most complex business questions.
This approach not only sharpens data accuracy but also keeps your insights aligned with business goals. The future of analytics depends on this balance between automation and insight — are you ready to make that leap?
As is their tradition at this time of year, Apple announced a new line of iPhones last week. The promised centrepiece that would make us want to buy these new devices was AI – or Apple Intelligence, as they branded it. Yet the reaction from the collective world of consumer technology has been muted. The lack of enthusiasm from consumers was so evident it immediately wiped over a hundred billion dollars off Apple’s share price. Even the Wired Gadget Lab podcast, enthusiasts of all new things tech, found nothing in the new capabilities that would make them want to upgrade…
$26 million SOL staked, signaling investor confidence as price gains 12% in the past week.
Firedancer upgrade targets 1 million transactions/second, boosting Solana’s capacity and reliability
We use cookies on our website to give you the most relevant experience by remembering your preferences and repeat visits. By clicking “Accept”, you consent to the use of ALL the cookies.
This website uses cookies to improve your experience while you navigate through the website. Out of these, the cookies that are categorized as necessary are stored on your browser as they are essential for the working of basic functionalities of the website. We also use third-party cookies that help us analyze and understand how you use this website. These cookies will be stored in your browser only with your consent. You also have the option to opt-out of these cookies. But opting out of some of these cookies may affect your browsing experience.
Necessary cookies are absolutely essential for the website to function properly. These cookies ensure basic functionalities and security features of the website, anonymously.
Cookie
Duration
Description
cookielawinfo-checkbox-analytics
11 months
This cookie is set by GDPR Cookie Consent plugin. The cookie is used to store the user consent for the cookies in the category "Analytics".
cookielawinfo-checkbox-functional
11 months
The cookie is set by GDPR cookie consent to record the user consent for the cookies in the category "Functional".
cookielawinfo-checkbox-necessary
11 months
This cookie is set by GDPR Cookie Consent plugin. The cookies is used to store the user consent for the cookies in the category "Necessary".
cookielawinfo-checkbox-others
11 months
This cookie is set by GDPR Cookie Consent plugin. The cookie is used to store the user consent for the cookies in the category "Other.
cookielawinfo-checkbox-performance
11 months
This cookie is set by GDPR Cookie Consent plugin. The cookie is used to store the user consent for the cookies in the category "Performance".
viewed_cookie_policy
11 months
The cookie is set by the GDPR Cookie Consent plugin and is used to store whether or not user has consented to the use of cookies. It does not store any personal data.
Functional cookies help to perform certain functionalities like sharing the content of the website on social media platforms, collect feedbacks, and other third-party features.
Performance cookies are used to understand and analyze the key performance indexes of the website which helps in delivering a better user experience for the visitors.
Analytical cookies are used to understand how visitors interact with the website. These cookies help provide information on metrics the number of visitors, bounce rate, traffic source, etc.
Advertisement cookies are used to provide visitors with relevant ads and marketing campaigns. These cookies track visitors across websites and collect information to provide customized ads.