A quick and dirty answer is often more helpful than a fancy model

On July 16, 1945, during the first nuclear bomb test conducted at Los Alamos, physicist Enrico Fermi dropped small pieces of paper and observed how far they moved when the blast wave reached him.
Based on this, he estimated the approximate magnitude of the yield of the bomb. No fancy equipment or rigorous measurements; just some directional data and logical reasoning.
About 40 seconds after the explosion the air blast reached me. I tried to estimate its strength by dropping from about six feet small pieces of paper before, during and after the passage of the blast wave. […] I estimated to correspond to the blast that would be produced by then thousand tons of T.N.T. — Enrico Fermi
This estimate turned out to be remarkably accurate considering how it was produced.
We’re forced to do quick-and-dirty approximations all the time. Sometimes we don’t have the data we need for a rigorous analysis, other times we simply have very little time to provide an answer.
Unfortunately, estimates didn’t come naturally to me. As a recovering perfectionist, I wanted to make my analyses as robust as possible. If I’m wrong and I took a quick-and-dirty approach, wouldn’t that make me look careless or incapable?
But over time, I realized that making a model more and more complex rarely leads to better decisions.
Why?
- Most decisions don’t require a hyper-accurate analysis; being in the right ballpark is sufficient
- The more complex you make the model, the more assumptions you layer on top of each other. Errors compound, and it becomes harder to make sense of the whole thing
Napkin math, back-of-the-envelope calculations: Whatever you want to call it, it’s how management consultants and BizOps folks cut through complexity and get to robust recommendations quickly.
And all they need is structured thinking and a spreadsheet.
My goal with this article is to make this incredibly useful technique accessible to everyone.
In this article, I will cover:
- How to figure out how accurate your analysis needs to be
- How to create estimates that are “accurate enough”
- How to get people comfortable with your estimates
Let’s get into it.
Part 1: How accurate do you need to be?
Most decisions businesses make don’t require a high-precision analysis.
We’re typically trying to figure out one of four things:
Scenario 1: Can we clear a minimum bar?
Often, we only need to know if something is going to be better / larger / more profitable than X.
For example, large corporations are only interested in working on things that can move the needle on their top or bottom line. Meta does over $100B in annual revenue, so any new initiative that doesn’t have the potential to grow to a multi-billion $ business eventually is not going to get much attention.
Once you start putting together a simple back-of-the-envelope calculation, you’ll quickly realize whether your projections land in the tens of millions, hundreds of millions, or billions.
If your initial estimate is way below the bar, there is no point in refining it; the exact answer doesn’t matter at that point.
Other examples:
- VCs trying to understand if the market opportunity for a startup is big enough to grow into a unicorn
- You’re considering joining an early-stage company and are trying to understand if it can ever grow into its high valuation (e.g. AI or autonomous driving companies)
Get an email whenever Torsten Walbaum publishes.
Scenario 2: Can we stay below a certain level?
This scenario is the inverse of the one above.
For example, let’s say the CMO is considering attending a big industry conference last minute. He is asking whether the team will be able to pull together all the necessary pieces (e.g. a booth, supporting Marketing campaigns etc.) in time and within a budget of $X million .
To give the CMO an answer, it’s not that important by when exactly you’ll have all of this ready, or how much exactly this will cost. At the moment, he just needs to know whether it’s possible so that he can secure a slot for your company at the conference.
The key here is to use very conservative assumptions. If you can meet the timeline and budget even if things don’t go smoothly, you can confidently give green light (and then work on a more detailed, realistic plan).
Other examples:
- Your manager wants to know if you have bandwidth to take on another project
- You are setting a Service Level Agreement (SLA) with a customer (e.g. for customer support response times)
Scenario 3: How do we stack-rank things?
Sometimes, you’re just trying to understand if thing A is better than thing B; you don’t necessarily need to know exactly how good thing A is.
For example, let’s say you’re trying to allocate Engineering resources across different initiatives. What matters more than the exact impact of each project is the relative ranking.
As a result, your focus should be on making sure that the assumptions you’re making are accurate on a relative level (e.g. is Eng effort for initiative A higher or lower than for initiative B) and the methodology is consistent to allow for a fair comparison.
Other examples:
- You’re trying to decide which country you should expand into next
- You want to understand which Marketing channel you should allocate additional funds to
Scenario 4: What’s our (best) estimate?
Of course, there are cases where the actual number of your estimate matters.
For example, if you are asked to forecast the expected support ticket volume so that the Customer Support team can staff accordingly, your estimate will be used as a direct input to the staffing calculation.
In these cases, you need to understand 1) how sensitive the decision is to your analysis, and 2) whether it’s better if your estimate is too high or too low.
- Sensitivity: Sticking with the staffing example, you might find that a support agent can solve 50 tickets per day. So it doesn’t matter if your estimate is off by a bunch of tickets; only once you’re off by 50 tickets or more, the team would have to staff one agent more or less.
- Too high or too low: It matters in which direction your estimate is wrong. In the above example, being understaffed or overstaffed has different costs to the business. Check out my previous post on the cost of being wrong for a deep dive on this.
Part 2: How to create estimates that are “accurate enough”
You know how accurate you need to be — great. But how do you actually create your estimate?
You can follow these steps to make your estimate as robust as possible while minimizing the amount of time you spend on it:
Step 1: Building a structure
Let’s say you work at Netflix and want to figure out how much money you could make from adding games to the platform (if you monetized them through ads).
How do you structure your estimate?
The first step is to decompose the metric into a driver tree, and the second step is to segment.
Developing a driver tree
At the top of your driver tree you have “Games revenue per day”. But how do you break out the driver tree further?
There are two key considerations:
1. Pick metrics you can find data for.
For example, the games industry uses standardized metrics to report on monetization, and if you deviate from them, you might have trouble finding benchmarks (more on benchmarks below).
2. Pick metrics that minimize confounding factors.
For example, you could break revenue into “# of users” and “Average revenue per user”. The problem is that this doesn’t consider how much time users spend in the game.
To address this issue, we could split revenue out into “Hours played” and “$ per hour played” instead; this ensures that any difference in engagement between your games and “traditional” games does not affect the results.
You can then break out each metric further, e.g.:
- “$ per hour played” could be calculated as “# ad impressions per hour” times “$ per ad impression”
- “Hours played” could be broken out into “Daily Active Users (DAU)” and “Hours per DAU”
However, adding more detail is not always beneficial (more on that below).
Segmentation
In order to get a useful estimate, you need to consider the key dimensions that affect how much revenue you’ll be able to generate.
For example, Netflix is active in dozens of countries with vastly different monetization potential and to account for this, you can split the analysis by region.
Which dimensions are helpful in getting a more accurate estimate depends on the exact use case, but here are a few common ones to consider:
- Geography
- User demographics (age, device, etc.)
- Revenue stream (e.g. ads vs. subscriptions vs. transactions)
“Okay, great, but how do I know when segmentation makes sense?”
There are two conditions that need to be true for a segmentation to be useful:
- The segments are very different (e.g. revenue per user in APAC is multiple times less than in the US)
- You have enough information to make informed assumptions for each segment
You also need to make sure the segmentation is worth the effort. In practice, you’ll often find that only one or two metrics are materially different between segments.
Here’s what you can do in that case to get a quick-and-dirty answer:
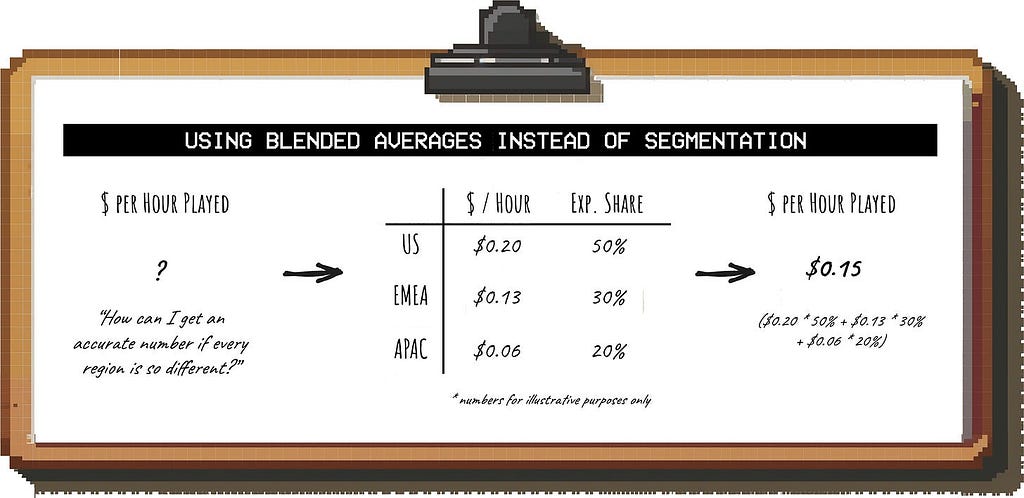
Instead of creating multiple separate estimates, you can calculate a blended average for the metric that has the biggest variance across segments.
So if you expect “$ per hour played” to vary substantially across regions, you 1) make an assumption for this metric for each region (e.g. by getting benchmarks, see below) and 2) estimate what the country mix will be:

You then use that number for your estimate, eliminating the need to segment.
How detailed should you get?
If you have solid data to base your assumptions on, adding more detail to your analysis can improve the accuracy of your estimate; but only up to a point.
Besides increasing the effort required for the analysis, adding more detail can result in false precision.

So what falls into the “too much detail” bucket? For the sake of a quick and dirty estimation, this would include things like:
- Segmenting by device type (Smart TV vs. Android vs. iOS)
- Considering different engagement levels by day of week
- Splitting out CPMs by industry
- Modeling the impact of individual games
- etc.
Adding this level of detail would increase the number of assumptions exponentially without necessarily making the estimate more accurate.
Step 2: Putting numbers against each metric
Now that you have the inputs to your estimate laid out, it’s time to start putting numbers against them.
Internal data
If you ran an experiment (e.g. you rolled out a prototype for “Netflix games” to some users) and you have results you can use for your estimate, great. But a lot of the time, that’s not the case.
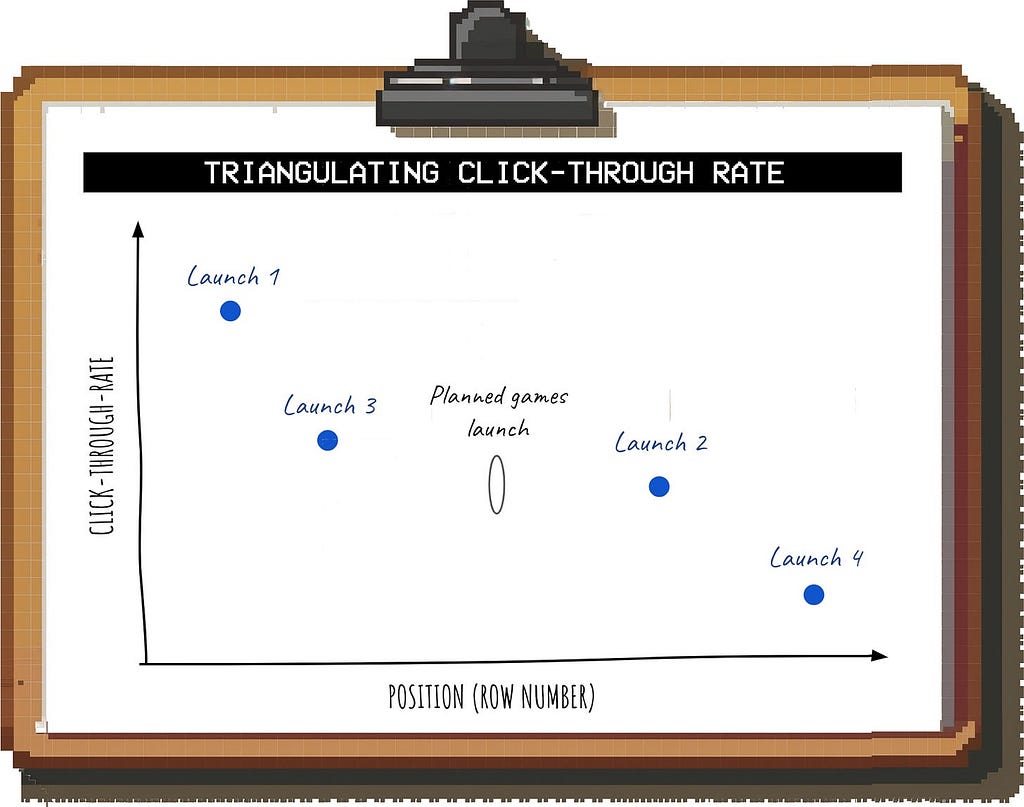
In this case, you have to get creative. For example, let’s say that to estimate our DAU for games, we want to understand how many Netflix users might see and click on the games module in their feed.
To do this, you can compare it against other launches with similar entry points:
- What other new additions to the home screen did you launch recently?
- How did their performance differ depending on their location (e.g. the first “row” at the top of the screen vs. “below the fold” where you have to scroll to find it)?
Based on the last few launches, you can then triangulate the expected click-through-rate for games:

These kind of relationships are often close enough to linear (within a reasonable range) so that this type of approximation yields useful results.
Once you get some actual data from an experiment or the launch, you can refine your assumptions.
External benchmarks
External benchmarks (e.g. industry reports, data vendors) can be helpful to get the right ballpark for a number if internal data is unavailable.
There are a few key considerations:
- Pick the closest comparison. For example, casual games on Netflix are closer to mobile games than PC or console games, so pick benchmarks accordingly
- Make sure your metric definitions are aligned. Just because a metric in an external report sounds similar doesn’t mean it’s identical to your metric. For example, many companies define “Daily Active Users” differently.
- Choose reputable, transparent sources. If you search for benchmarks, you will come across a lot of different sources. Always try to find an original source that uses (and discloses!) a solid methodology (e.g. actual data from a platform rather than surveys). Bonus points if the report is updated regularly so that you can refresh your estimate in the future if necessary.
Deciding on a number
After looking at internal and external data from different sources, you will likely have a range of numbers to choose from for each metric.
Take a look at how wide the range is; this will show you which inputs move the needle on the answer the most.
For example, you might find that the CPM benchmarks from different reports are very similar, but there is a very wide range for how much time users might spend playing your games on a daily basis.
In this case, your focus should be on fine-tuning the “hours played” assumption:
- If there is a minimum amount of revenue the business wants to see to invest in games, see if you can reach that level with the most conservative assumption
- If there is no minimum threshold, try to use sanity checks to determine a realistic level.
For example, you could compare the play time you’re projecting for games against the total time users currently spend on Netflix.
Even if some of the time is incremental, it’s unrealistic that more than, say, 5% — 10% of the total time is spent on games (most of the users came to Netflix for video content, and there are better gaming offerings out there, after all).
Part 3: How to get people comfortable with your estimates
If you’re doing a quick-and-dirty estimate, people don’t expect it to be perfectly accurate.
However, they still want to understand what it would take for the numbers to be so different that they would lead to a different decision or recommendation.
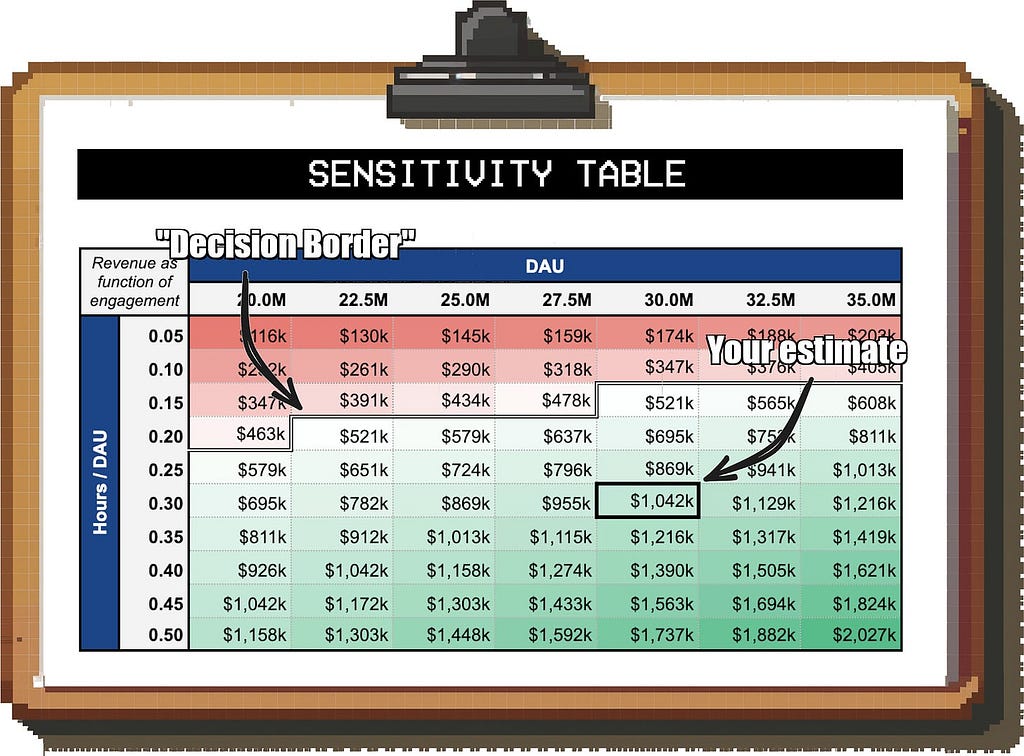
A good way to visualize this is a sensitivity table.
Let’s say the business wants to reach at least $500k in ad revenue per day to even think about launching games. How likely are you to reach this?
On the X and Y axis of the table, you put the two input metrics that you feel least sure about (e.g. “Daily Active Users (DAU)” and “Time Spent per DAU”); the values in the table represent the number you’re estimating (in this case, “Games revenue per day”).

You can then compare your best estimate against the minimum requirement of the business; for example, if you’re estimating 30M DAU and 0.3 hours of play time per DAU, you have a comfortable buffer to be wrong on either assumption.
Closing thoughts
While it’s called napkin math, three lines scribbled on a cocktail napkin are rarely enough for a solid estimate.
However, you also don’t need a full-blown 20-tab model to get a directional answer; and often, that directional answer is all you need to move forward.
Once you get comfortable with rough estimates, they allow you move faster than others who are still stuck in analysis paralysis. And with the time you save, you can tackle another project — or go home and do something else.
For more hands-on analytics advice, consider following me here on Medium, on LinkedIn or on Substack.
Mastering Back-of-the-Envelope Math Will Make You a Better Data Scientist was originally published in Towards Data Science on Medium, where people are continuing the conversation by highlighting and responding to this story.
Originally appeared here:
Mastering Back-of-the-Envelope Math Will Make You a Better Data Scientist
Go Here to Read this Fast! Mastering Back-of-the-Envelope Math Will Make You a Better Data Scientist
