How easy is it to transition from Python to Rust?

Sometimes, you must display vast amounts of data on an interactive map while keeping it usable and responsive. Interactive online maps are implemented in HTML, and adding many visual elements to the map display generally degrades performance and usability. A possible alternative is to draw all of the elements offline and display them over the map as a transparent layer using tiles. Each square tile neatly overlaps the map’s tiles, and the interactive map control handles far fewer visual elements.
I addressed this issue a few years ago by writing a custom map tile generator using Python and data from the Vehicle Energy Dataset. This project illustrated how to display massive amounts of information on an interactive online map by using custom tile layers over the map. The process involves using a web application that generates, caches and serves the tiles.
Displaying Geographic Information Using Custom Map Tiles
As you know, Python is not fast, so there is a significant performance hit while the web application generates each tile. When a tile is cached, the serving process is quick and is not noticeable while interacting with the map.
Still, I was unhappy with the performance, so I wanted to solve the problem again by dramatically improving the code execution speed. At first, I thought about converting the code base to Cython, but then my attention was diverted to another candidate.
Enter Rust
The Rust programming language has been on my radar for quite some time. With a background in C, C++ and C#, I was intrigued by the language’s promise of memory safety and C-like performance. I finally decided to have a go at it, and this problem looked like a perfect starting point to learn and exercise the language.
After reviewing many YouTube videos and diverse written material, I started using Rust to address this problem. I had three primary questions: How hard is it to create a web application, access SQLite data, and programmatically create a transparent PNG image? Fortunately, the answers to these questions were more straightforward to respond to than anticipated.
Rocket
To answer the web application question, I turned to Rocket. The Getting Started page from Rocket’s online documentation shows how easy it is to set up a basic web application. We will surely need more complexity to build our tile server, but the boilerplate seems minimal and straightforward. And, as it turned out to be, Rocket is very easy to use and adapt. It’s a keeper to me.
sqlx
After a few minutes online, I quickly realized that the most popular answer to accessing SQLite databases was through the sqlx package. It presents a different paradigm from the one I used in Python but much closer to the one I used in my former life when I developed in C#. Instead of generic data structures or Pandas DataFrames, you must use strongly typed data structures here. Although they are a bit more laborious to work with, they will bring an extra layer of sanity to your life.
Figure 1 below shows the first complete code sample I used to retrieve the data from the level range table.
PNG
Creating, drawing, and saving PNG files using the image crate is easy. The code to create a transparent tile is quite simple:
I also used the colorgrad package to handle the color gradient for the tiles.
Before I discuss the code in detail, let’s review the principle behind drawing the traffic density tiles.
It’s Tiles All The Way Down
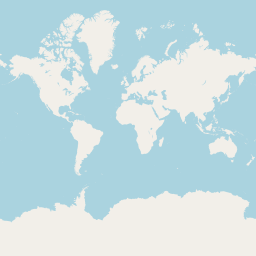
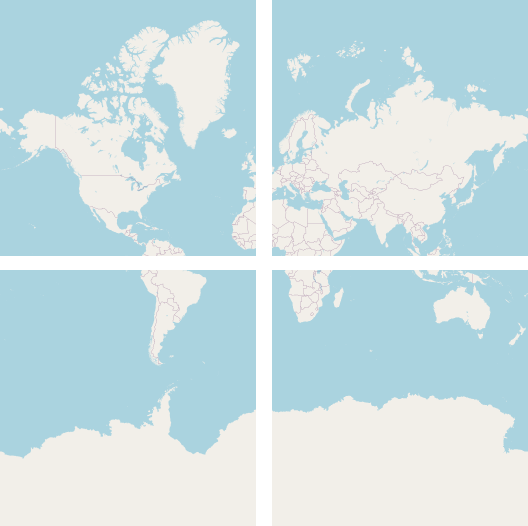
Map tiles usually consist of square 256×256 bitmaps. We may address each tile by combining x and y coordinates, a “zoom” level, or a quadkey code. To each zoom level corresponds a square patchwork of tiles of different dimensions. The whole Earth is depicted on a single tile at the topmost level. By zooming in, the original tile is split up into four tiles. The following Figures 2 and 3 illustrate the process of zooming in.


If we keep zooming in, and after eight iterations, each resulting tile corresponds to a pixel on the first tile. This observation is the insight that allows us to compute and display the traffic density information on the tiles.
As described in the previous article, the tile information is prepared and stored in a database. Please refer to that article for instructions on generating the density database from the Vehicle Energy Dataset.
Serving Tiles With Rust
We can now discuss the Rust server code to generate, cache, and serve tiles. The present solution closely follows the previous tile server design. Figure 5 below shows the main entry point that decides whether to provide a painted tile or the default transparent one after parsing and accepting the query parameters.
As you can see, the server replies to zoom levels ranging from one to eighteen only. This limitation was baked into the data generation process for the density database.
The web application draws each tile using the function listed in Figure 6 below.
As you can see from the listing above, the tile painting process has three steps. First, on line 12, we collect the tile’s per-pixel density information. Next, we retrieve the tile’s level range, i.e., the minimum and maximum density levels for the tile’s “zoom” level. Finally, on line 14, we paint the tile’s bitmap. The function finalizes by saving the tile bitmap to the file cache.
Using the Code
After correctly configuring the database file path, you start the tile server by opening a terminal window, changing to the Rust project directory, and running the following command:
cargo run --release
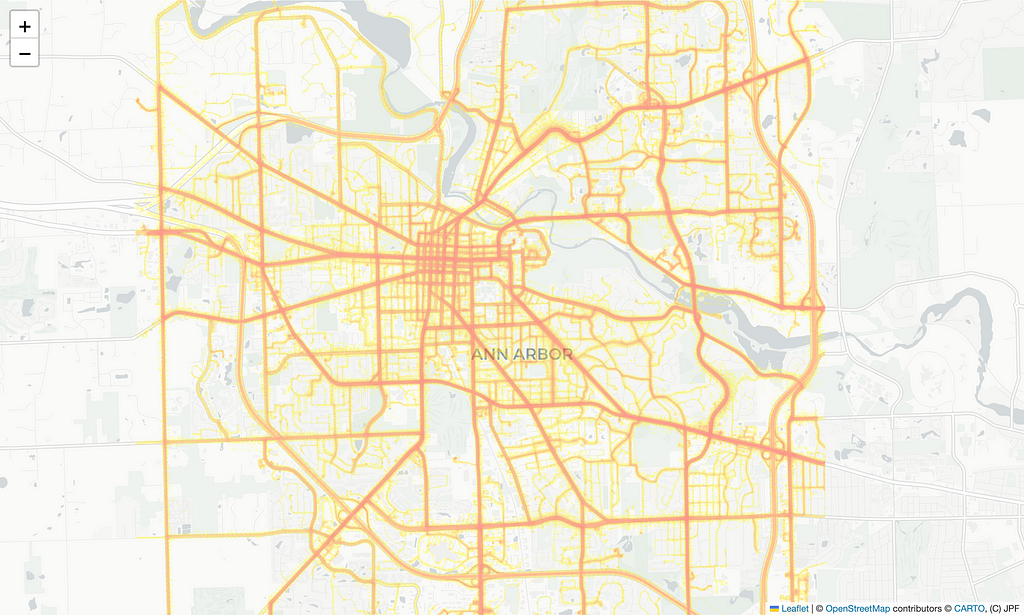
Next, you can open the map client and configure the density tile layer URI. Figure 8 below shows the Jupyter Notebook code cell to load the interactive map:
And that’s it! Figure 9 below displays the result.

Conclusion
My first foray into Rust was not nearly as difficult as I expected. I started by immersing myself in the available literature and YouTube videos before giving it a go. Next, I ensured I was using a helping hand with a great IDE from JetBrains: RustRover. Although still in preview mode, I found this IDE helpful and instructive when using Rust. Still, you will also be perfectly fine if you prefer Visual Studio Code. Just make sure you get the sanctioned plugins.
Credits
I used Grammarly to review the writing and accepted several of its rewriting suggestions.
JetBrains’ AI assistant wrote some of the code, and I also used it to learn Rust. It has become a staple of my everyday work with both Rust and Python.
Licensing Information
The Extended Vehicle Energy Dataset is licensed under Apache 2.0, like its originator, the Vehicle Energy Dataset.
References
Vehicle Energy Dataset (GitHub)
João Paulo Figueira is a Data Scientist at tb.lx by Daimler Truck in Lisbon, Portugal.
Generating Map Tiles with Rust was originally published in Towards Data Science on Medium, where people are continuing the conversation by highlighting and responding to this story.
Originally appeared here:
Generating Map Tiles with Rust