Causal AI, exploring the integration of causal reasoning into machine learning

What is this series of articles about?
Welcome to my series on Causal AI, where we will explore the integration of causal reasoning into machine learning models. Expect to explore a number of practical applications across different business contexts.
In the last article we covered validating the causal impact of the synthetic control method. In this article we will move onto enhancing marketing mix modelling with Causal AI.
If you missed the last article on synthetic controls, check it out here:
Validating the Causal Impact of the Synthetic Control Method
Introduction
Ongoing challenges with digital tracking has led to a recent resurgence in marketing mix modelling (MMM). At the recent Causal AI conference, Judea Pearl suggested that marketing may be the first industry to adopt Causal AI. So I decided it was time start writing about my learnings from the last 7 years in terms of how MMM, Causal AI and experimentation intersect.
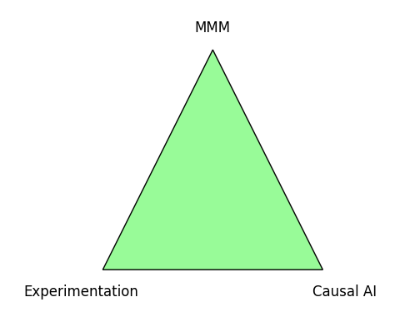
The following areas will be explored:
- What is MMM?
- How can Causal AI enhance MMM?
- What experiments can we run to complete the triangulation?
- Outstanding challenges within marketing measurement.
The full notebook can be found here:
What is MMM?
MMM is a statistical framework used to estimate how much each marketing channel contributes to sales. It’s heavily influenced by econometrics and in its simplest form is a regression model. Let’s cover the basics of the key components!
Regression
A regression model is constructed where the dependent variable/target (usually sales) is predicted based on several independent variables/features — These usually include the spend on different marketing channels and external factors that may effect demand.

The coefficients of the spend variables indicate how much they contribute to sales.
The PyMC marketing package in python is a great place to start exploring MMM:
MMM Example Notebook – pymc-marketing 0.6.0 documentation
Ad stock
Ad stock refers to the lingering effect of marketing spend (or adverting spend) on consumer behaviour. It helps model the long-term effects of marketing. It’s not common behaviour to rush to purchase a product the first time you hear about a brand — the idea of ad stock is that the effect of marketing is cumulative.
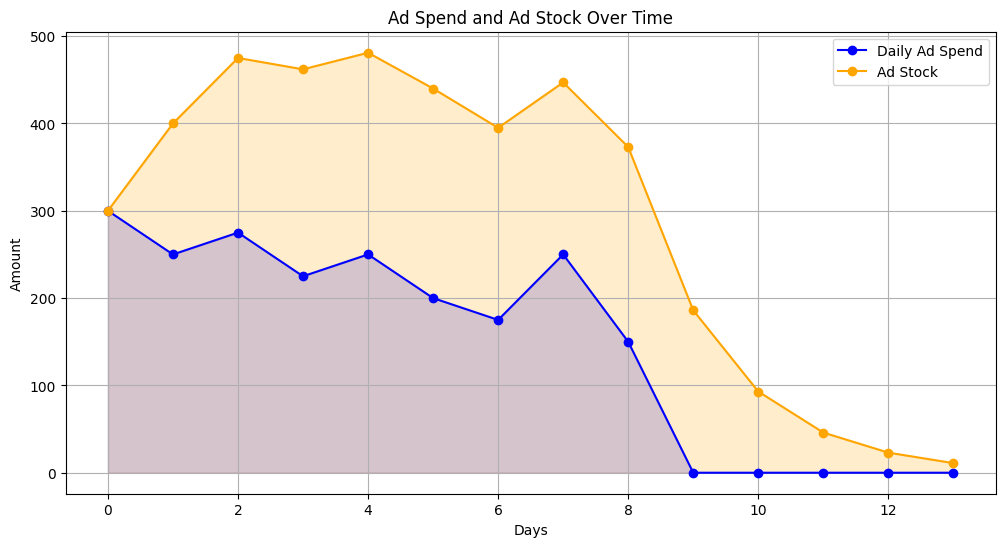
The most common ad stock method is geometric decay, which assumes that the impact of advertising decays at a constant rate over time. Although this is relatively easy to implement, it is not very flexible. It’s worth checking out the Weibull method which is much more flexible — The PyMC marketing package has implemented it so be sure to check it out:
weibull_adstock – pymc-marketing 0.6.0 documentation
Saturation
Saturation in the context of marketing refers to the idea of diminishing returns. Increasing marketing spend can increase customer acquisition, but as time goes on it becomes more difficult to influence new audiences.
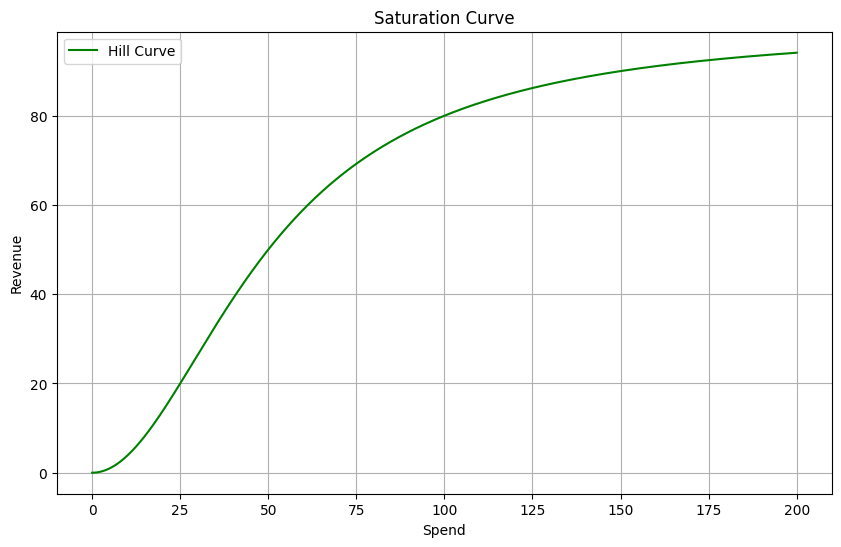
There are several saturation methods we could use. The Michaelis-Menton function is a common one — You can also check this out in the PyMC marketing package:
michaelis_menten – pymc-marketing 0.6.0 documentation
How can Causal AI enhance MMM?
MMM frameworks usually use a flat regression model. However, there are some complexities to how marketing channels interact with each other. Is there a tool from our Causal AI toolbox which can help with this?
Causal graphs
Causal graphs are great at disentangling causes from correlations which make them a great tool for dealing with the complexities of how marketing channels interact with each other.
If you are unfamiliar with causal graphs, use my previous article to get up to speed:
Using Causal Graphs to answer causal questions
Understanding the marketing graph
Estimating the causal graph in situations where you have poor domain knowledge available is challenging. But we can use causal discovery to help get us started – Check out my previous article on causal discovery to find out more:
Making Causal Discovery work in real-world business settings
Causal discovery has its limitations and should just be used to create a starting hypothesis for the graph. Luckily, there is a vast amount of domain knowledge around how marketing channels interact with each other that we can build in!
Below I share the knowledge I have picked up from working with marketing experts over the years…
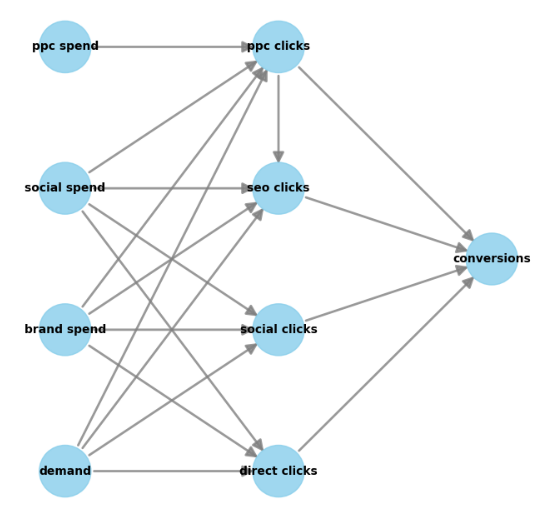
- PPC (paid search) has a negative effect on SEO (organic search). The more we spend on PPC the less SEO clicks we get. However, we have an important confounder….demand! A flat regression model will not pick up this intricacy often leading to an overestimation of PPC.
- Social spend has a strong effect on social clicks, the more we spend the more prospects click on social ads. However, some prospects may view an social ad and the next day visit your site via PPC, SEO or Direct. A flat regression model will not pick up this halo effect.
- A similar case can be made for brand spend, where you target prospects with longer term branding messages but no direct call to action to click. These prospects may visit your site via PPC, SEO or Direct at a later stage after becoming aware of your brand.
- The clicks are mediators. If we run a flat regression and include mediators, this can cause issues when estimating causal effects. I won’t cover this topic in too much detail here, but using causal graphs enables us to carefully control for the right variables when estimating causal effects.
Hopefully you can see from the examples above that using a causal graph instead of a flat regression will seriously enhance your solution. The ability to calculate counterfactuals and perform interventions also make it very attractive!
It’s worth noting that it is still worth incorporating the ad stock and saturation transformations into your framework.
What experiments can we run to complete the triangulation?
When working with observational data, we should also be striving to run experiments to help validate assumptions and complement our causal estimates. There are three main tests available to use in acquisition marketing. Let’s dive into them!
Conversion lift tests
Social platforms like Facebook and Snapchat allow you to run conversion lift tests. This is an AB test where we measure the uplift in conversion using a treatment vs control group. These can be very useful when it comes to evaluating the counterfactual from your causal graph for social spend.
Geo lift tests
Geo lift tests can be used to estimate the effect of marketing blackouts or when you start using a new channel. This can be particularly useful for brand digital and TV where there is no direct call to action to measure. I cover this in much more detail in the last article:
Validating the Causal Impact of the Synthetic Control Method
Switch back testing
PPC campaigns can be scheduled to be turned off and on hourly. This creates a great opportunity for switchback testing. Schedule PPC campaigns to be turned off and on each hour for a few weeks, and then calculate the difference between the number of PPC + SEO clicks in the off vs on period. This will help you understand how much of PPC can be captured by SEO, and therefore evaluate the counterfactual from your causal graphs for PPC spend.
I think running experiments is a great way to tweak and then gain confidence in your causal graph. But results could also be used to calibrate your model. Take a look at how the PyMC team have approached this:
Lift Test Calibration – pymc-marketing 0.6.0 documentation
Outstanding challenges within marketing measurement
Today I went into how you can enhance MMM with Causal AI. However, Causal AI can’t solve all of the challenges within acquisition marketing— And there are lots of them unfortunately!
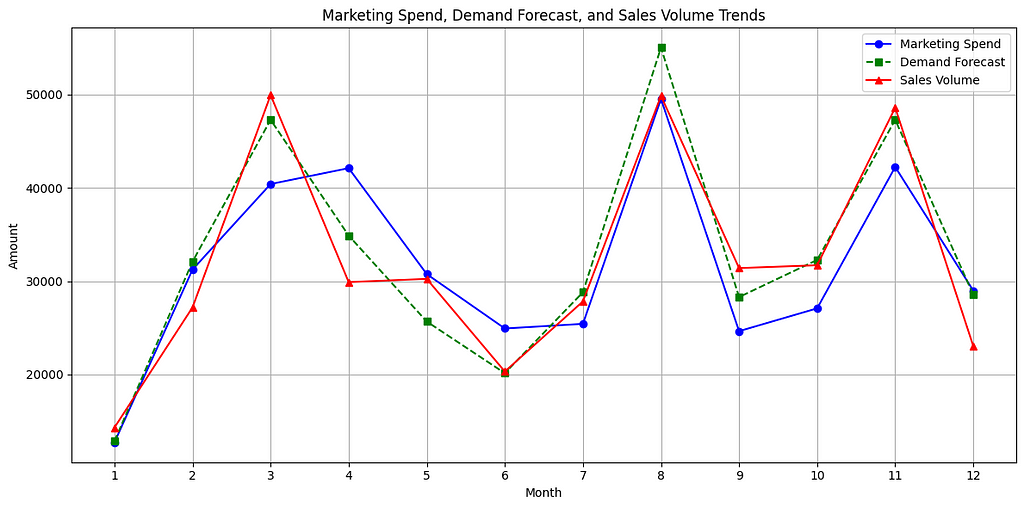
- Spend following the demand forecast — One reason for marketing spend being highly correlated with sales volume can be down to the marketing team spending in-line with a demand forecast. One solution here is to randomly shift spend by -10% to +10% each week to add some variation. As you can imagine, the marketing team usually aren’t too keen on this approach!
- Estimating demand — Demand is an essential variable in our model. However, it can be very difficult to collect data on. A reasonable option is extracting google trend data on a search term which aligns to the product you are selling.
- Long term effects of brand — Long term effects of brand are hard to capture as there usually isn’t much signal around this. Long term geo lift tests can help here.
- Multi-collinearity — This is actually one of the biggest problems. All of the variables we have are highly correlated. Using ridge regression can alleviate this a little, but it can still be a problem. A causal graph can help a little too as it essential breaks the problem down into smaller models.
- Buy-in from the marketing team — In my experience this will be your biggest challenge. Causal graphs offer a nice visual way of engaging the marketing team. It also creates an opportunity for you to build up a relationship whilst working with them to agree the intricacies of the graph.
I’ll close things off there — It would be great to hear what you think in the comments!
Follow me if you want to continue this journey into Causal AI —In the next article we will investigate whether Causal AI can improve our forecasting.
Enhancing Marketing Mix Modelling with Causal AI was originally published in Towards Data Science on Medium, where people are continuing the conversation by highlighting and responding to this story.
Originally appeared here:
Enhancing Marketing Mix Modelling with Causal AI
Go Here to Read this Fast! Enhancing Marketing Mix Modelling with Causal AI