Whether or not you’ve heard of a white elephant gift exchange before, there’s a good chance you have the wrong idea of what it is, how it actually works and where the idea came from. According to legend, the King of Siam would give a white elephant to courtiers who had upset them. It was a far more devious punishment than simply having them executed. The recipient had no choice but to simply thank the king for such an opulent gift, knowing that they likely could not afford the upkeep for such an animal. It would inevitably lead them to financial ruin.
This story is almost certainly untrue, but it has led to a modern holiday staple: the white elephant gift exchange. Picking the right white elephant gift means walking a fine line: the goal isn’t to just buy something terrible and force someone to take it home with them. Rather, it should be just useful or amusing enough that it won’t immediately get tossed into the trash. The recipient also shouldn’t be able to just throw it in a junk drawer and forget about it. So here are a few suggestions that will not only get you a few chuckles, but will also make the recipient feel (slightly) burdened.
White elephant FAQs
What is white elephant?
A white elephant gift exchange is a party game typically played around the holidays in which people exchange funny, impractical gifts.
How does white elephant work?
A group of people each bring one wrapped gift to the white elephant gift exchange, and each gift is typically of a similar value. All gifts are then placed together and the group decides the order in which they will each claim a gift. The first person picks a white elephant gift from the pile, unwraps it and their turn ends. The following players can either decide to unwrap another gift and claim it as their own, or steal a gift from someone who has already taken a turn. The rules can vary from there, including the guidelines around how often a single item can be stolen — some say twice, max. The game ends when every person has a white elephant gift.
Why is it called white elephant?
The term “white elephant” is said to come from the legend of the King of Siam gifting white elephants to courtiers who upset him. While it seems like a lavish gift on its face, the belief is that the courtiers would be ruined by the animal’s upkeep costs.
This article originally appeared on Engadget at https://www.engadget.com/the-7-best-white-elephant-gifts-that-are-worth-stealing-150516076.html?src=rss
On Friday, the Consumer Financial Protection Bureau (CFPB) sued four financial companies involved with Zelle. The CFPB’s lawsuit (viaCNBC) accuses Zelle’s operator (Early Warning Services) and three of the service’s partner banks — JPMorgan Chase, Bank Of America and Wells Fargo — of failing to protect consumers from widespread fraud on the peer-to-peer payment system.
The CFPB says customers of those three banks have lost over $870 million during Zelle’s seven years as a payment service. The suit claims hundreds of thousands of customers who filed fraud complaints were denied meaningful assistance, with some being told to “contact the fraudsters directly to recover their money.” (Pro tip: Don’t do that.)
“The nation’s largest banks felt threatened by competing payment apps, so they rushed to put out Zelle,” CFPB Director Rohit Chopra wrote in a statement. “By their failing to put in place proper safeguards, Zelle became a gold mine for fraudsters, while often leaving victims to fend for themselves.”
The CFPB says one of the system’s loopholes is that its “tokens” (linked US phone numbers or email addresses) can be used and reassigned across different banks. The agency claims fraudsters can exploit this by connecting a victim’s number or email to the perpetrator’s deposit account, causing payments meant for the consumer to go to the scammer’s account instead.
The suit accuses Zelle and the banks of allowing repeat offenders to bounce between financial institutions with impunity. “Banks did not share information about known fraudulent transactions with other banks on the network,” the CFPB wrote. “As a result, bad actors could carry out repeated fraud schemes across multiple institutions before being detected, if they were detected at all.”
The CFPB also claims the defendant banks didn’t heed red flags to prevent further fraud, report incidents consistently or on time, properly investigate customer complaints or take appropriate action.
On Friday, Zelle framed the government’s lawsuit as a political hit that would help criminals and force them to charge fees. “The CFPB’s attacks on Zelle are legally and factually flawed, and the timing of this lawsuit appears to be driven by political factors unrelated to Zelle,” Jane Khodos, Zelle spokesperson, wrote in a statement. “Zelle leads the fight against scams and fraud and has industry-leading reimbursement policies that go above and beyond the law. The CFPB’s misguided attacks will embolden criminals, cost consumers more in fees, stifle small businesses and make it harder for thousands of community banks and credit unions to compete.”
In September, JPMorgan Chase wrote in a quarterly filing (via CNBC) that it would consider counter-litigation if the CFPB took action against the bank for its role with Zelle.
Last month, The Washington Postreported that President-elect Donald Trump and Congressional Republicans plan to limit the CFPB’s funding and powers, aligning with the agendas of large financial institutions. Elon Musk and Vivek Ramaswamy, his “government efficiency” advisors, have said they want to eliminate the agency, which was established in 2011 in response to the 2007-08 financial crisis and resulting recession.
Killing the agency would require a congressional vote that wouldn’t likely pass, given Republicans’ thin majorities. But they could do what Trump did in his first term: appoint a new director to slow or stop regulatory actions, effectively kneecapping the agency as long as they’re in charge.
This article originally appeared on Engadget at https://www.engadget.com/cybersecurity/the-us-consumer-financial-protection-bureau-sues-zelle-and-four-of-its-partner-banks-175714692.html?src=rss
Netflix has inked a deal with FIFA to snag exclusive US broadcasting rights to the next two Women’s World Cup tournaments, according to a report by ESPN. This contract covers both the 2027 and 2031 events.
Neither entity has described the financial value of the deal, but it has been reported to be the most significant contract that FIFA has ever signed with a streaming service for a major tournament. FIFA president Gianni Infantino called it a “landmark moment for sports media rights and a “truly historic day for broadcasting and for women’s football.”
This happened because FIFA unbundled the media rights for the women’s event for the very first time, which goes into effect after Fox airs the next Men’s World Cup in 2026. The 2027 Women’s World Cup is being held in Brazil. The 2031 event doesn’t have a home yet, but the US is expected to make a bid.
This is a fairly big deal for Netflix, given that FIFA reported that a full 1.12 billion people watched the 2019 Women’s World Cup, which the US won. This is a global number, of course, but the 2023 tournament recorded the highest-ever US domestic viewership. The sport is certainly catching on over on this side of the pond.
Netflix has been making big moves into the world of live sporting events as of late. There was that utterly ridiculous Jake Paul/Mike Tyson fight, but the platform will soon be home to the weekly WWE Monday Night Raw broadcast.
This article originally appeared on Engadget at https://www.engadget.com/entertainment/streaming/netflix-scores-the-broadcasting-rights-to-the-fifa-womens-world-cup-174017963.html?src=rss
The big ticket tech gifts may get the lion’s share of attention during the holidays, but it’s surprising how much people appreciate small and thoughtful accessories and gadgets. We picked out a dozen such stocking stuffers for under $50 — perfect for a little something extra for a loved one or a welcome gift for a coworker. Just be sure to check the shipping windows to make sure these handy gizmos will arrive in time. Here are some of our favorite techie gift ideas come in at $50 or less.
This article originally appeared on Engadget at https://www.engadget.com/computing/accessories/the-best-stocking-stuffers-for-50-or-less-130049421.html?src=rss
We’re less than a week from Christmas, and if you haven’t finished your holiday shopping, well, you should probably get on that. While it’s likely too late to get most items shipped by Wednesday morning, there are still tons of decent tech deals available for those you’re seeing after the holiday — or if you just want to treat yourself. For one, Sony’s WF-1000XM5, our pick for the best wireless earbuds, is down to an all-time low of $198, while the 10th-gen iPad is back at its best-ever price at $250. Several other gadgets we recommend are similarly discounted, including the PlayStation 5, Roku Streaming Stick 4K and Apple AirTags. Here are the best tech deals from this week you can still get today.
Sony WF-1000XM5 for $198 at Amazon ($102 off MSRP): The XM5s are the top pick in our guide to the best wireless earbuds, offering exceptional noise cancellation, a warm yet customizable sound, 8-12 hours of battery life and loads of handy bonus features. The design may not fit everyone’s ears comfortably, but it’s slimmer and lighter than previous versions. This discount matches the lowest price we’ve seen and undercuts the pair’s Black Friday deal by $30. Also at Target and Best Buy.
Apple iPad (10th gen) for $250 at Amazon ($99 off): This matches the best price we’ve seen for the budget pick in our iPad buying guide. Just note that it only applies to the silver model, and you’ll need to clip an on-page coupon to see the full discount at checkout. While the entry-level iPad lacks the laminated display, faster chip and wider accessory support of the iPad Air, it gets close enough to be a strong value for casual web browsing, reading and gaming.
Roku Streaming Stick 4K for $29 at Amazon ($21 off): A pick from our guide to the best streaming devices, the Roku Streaming Stick 4K is snappy and easy to navigate, with support for all the major HDR formats, streaming apps (Twitch aside) and Apple AirPlay. Its search function isn’t as comprehensive as some competing streamers, however, and the UI isn’t the most exciting to look at. This deal ties the price we saw on Black Friday; it’s a few bucks above than the stick’s all-time low but still $5 off its typical going rate in recent months. Also at Target and Best Buy.
$100 PlayStation Store gift card + $15 Target gift card for $100 at Target ($15 off, Target Circle only): If you pick up a digital PlayStation gift card worth $100 or more at Target, the retailer will toss in its own $15 e-gift card with your purchase. The catch is that you need a Target Circle membership to take advantage, though it’s at least free to sign up for that. If you often shop at Target and planned to pick up some PlayStation credit anyway, it’s hard to complain about bonus money either way. The same offer is available for Xbox gift cards as well. Target says both promos will expire on Friday.
The Sony PlayStation 5 (left) and PlayStation 5 Digital Edition.
PlayStation
Apple AirTags (4-pack) for $70 at Amazon ($29 off): Apple’s Bluetooth tracker is our top pick for iPhone users, unsurprisingly, as it accurately locates tagged items right from the Find My app. Its waterproof design and replaceable battery are nice, too, though you’ll need to grab a holder or case if you want to attach one to your keys. This deal isn’t quite an all-time low for a four-pack, but it beats the street price we’ve seen for most of the past month by a couple bucks. Also at Best Buy.
Apple Pencil (2nd gen) for $80 at Amazon ($49 off): This discount comes within a dollar of the best price to date for Apple’s second-gen Pencil stylus, which remains an accurate tool for sketching and notetaking. To be clear, though, you should only get it if you have an older iPad Air, Pro or mini and don’t plan on upgrading anytime soon. Otherwise, go for the Apple Pencil Pro, which works with the newer models and adds built-in Find My support, among other conveniences. Also at Target.
LG B4 OLED TV (48”) + $50 Best Buy gift card for $600 at Best Buy ($250 off): The B4 is LG’s entry-level OLED TV for 2024. It gets you the core benefits of any good OLED set — excellent contrast with deep black tones, wide viewing angles, fast motion, etc. — but it’s not as bright as some upper-tier OLEDs, so it’s better off in a darker room. That said, this is a stellar value if you don’t mind a smaller panel. This offer ties the largest cash discount we’ve seen and, unlike the deal we saw on Black Friday, it also includes with a $50 digital gift card.
Super Mario RPG for $30 at GameStop ($30 off): The SNES classic Super Mario RPG: Legend of the Seven Stars didn’t really need a Switch remake, but it got one last year anyway. Thankfully, the new version keeps the original’s oddball spirit intact as it spruces up the visuals for true 3D. If you’re in the mood for a lighter RPG, this price is an all-time low.
Anker Soundcore Space A40 for $45 at Amazon ($40 off): The Soundcore Space A40 is the longtime top pick in our guide to the best budget earbuds. While it can’t match the Sony XM5s in terms of sound quality and noise-canceling strength, it gets admirably close for way less cash. Wireless charging, multipoint connectivity, 8-10 hours of battery life and a compact design all help, though call quality is mediocre, and there’s no auto-pausing when you remove an earbud. This is the same deal we saw on Black Friday; outside of a couple drops for Costco members, it ties an all-time low. Also at Anker with an on-page coupon.
JLab Go Air Pop for $10 at Target ($15 off): The Go Air Pop is another pair we highlight in our budget earbuds buying guide. It’s about as basic as the price would suggest, with no active noise cancellation (ANC), an all-plastic design and a relatively boomy sound. JLab released a new ANC version in October. That said, the older model’s audio quality is still passable, its built-in touch controls actually work and it gets a solid 8-9 hours of battery life. If you just want a competent pair for as little money as possible, it’s hard to beat $10. This deal ties the Pop’s all-time low.
Keychron Q3 Max for $182 at Keychron ($32 off): The Keychron Q Max series is the top pick in our guide to the best mechanical keyboards, pairing an upscale (if heavy) aluminum case with a delightful typing experience and deep customizability. This ties the all-time low we saw on Black Friday for the tenkeyless model, but other sizes are discounted as well. Also at Amazon for $188, but only for Prime members.
The Google Pixel 8a.
Photo by Sam Rutherford/Engadget
Beats Pill for $100 at Amazon ($50 off): We gave the latest Beats Pill a score of 83 over the summer and currently recommend it in our Bluetooth speaker buying guide. It’s not the best pure value, and it struggles at maximum volume, but in general it pumps out strong bass without sounding imbalanced. A clean, water-resistant design, ample battery life and wired audio support over USB-C add to the appeal. This deal ties the speaker’s all-time low. Also at Target and Walmart.
Samsung Pro Plus (512GB) for $38 at Amazon ($38 off): The Pro Plus is the top pick in our guide to the best microSD cards. It’s not the cheapest option, but it was faster than most in our benchmark tests, with a particular edge in random performance. That helps it play a bit nicer in a portable gaming PC or a device like the Raspberry Pi, where it’d more frequently have to access smaller bits of data in random locations. The 512GB model here has previously sold for less, but this discount marks its lowest price since March. Also at Samsung and B&H.
Google Pixel 8a for $399 at Amazon ($100 off): This is the second-best price we’ve seen for an unlocked Pixel 8a, which we consider the best midrange phone for Android fans. It has most of the headline features you’d get from a flagship Pixel phone — excellent cameras, a crisp 120Hz OLED display, clean software with updates through 2031, solid performance and battery life — only it puts them in a slightly cheaper plastic frame with slower charging speeds. At this price, though, that should be easier to live with. Also at Target and Best Buy.
The Anker Prime Power Bank.
Photo by Amy Skorheim / Engadget
Anker Prime Power Bank for $78 at Amazon ($52 off): The Anker Prime is the premium pick in our guide to the best power banks. It may be overkill for most, but its hefty 20,000mAh capacity and pair of 100W USB-C ports mean it can recharge multiple laptops — let alone mobile devices — at full speed. There’s a 65W USB-A port as well, plus a handy display that keeps you updated on the battery’s status. This deal ties the lowest price we’ve seen. Also at Anker with an on-page coupon.
Anker 525 Charging Station for $30 at Amazon ($26 off, Prime only): We recommend this 67W desktop charging station in our remote worker gift guide. It’s not the fastest model around, but it packs four USB ports (two USB-C, two USB-A) and three AC outlets in a design that’s compact enough to fit on a crowded desk. This deal is another all-time low, though it’s only available to Prime members.
Twelve South AirFly Pro for $40 at Amazon ($15 off): Another holiday gift guide recommendation, the AirFly Pro is a Bluetooth transmitter that lets you pair up to two sets of wireless headphones to an inflight entertainment system, older treadmill or most other devices with a 3.5mm jack. This discount marks the lowest price we’ve seen in a couple of years. Also at Best Buy.
Follow @EngadgetDeals on Twitter and subscribe to the Engadget Deals newsletter for the latest tech deals and buying advice.
This article originally appeared on Engadget at https://www.engadget.com/deals/our-favorite-sony-earbuds-hit-an-all-time-low-plus-the-rest-of-the-weeks-best-tech-deals-173211089.html?src=rss
The winter solstice is upon us, which means that Christmas is next up — and that the clock for timely gift-giving is nearly expired. If you’re gifting for a tech fan, something from Apple, Google, Samsung or another big brand is always at the top of the list. But be prepared for sticker shock once you look at the price tags for their latest and greatest devices. Thankfully, you don’t have to spend hundreds of dollars to get a gift for someone that has all the cachet of a brand they know and love.
Apple, Samsung, Sony and other big tech companies all have affordable gear that comes in at $100 or less, you just have to know where to find them. These are some of our favorites, but remember: you can often find alternatives that are just as good (and sometimes better) than these. However, for the people in your life for which brand names really do matter, these gifts will speak to them.
This article originally appeared on Engadget at https://www.engadget.com/computing/accessories/the-best-tech-gifts-for-100-or-less-to-give-for-christmas-from-apple-samsung-and-more-130038897.html?src=rss
The Case for Predicting Full Probability Distributions in Decision-Making
Some people like hot coffee, some people like iced coffee, but no one likes lukewarm coffee. Yet, a simple model trained on coffee temperatures might predict that the next coffee served should be… lukewarm. This illustrates a fundamental problem in predictive modeling: focusing on single point estimates (e.g., averages) can lead us to meaningless or even misleading conclusions.
In “The Crystal Ball Fallacy” (Merckel, 2024b), we explored how even a perfect predictive model does not tell us exactly what will happen — it tells us what could happen and how likely each outcome is. In other words, it reveals the true distribution of a random variable. While such a perfect model remains hypothetical, real-world models should still strive to approximate these true distributions.
Yet many predictive models used in the corporate world do something quite different: they focus solely on point estimates — typically the mean or the mode — rather than attempting to capture the full range of possibilities. This is not just a matter of how the predictions are used; this limitation is inherent in the design of many conventional machine learning algorithms. Random forests, generalized linear models (GLM), artificial neural networks (ANNs), and gradient boosting machines, among others, are all designed to predict the expected value (mean) of a distribution when used for regression tasks. In classification problems, while logistic regression and other GLMs naturally attempt to estimate probabilities of class membership, tree-based methods like random forests and gradient boosting produce raw scores that would require additional calibration steps (like isotonic regression or Platt scaling) to be transformed into meaningful probabilities. Yet in practice, this calibration is rarely performed, and even when uncertainty information is available (i.e., the probabilities), it is typically discarded in favor of the single most likely class, i.e., the mode.
This oversimplification is sometimes not just inadequate; it can lead to fundamentally wrong conclusions, much like our lukewarm coffee predictor. A stark example is the Gaussian copula formula used to price collateralized debt obligations (CDOs) before the 2008 financial crisis. By reducing the complex relationships between mortgage defaults to a single correlation number, among other issues, this model catastrophically underestimated the possibility of simultaneous defaults (MacKenzie & Spears, 2014). This systematic underestimation of extreme risks is so pervasive that some investment funds, like Universa Investments advised by Nassim Taleb, incorporate strategies to capitalize on it. They recognize that markets consistently undervalue the probability and impact of extreme events (Patterson, 2023). When we reduce a complex distribution of possible outcomes to a single number, we lose critical information about uncertainty, risk, and potential extreme events that could drastically impact decision-making.
On the other hand, some quantitative trading firms have built their success partly by properly modeling these complex distributions. When asked about Renaissance Technologies’ approach — whose Medallion fund purportedly achieved returns of 66% annually before fees from 1988 to 2018 (Zuckerman, 2019) — founder Jim Simons emphasized that they carefully consider that market risk “is typically not a normal distribution, the tails of a distribution are heavier and the inside is not as heavy” (Simons, 2013, 47:41), highlighting the critical importance of looking beyond simple averages.
Why, then, do we persist in using point estimates despite their clear limitations? The reasons may be both practical and cultural. Predicting distributions is technically more challenging than predicting single values, requiring more sophisticated models and greater computational resources. But more fundamentally, most business processes and tools are simply not designed to handle distributional thinking. You cannot put a probability distribution in a spreadsheet cell, and many decision-making frameworks demand concrete numbers rather than ranges of possibilities. Moreover, as Kahneman (2011) notes in his analysis of human decision-making, we are naturally inclined to think in terms of specific scenarios rather than statistical distributions — our intuitive thinking prefers simple, concrete answers over probabilistic ones.
Let us examine actual housing market data to illustrate potential issues with single-point valuation and possible modeling techniques to capture the full distribution of possible values.
A Deep Dive into Property Pricing
In this section, we use the French Real Estate Transactions (DVF) dataset provided by the French government (gouv.fr, 2024), which contains comprehensive records of property transactions across France. For this analysis, we focus on sale prices, property surface areas, and the number of rooms for the years ranging from 2014 to 2024. Notably, we exclude critical information such as geolocation, as our aim is not to predict house prices but to demonstrate the benefits of predicting distributions over relying solely on single-point estimates.
First, we will go through a fictional — yet most likely à clef — case study where a common machine learning technique is put into action for planning an ambitious real estate operation. Subsequently, we will adopt a critical stance on this case and offer alternatives that many may prefer in order to be better prepared for pulling off the trade.
Case Study: The Homer & Lisa Reliance on AI for Real Estate Trading
Homer and Lisa live in Paris. They expect the family to grow and envisage to sell their two-room flat to fund the acquisition of a four-room property. Given the operational and maintenance costs, and the capacity of their newly acquired state-of-the-art Roomba with all options, they reckoned that 90m² is the perfect surface area for them. They want to estimate how much they need to save/borrow to complement the proceeds from the sale. Homer followed a MOOC on machine learning just before graduating in advanced French literature last year, and immediately found — thanks to his network — a data scientist role at a large reputable traditional firm that was heavily investing in expanding (admittedly from scratch, really) its AI capacity to avoid missing out. Now a Principal Senior Lead Data Scientist, after almost a year of experience, he knows quite a bit! (He even works for a zoo as a side hustle, where his performance has not remained unnoticed — Merckel, 2024a.)
Following some googling, he found the real estate dataset freely provided by the government. He did a bit of cleaning, filtering, and aggregating to obtain the perfect ingredients for his ordinary least squares model (OLS for those in the know). He can now confidently predict prices, in the Paris area, from both the number of rooms and the surface. Their 2-room, 40m², flat is worth 365,116€. And a 4-room, 90m², reaches 804,911€. That is a no-brainer; they must calculate the difference, i.e., 439,795€.
Homer & Lisa: The Ones Playing Darts… Unknowingly!
Do Homer and Lisa need to save/borrow 439,795€? The model certainly suggests so. But is that so?
Perhaps Homer, if only he knew, could have provided confidence intervals? Using OLS, confidence intervals can either be estimated empirically via bootstrapping or analytically using standard error-based methods.
Besides, even before that, he could have looked at the price distribution, and realized the default OLS methods may not be the best choice…
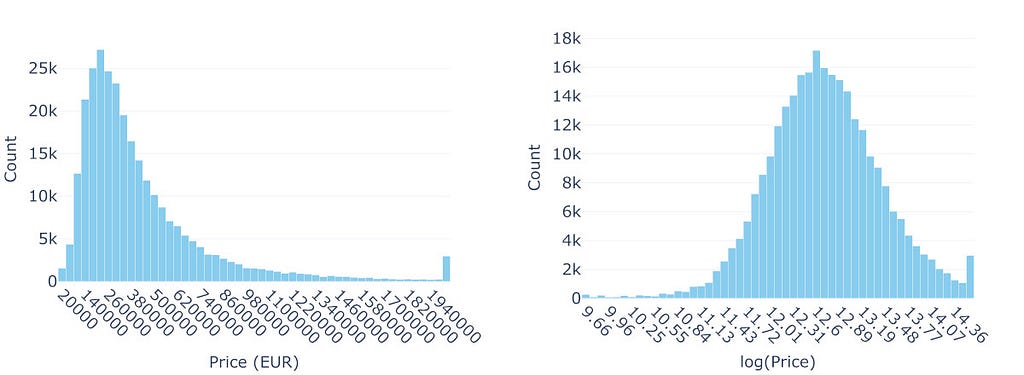
Figure 1: Real Estate Prices Near Paris (2014–2024): The left plot illustrates the distribution of real estate prices within a 7km radius of central Paris. The right plot shows the distribution of the natural logarithm of those prices. In both histograms, the final bar represents the cumulative count of properties priced above 2,000,000€ (or log(2,000,000) in the logarithmic scale). Image by the author.
The right-skewed shape with a long tail is hard to miss. For predictive modeling (as opposed to, e.g., explanatory modeling), the primary concern with OLS is not necessarily the normality (and homoscedasticity) of errors but the potential for extreme values in the long tail to disproportionately influence the model — OLS minimizes squared errors, making it sensitive to extreme observations, particularly those that deviate significantly from the Gaussian distribution assumed for the errors.
A Generalized Linear Model (GLM) extends the linear model framework by directly specifying a distribution for the response variable (from the exponential family) and using a “link function” to connect the linear predictor to the mean of that distribution. While linear models assume normally distributed errors and estimate the expected response E(Y) directly through a linear predictor, GLMs allow for different response distributions and transform the relationship between the linear predictor and E(Y) through the link function.
Let us revisit Homer and Lisa’s situation using a simpler but related approach. Rather than implementing a GLM, we can transform the data by taking the natural logarithm of prices before applying a linear model. This implies we are modeling prices as following a log-normal distribution (Figure 1 presents the distribution of prices and the log version). When transforming predictions back to the original scale, we need to account for the bias introduced by the log transformation using Duan’s smearing estimator (Duan, 1983). Using this bias-corrected log-normal model and fitting it on properties around Paris, their current 2-room, 40m² flat is estimated at 337,844€, while their target 4-room, 90m² property would cost around 751,884€, hence a need for an additional 414,040€.
The log-normal model with smearing correction is particularly suitable for this context because it not only reflects multiplicative relationships, such as price increasing proportionally (by a factor) rather than by a fixed amount when the number of rooms or surface area increases, but also properly accounts for the retransformation bias that would otherwise lead to systematic underestimation of prices.
To better understand the uncertainty in these predictions, we can examine their confidence intervals. The 95% bootstrap confidence interval [400,740€ — 418,618€] for the mean price difference means that if we were to repeat this sampling process many times, about 95% of such intervals would contain the true mean price difference. This interval is more reliable in this context than the standard error-based 95% confidence interval because it does not depend on strict parametric assumptions about the model, such as the distribution of errors or the adequacy of the model’s specification. Instead, it captures the observed data’s variability and complexity, accounting for unmodeled factors and potential deviations from idealized assumptions. For instance, our model only considers the number of rooms and surface area, while real estate prices in Paris are influenced by many other factors — proximity to metro stations, architectural style, floor level, building condition, and local neighborhood dynamics, and even broader economic conditions such as prevailing interest rates.
In light of this analysis, the log-normal model provides a new and arguably more realistic point estimate of 414,040€ for the price difference. However, the confidence interval, while statistically rigorous, might not be the most useful for Homer and Lisa’s practical planning needs. Instead, to better understand the full range of possible prices and provide more actionable insights for their planning, we might turn to Bayesian modeling. This approach would allow us to estimate the complete probability distribution of potential price differences, rather than just point estimates and confidence intervals.
The Prior, The Posterior, and The Uncertain
Bayesian modeling offers a more comprehensive approach to understanding uncertainty in predictions. Instead of calculating just a single “best guess” price difference or even a confidence interval, Bayesian methods provide the full probability distribution of possible prices.
The process begins with expressing our “prior beliefs” about property prices — what we consider reasonable based on existing knowledge. In practice, this involves defining prior distributions for the parameters of the model (e.g., the weights of the number of rooms and surface area) and specifying how we believe the data is generated through a likelihood function (which gives us the probability of observing prices given our model parameters). We then incorporate actual sales data (our “evidence”) into the model. By combining these through Bayes’ theorem, we derive the “posterior distribution,” which provides an updated view of the parameters and predictions, reflecting the uncertainty in our estimates given the data. This posterior distribution is what Homer and Lisa would truly find valuable.
Given the right-skewed nature of the price data, a log-normal distribution appears to be a reasonable assumption for the likelihood. This choice should be validated with posterior predictive checks to ensure it adequately captures the data’s characteristics. For the parameters, Half-Gaussian distributions constrained to be positive can reflect our assumption that prices increase with the number of rooms and surface area. The width of these priors reflects the range of possible effects, capturing our uncertainty in how much prices increase with additional rooms or surface area.
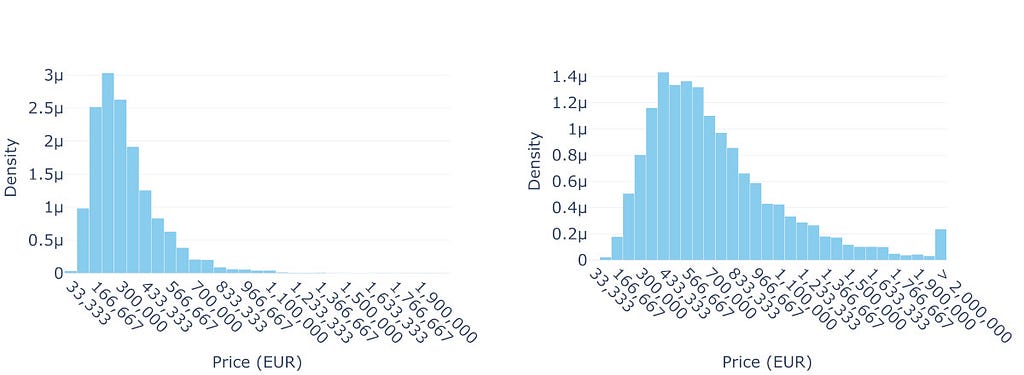
Figure 2: Predicted Price Distributions for 2-Room (40m²) and 4-Room (90m²) Properties: The left plot shows the predicted price distribution for a 2-room, 40m² property, while the right plot illustrates the predicted price distribution for a 4-room, 90m² property. Image by the author.
The Bayesian approach provides a stark contrast to our earlier methods. While the OLS and pseudo-GLM (so called because the log-normal distribution is not a member of the exponential family) gave us single predictions with some uncertainty bounds, the Bayesian model reveals complete probability distributions for both properties. Figure 2 illustrates these predicted price distributions, showing not just point estimates but the full range of likely prices for each property type. The overlapping regions between the two distributions reveal that housing prices are not strictly determined by size and room count — unmodeled factors like location quality, building condition, or market timing can sometimes make smaller properties more expensive than larger ones.
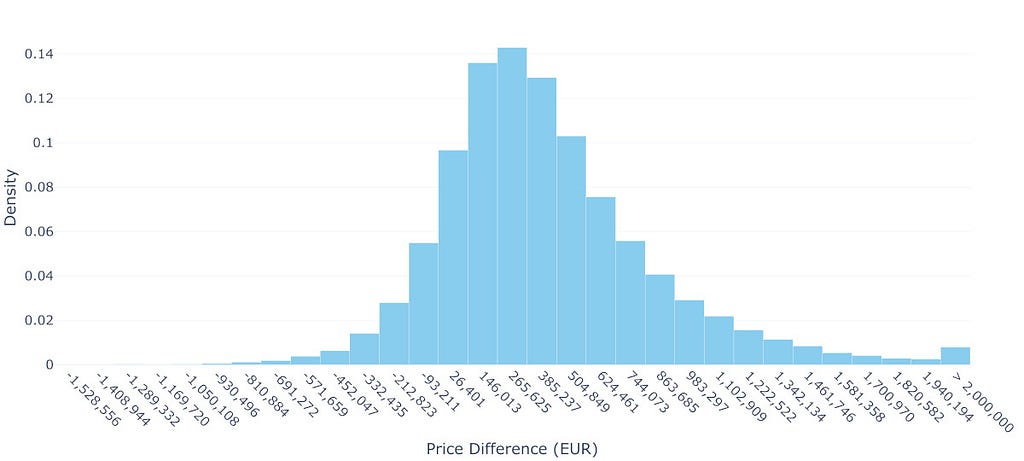
Figure 3: Distribution of Predicted Price Differences Between 2-Room (40m²) and 4-Room (90m²) Properties: This plot illustrates the distribution of predicted price differences, obtained via a Monte Carlo simulation, capturing the uncertainty in the model parameters. The mean price difference is approximately 405,697€, while the median is 337,281€, reflecting a slight right skew in the distribution. Key percentiles indicate a wide range of variability: the 10th percentile is -53,318€, the 25th percentile is 126,602€, the 75th percentile is 611,492€, and the 90th percentile is 956,934€. The standard deviation of 448,854€ highlights significant uncertainty in these predictions. Image by the author.
To understand what this means for Homer and Lisa’s situation, we need to estimate the distribution of price differences between the two properties. Using Monte Carlo simulation, we repeatedly draw samples from both predicted distributions and calculate their differences, building up the distribution shown in Figure 3. The results are sobering: while the mean difference suggests they would need to find an additional 405,697€, there is substantial uncertainty around this figure. In fact, approximately 13.4% of the simulated scenarios result in a negative price difference, meaning there is a non-negligible chance they could actually make money on the transaction. However, they should also be prepared for the possibility of needing significantly more money — there is a 25% chance they will need over 611,492€ — and 10% over 956,934€ — extra to make the upgrade.
This more complete picture of uncertainty gives Homer and Lisa a much better foundation for their decision-making than the seemingly precise single numbers provided by our earlier analyses.
Sometimes Less is More: The One With The Raw Data
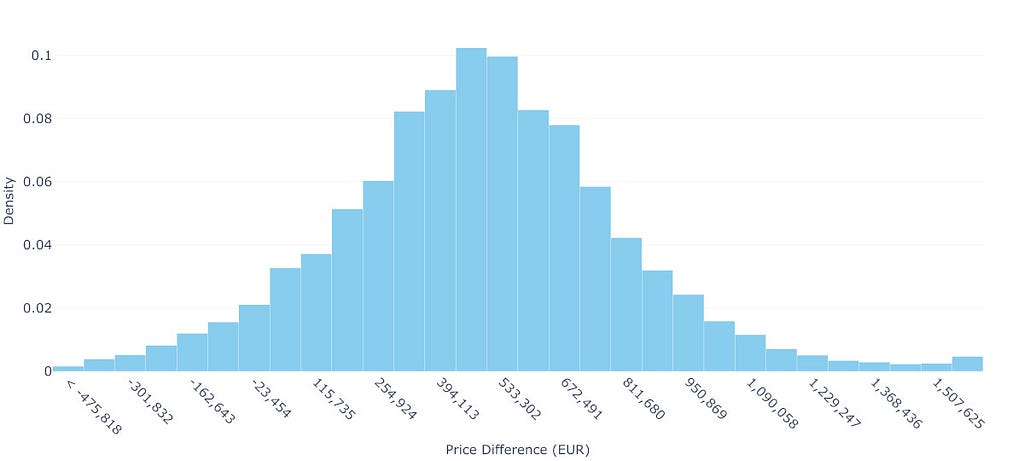
Figure 4: Distribution of Simulated Price Differences Between 2-Room (40m²) and 4-Room (90m²) Properties: This distribution is obtained through Monte Carlo simulation by randomly pairing actual transactions of 2-room (35–45m²) and 4-room (85–95m²) properties. The mean price difference is 484,672€ (median: 480,000€), with a substantial spread shown by the 90% percentile interval ranging from -52,810€ to 1,014,325€. The shaded region below zero, representing about 6.6% of scenarios, indicates cases where a 4-room property might be found at a lower price than a 2-room one. The distribution’s right skew suggests that while most price differences cluster around the median, there is a notable chance of encountering much larger differences, with 5% of cases exceeding 1,014,325€. Image by the author.
Rather than relying on sophisticated Bayesian modeling, we can gain clear insights from directly analyzing similar transactions. Looking at properties around Paris, we found 36,265 2-room flats (35–45m²) and 4,145 4-room properties (85–95m²), providing a rich dataset of actual market behavior.
The data shows substantial price variation. Two-room properties have a mean price of 329,080€ and a median price of 323,000€, with 90% of prices falling between 150,000€ and 523,650€. Four-room properties show even wider variation, with a mean price of 812,015€, a median price of 802,090€ and a 90% range from 315,200€ to 1,309,227€.
Using Monte Carlo simulation to randomly pair properties, we can estimate what Homer and Lisa might face. The mean price difference is 484,672€ and the median price difference is 480,000€, with the middle 50% of scenarios requiring between 287,488€ and 673,000€. Moreover, in 6.6% of cases, they might even find a 4-room property cheaper than their 2-room sale and make money.
This straightforward approach uses actual transactions rather than model predictions, making no assumptions about price relationships while capturing real market variability. For Homer and Lisa’s planning, the message is clear: while they should prepare for needing around 480,000€, they should be ready for scenarios requiring significantly more or less. Understanding this range of possibilities is crucial for their financial planning.
This simple technique works particularly well here because we have a dense dataset with over 40,000 relevant transactions across our target property categories. However, in many situations relying on predictive modeling, we might face sparse data. In such cases, we would need to interpolate between different data points or extrapolate beyond our available data. This is where Bayesian models are particularly powerful…
Final Remarks
The journey through these analytical approaches — OLS, log-normal modeling, Bayesian analysis, and Monte Carlo simulation — offers more than a range of price predictions. It highlights how we can handle uncertainty in predictive modeling with increasing sophistication. From the deceptively precise OLS estimate (439,795€) to the nuanced log-normal model (414,040€), and finally, to distributional insights provided by Bayesian and Monte Carlo methods (with means of 405,697€ and 484,672€, respectively), each method provides a unique perspective on the same problem.
This progression demonstrates when distributional thinking becomes beneficial. For high-stakes, one-off decisions like Homer and Lisa’s, understanding the full range of possibilities provides a clear advantage. In contrast, repetitive decisions with low individual stakes, like online ad placements, can often rely on simple point estimates. However, in domains where tail risks carry significant consequences — such as portfolio management or major financial planning — modeling the full distribution is not just beneficial but fundamentally wise.
It is important to acknowledge the real-world complexities simplified in this case study. Factors like interest rates, temporal dynamics, transaction costs, and other variables significantly influence real estate pricing. Our objective was not to develop a comprehensive housing price predictor but to illustrate, step-by-step, the progression from a naive single-point estimate to a full distribution.
It is worth noting that, given our primary aim of illustrating this progression — from point estimates to distributional thinking — we deliberately kept our models simple. The OLS and pseudo-GLM implementations were used without interaction terms — and thus without regularization or hyperparameter tuning — and minimal preprocessing was applied. While the high correlation between the number of rooms and surface area is not particularly problematic for predictive modeling in general, it can affect the sampling efficiency of the Markov chain Monte Carlo (MCMC) methods used in our Bayesian models by creating ridges in the posterior distribution that are harder to explore efficiently (indeed, we observed a strong ridge structure with correlation of -0.74 between these parameters, though effective sample sizes remained reasonable at about 50% of total samples, suggesting our inference should be sufficiently stable for our illustrative purposes). For the Bayesian approaches specifically, there is substantial room for improvement through defining more informative priors or the inclusion of additional covariates. While such optimizations might yield somewhat different numerical results, they would likely not fundamentally alter the key insights about the importance of considering full distributions rather than point estimates.
Finally, we must accept that even our understanding of uncertainty is uncertain. The confidence we place in distributional predictions depends on model assumptions and data quality. This “uncertainty about uncertainty” challenges us not only to refine our models but also to communicate their limitations transparently.
Embracing distributional thinking is not merely a technical upgrade — it is a mindset shift. Single-point predictions may feel actionable, but they often provide a false sense of precision, ignoring the inherent variability of outcomes. By considering the full spectrum of possibilities, we equip ourselves to make better-informed decisions and develop strategies that are better prepared for the randomness of the real world.
Sources
References
– Duan, N. (1983). Smearing estimate: A nonparametric retransformation method. Journal of the American Statistical Association, 78(383), 605–610. Available from https://www.jstor.org/stable/2288126. – Kahneman, D. (2011). Thinking, Fast and Slow. Kindle edition. ASIN B00555X8OA. – MacKenzie, D., & Spears, T. (2014). ‘The formula that killed Wall Street’: The Gaussian copula and modelling practices in investment banking. Social Studies of Science, 44(3), 393–417. Available from https://www.jstor.org/stable/43284238. – Patterson, S. (2023). Chaos Kings: How Wall Street Traders Make Billions in the New Age of Crisis. Kindle edition. ASIN B0BSB49L11. – Zuckerman, G. (2019). The Man Who Solved the Market: How Jim Simons Launched the Quant Revolution. Kindle edition. ASIN B07NLFC63Y.
Art and text by Loic Merckel. Licensed under CC BY 4.0. Originally published on 619.io. For discussions or engagement, feel free to refer to the LinkedIn version or Medium version. Otherwise, attribute the original source when sharing or reusing.
Maybe we’ll see more movies made for Apple Vision Pro now there’s a Blackmagic Camera, and maybe we’ll see different cameras on the iPhone 17 Slim, but we’ll never see the end of Apple nonsense on TikTok.
The new Blackmagic Camera for spatial video
There’s also the never-ending and sometimes ever-increasing set of rumors about Apple making folding devices. This time the claim is that we’ll see a foldable iPad Pro, but it’s definitely not coming soon and co-host Wesley Hilliard has reasons to lower our expectations of it happening at all.
What is definitely happening is that Apple Vision Pro is getting more entertainment in the form of short films and documentaries. It’s also definitely happening far too slowly, though, so the launch of a dedicated spatial video camera from Blackmagic is welcome — even if it’s costly enough that only studios will be able to afford it.
Spam calls are a seemingly endless nuisance with no solution, but there are several ways to get relief built into your iPhone and through services like those provided by Incogni.
It’s not just you — robo calls, spam calls, telemarketing calls, and scam calls can inundate your call logs, email inbox, voicemail, and Messages app incessantly. Though, there is no need to give up and waste countless hours sifting through the garbage left by unwanted calls.
First, you need to take a few important and necessary steps to prevent spam calls from ever making it through. Second, you need to take the fight to the problem — data brokers.
We use cookies on our website to give you the most relevant experience by remembering your preferences and repeat visits. By clicking “Accept”, you consent to the use of ALL the cookies.
This website uses cookies to improve your experience while you navigate through the website. Out of these, the cookies that are categorized as necessary are stored on your browser as they are essential for the working of basic functionalities of the website. We also use third-party cookies that help us analyze and understand how you use this website. These cookies will be stored in your browser only with your consent. You also have the option to opt-out of these cookies. But opting out of some of these cookies may affect your browsing experience.
Necessary cookies are absolutely essential for the website to function properly. These cookies ensure basic functionalities and security features of the website, anonymously.
Cookie
Duration
Description
cookielawinfo-checkbox-analytics
11 months
This cookie is set by GDPR Cookie Consent plugin. The cookie is used to store the user consent for the cookies in the category "Analytics".
cookielawinfo-checkbox-functional
11 months
The cookie is set by GDPR cookie consent to record the user consent for the cookies in the category "Functional".
cookielawinfo-checkbox-necessary
11 months
This cookie is set by GDPR Cookie Consent plugin. The cookies is used to store the user consent for the cookies in the category "Necessary".
cookielawinfo-checkbox-others
11 months
This cookie is set by GDPR Cookie Consent plugin. The cookie is used to store the user consent for the cookies in the category "Other.
cookielawinfo-checkbox-performance
11 months
This cookie is set by GDPR Cookie Consent plugin. The cookie is used to store the user consent for the cookies in the category "Performance".
viewed_cookie_policy
11 months
The cookie is set by the GDPR Cookie Consent plugin and is used to store whether or not user has consented to the use of cookies. It does not store any personal data.
Functional cookies help to perform certain functionalities like sharing the content of the website on social media platforms, collect feedbacks, and other third-party features.
Performance cookies are used to understand and analyze the key performance indexes of the website which helps in delivering a better user experience for the visitors.
Analytical cookies are used to understand how visitors interact with the website. These cookies help provide information on metrics the number of visitors, bounce rate, traffic source, etc.
Advertisement cookies are used to provide visitors with relevant ads and marketing campaigns. These cookies track visitors across websites and collect information to provide customized ads.