Category: Artificial Intelligence

  • GraphRAG in Action: From Commercial Contracts to a Dynamic Q&A Agent

    GraphRAG in Action: From Commercial Contracts to a Dynamic Q&A Agent

    Ed Sandoval

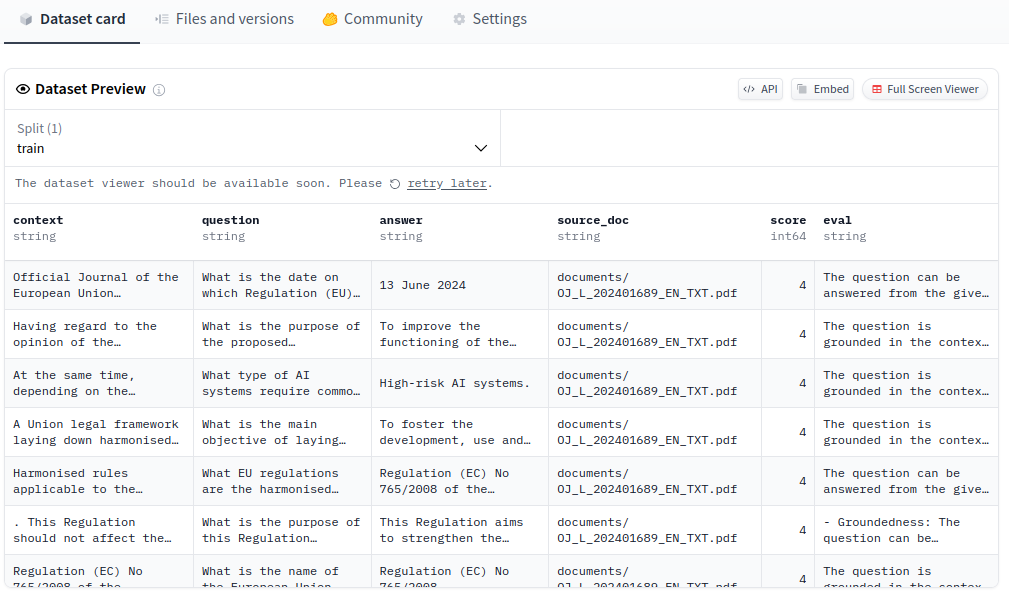
    A question-based extraction approach

    In this blog post, we introduce an approach that leverages a Graph Retrieval Augmented Generation (GraphRAG) method — to streamline the process of ingesting commercial contract data and building a Q&A Agent.

    This approach diverges from traditional RAG (Retrieval-Augmented Generation) by emphasizing efficiency in data extraction, rather than breaking down and vectorizing entire documents indiscriminately, which is the predominant RAG approach.

    In conventional RAG, every document is split into chunks and vectorized for retrieval, which can result in a large volume of unnecessary data being split, chunked and stored in vector indexes. Here, however, the focus is on extracting only the most relevant information from every contract for a specifc use case, Commercial Contract Review. The data is then structured into a knowledge graph, which organizes key entities and relationships, allowing for more precise graph data retrieval through Cypher queries and vector search.

    By minimizing the amount of vectorized content and focusing on highly relevant knowledge extracted, this method enhances the accuracy and performance of the Q&A agent, making it suitable to handle complex and domain-specific questions.

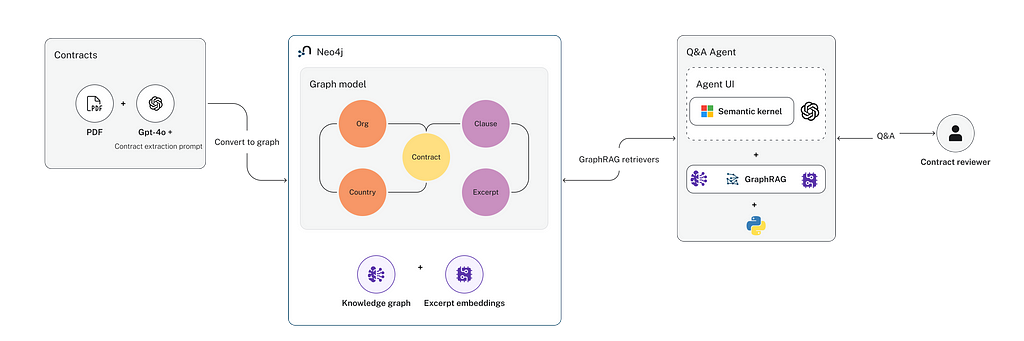
    The 4-stage approach includes: targeted information extraction (LLM + Prompt) to create a knowledge graph (LLM + Neo4J) and simple set of graph data retrieval functions (Cypher, Text to Cypher, Vector Search). Finally, a Q&A agent leveraging the data retrieval functions is built with (Microsoft Semantic Kernel)

    The diagram below illustrates the approach

    The 4-stage GraphRAG approach: From question-based extraction -> knowledge graph model-> GraphRAG retrieval -> Q&A Agent. Image by Sebastian Nilsson @ Neo4J, reproduced here with permission from its author.

    But first, for those of us not familiar with commercial law, let’s start with a brief intro to the contract review problem.

    Contract Review and Large Language Models

    Commercial contract review is a labor-intensive process involving paralegals and junior lawyers meticulously identifying critical information in a contract.

    “Contract review is the process of thoroughly reading a contract to understand the rights and obligations of an individual or company signing it and assess the associated impact”.
    Hendrycks, Burns et al, NeurIPS 2021, in CUAD an Expert-Annotated NLP Dataset for Legal Contract Review

    The first stage of contract review involves reviewing hundreds of pages of contracts to find the relevant clauses or obligations. Contract reviewers must identify whether relevant clauses exist, what they say if they do exist, and keep track of where they are described.

    For example, They must determine whether the contract is a 3-year contract or a 1-year contract. They must determine the end date of a contract. They must determine whether a clause is, say, an Anti-assignment or an Exclusivity clause…”
    Hendrycks, Burns et al, NeurIPS 2021, in CUAD an Expert-Annotated NLP Dataset for Legal Contract Review

    It’s a task that demands thoroughness but often suffers from inefficiencies but it is suitable for a Large Language Model!

    Once the first stage is completed, senior law practitioners can start to examine contracts for weaknesses and risks. This is an area where a Q&A agent powered by an LLM and grounded by information stored in Knowledge Graph is a perfect Copilot for a legal expert.

    A 4-Step Approach to Build a Commercial Contract Review Agent with LLMs, Function Calling & GraphRAG

    The remainder of this blog will describe each of the steps in this process. Along the way, I will use code snippets to illustrate the main ideas.

    The four steps are:

    1. Extracting Relevant Information from Contracts (LLM + Contract)
    2. Storing information extracted into a Knowledge Graph (Neo4j)
    3. Developing simple KG Data Retrieval Functions (Python)
    4. Building a Q&A Agent handling complex questions (Semantic Kernel, LLM, Neo4j)

    The Dataset:

    The CUAD (Contract Understanding Atticus Dataset) is a CC BY 4.0 licensed and publicly available dataset of over 13,000 expert-labeled clauses across 510 legal contracts, designed to help build AI models for contract review. It covers a wide range of important legal clauses, such as confidentiality, termination, and indemnity, which are critical for contract analysis.

    We will use three contracts from this dataset to showcase how our approach to effectively extract and analyze key legal information, building a knowledge graph and leveraging it for precise, complex question answering.

    The three contracts combined contain a total of 95 pages.

    Step 1: Extracting Relevant Information from Contracts

    It is relatively straightforward to prompt an LLM to extract precise information from contracts and generate a JSON output, representing the relevant information from the contract.

    In commercial review, a prompt can be drafted to to locate each of the critical elements mentioned above — parties, dates, clauses — and summarize them neatly in a machine-readable (JSON) file.

    Extraction Prompt (simplified)

    Answer the following questions using information exclusively on this contract
    [Contract.pdf]

    1) What type of contract is this?
    2) Who are the parties and their roles? Where are they incorporated? Name state and country (use ISO 3166 Country name)
    3) What is the Agreement Date?
    4) What is the Effective date?

    For each of the following types of contract clauses, extract two pieces of information:
    a) A Yes/No that indicates if you think the clause is found in this contract
    b) A list of excerpts that indicates this clause type exists.

    Contract Clause types: Competitive Restriction Exception, Non-Compete Clause, Exclusivity, No-Solicit Of Customers, No-Solicit Of Employees, Non-Disparagement, Termination For Convenience, Rofr/Rofo/Rofn, Change Of Control, Anti-Assignment, Uncapped Liability, Cap On Liability

    Provide your final answer in a JSON document.

    Please note that the above section shows a simplified version of the extraction prompt. A full version can be seen here. You will find that the the last part of the prompt specifies the desired format of the JSON document. This is useful in ensuring a consistent JSON schema output.

    This task is relatively simple in Python. The main()function below is designed to process a set of PDF contract files by extracting relevant legal information (extraction_prompt), using OpenAI gpt-4o and saving the results in JSON format.

    def main():
    pdf_files = [filename for filename in os.listdir('./data/input/') if filename.endswith('.pdf')]

    for pdf_filename in pdf_files:
    print('Processing ' + pdf_filename + '...')
    # Extract content from PDF using the assistant
    complete_response = process_pdf('./data/input/' + pdf_filename)
    # Log the complete response to debug
    save_json_string_to_file(complete_response, './data/debug/complete_response_' + pdf_filename + '.json')

    The “process_pdf” function uses “OpenAI gpt-4o” to perform knowledge extraction from the contract with an “extraction prompt”.

    def process_pdf(pdf_filename):
    # Create OpenAI message thread
    thread = client.beta.threads.create()
    # Upload PDF file to the thread
    file = client.files.create(file=open(pdf_filename, "rb"), purpose="assistants")
    # Create message with contract as attachment and extraction_prompt
    client.beta.threads.messages.create(thread_id=thread.id,role="user",
    attachments=[
    Attachment(
    file_id=file.id, tools=[AttachmentToolFileSearch(type="file_search")])
    ],
    content=extraction_prompt,
    )
    # Run the message thread
    run = client.beta.threads.runs.create_and_poll(
    thread_id=thread.id, assistant_id=pdf_assistant.id, timeout=1000)
    # Retrieve messages
    messages_cursor = client.beta.threads.messages.list(thread_id=thread.id)
    messages = [message for message in messages_cursor]
    # Return last message in Thread
    return messages[0].content[0].text.value

    For each contract, the message returned by “process_pdf” looks like

    {
    "agreement": {
    "agreement_name": "Marketing Affiliate Agreement",
    "agreement_type": "Marketing Affiliate Agreement",
    "effective_date": "May 8, 2014",
    "expiration_date": "December 31, 2014",
    "renewal_term": "1 year",
    "Notice_period_to_Terminate_Renewal": "30 days",
    "parties": [
    {
    "role": "Company",
    "name": "Birch First Global Investments Inc.",
    "incorporation_country": "United States Virgin Islands",
    "incorporation_state": "N/A"
    },
    {
    "role": "Marketing Affiliate",
    "name": "Mount Knowledge Holdings Inc.",
    "incorporation_country": "United States",
    "incorporation_state": "Nevada"
    }
    ],
    "governing_law": {
    "country": "United States",
    "state": "Nevada",
    "most_favored_country": "United States"
    },
    "clauses": [
    {
    "clause_type": "Competitive Restriction Exception",
    "exists": false,
    "excerpts": []
    },
    {
    "clause_type": "Exclusivity",
    "exists": true,
    "excerpts": [
    "Company hereby grants to MA the right to advertise, market and sell to corporate users, government agencies and educational facilities for their own internal purposes only, not for remarketing or redistribution."
    ]
    },
    {
    "clause_type": "Non-Disparagement",
    "exists": true,
    "excerpts": [
    "MA agrees to conduct business in a manner that reflects favorably at all times on the Technology sold and the good name, goodwill and reputation of Company."
    ]
    },
    {
    "clause_type": "Termination For Convenience",
    "exists": true,
    "excerpts": [
    "This Agreement may be terminated by either party at the expiration of its term or any renewal term upon thirty (30) days written notice to the other party."
    ]
    },
    {
    "clause_type": "Anti-Assignment",
    "exists": true,
    "excerpts": [
    "MA may not assign, sell, lease or otherwise transfer in whole or in part any of the rights granted pursuant to this Agreement without prior written approval of Company."
    ]
    },

    {
    "clause_type": "Price Restrictions",
    "exists": true,
    "excerpts": [
    "Company reserves the right to change its prices and/or fees, from time to time, in its sole and absolute discretion."
    ]
    },
    {
    "clause_type": "Minimum Commitment",
    "exists": true,
    "excerpts": [
    "MA commits to purchase a minimum of 100 Units in aggregate within the Territory within the first six months of term of this Agreement."
    ]
    },

    {
    "clause_type": "IP Ownership Assignment",
    "exists": true,
    "excerpts": [
    "Title to the Technology and all copyrights in Technology shall remain with Company and/or its Affiliates."
    ]
    },

    {
    "clause_type": "License grant",
    "exists": true,
    "excerpts": [
    "Company hereby grants to MA the right to advertise, market and sell the Technology listed in Schedule A of this Agreement."
    ]
    },
    {
    "clause_type": "Non-Transferable License",
    "exists": true,
    "excerpts": [
    "MA acknowledges that MA and its Clients receive no title to the Technology contained on the Technology."
    ]
    },
    {
    "clause_type": "Cap On Liability",
    "exists": true,
    "excerpts": [
    "In no event shall Company be liable to MA, its Clients, or any third party for any tort or contract damages or indirect, special, general, incidental or consequential damages."
    ]
    },

    {
    "clause_type": "Warranty Duration",
    "exists": true,
    "excerpts": [
    "Company's sole and exclusive liability for the warranty provided shall be to correct the Technology to operate in substantial accordance with its then current specifications."
    ]
    }


    ]
    }
    }

    Step 2: Creating a Knowledge Graph

    With each contract now as a JSON file, the next step is to create a Knowledge Graph in Neo4J.

    At this point is useful to spend some time designing the data model. You need to consider some key questions:

    • What do nodes and relationships in this graph represent?
    • What are the main properties for each node and relationship?,
    • Should there be any properties indexed?
    • Which properties need vector embeddings to enable semantic similarity search on them?

    In our case, a suitable design (schema) includes the main entities: Agreements (contracts), their clauses, the organizations who are parties to the agreement and the relationships amongst them.

    A visual representation of the schema is shown below.

    Image by the Author

    Node properties:
    Agreement {agreement_type: STRING, contract_id: INTEGER,
    effective_date: STRING, expiration_date: STRING,
    renewal_term: STRING, name: STRING}
    ContractClause {name: STRING, type: STRING}
    ClauseType {name: STRING}
    Country {name: STRING}
    Excerpt {text: STRING}
    Organization {name: STRING}

    Relationship properties:
    IS_PARTY_TO {role: STRING}
    GOVERNED_BY_LAW {state: STRING}
    HAS_CLAUSE {type: STRING}
    INCORPORATED_IN {state: STRING}

    Only the “Excerpts” — the short text pieces identified by the LLM in Step 1 — require text embeddings. This approach dramatically reduces the number of vectors and the size of the vector index needed to represent each contract, making the process more efficient and scalable.

    A simplified version of a python script loading each JSON into a Knowledge Graph with the above schema looks like

    NEO4J_URI=os.getenv('NEO4J_URI', 'bolt://localhost:7687')
    NEO4J_USER=os.getenv('NEO4J_USERNAME', 'neo4j')
    NEO4J_PASSWORD=os.getenv('NEO4J_PASSWORD')
    OPENAI_API_KEY = os.getenv('OPENAI_API_KEY')
    JSON_CONTRACT_FOLDER = './data/output/'

    driver = GraphDatabase.driver(NEO4J_URI, auth=(NEO4J_USER, NEO4J_PASSWORD))

    contract_id = 1

    json_contracts = [filename for filename in os.listdir(JSON_CONTRACT_FOLDER) if filename.endswith('.json')]
    for json_contract in json_contracts:
    with open(JSON_CONTRACT_FOLDER + json_contract,'r') as file:
    json_string = file.read()
    json_data = json.loads(json_string)
    agreement = json_data['agreement']
    agreement['contract_id'] = contract_id
    driver.execute_query(CREATE_GRAPH_STATEMENT, data=json_data)
    contract_id+=1

    create_full_text_indices(driver)
    driver.execute_query(CREATE_VECTOR_INDEX_STATEMENT)
    print ("Generating Embeddings for Contract Excerpts...")
    driver.execute_query(EMBEDDINGS_STATEMENT, token = OPENAI_API_KEY)

    Here the “CREATE_GRAPH_STATEMENT” is the only “complex” piece. It is a CYPHER statement that maps the Contract (JSON) into the nodes and relationships in the Knowledge Graph.

    The full Cypher statement is below

    CREATE_GRAPH_STATEMENT = """
    WITH $data AS data
    WITH data.agreement as a

    MERGE (agreement:Agreement {contract_id: a.contract_id})
    ON CREATE SET
    agreement.contract_id = a.contract_id,
    agreement.name = a.agreement_name,
    agreement.effective_date = a.effective_date,
    agreement.expiration_date = a.expiration_date,
    agreement.agreement_type = a.agreement_type,
    agreement.renewal_term = a.renewal_term,
    agreement.most_favored_country = a.governing_law.most_favored_country
    //agreement.Notice_period_to_Terminate_Renewal = a.Notice_period_to_Terminate_Renewal

    MERGE (gl_country:Country {name: a.governing_law.country})
    MERGE (agreement)-[gbl:GOVERNED_BY_LAW]->(gl_country)
    SET gbl.state = a.governing_law.state


    FOREACH (party IN a.parties |
    // todo proper global id for the party
    MERGE (p:Organization {name: party.name})
    MERGE (p)-[ipt:IS_PARTY_TO]->(agreement)
    SET ipt.role = party.role
    MERGE (country_of_incorporation:Country {name: party.incorporation_country})
    MERGE (p)-[incorporated:INCORPORATED_IN]->(country_of_incorporation)
    SET incorporated.state = party.incorporation_state
    )

    WITH a, agreement, [clause IN a.clauses WHERE clause.exists = true] AS valid_clauses
    FOREACH (clause IN valid_clauses |
    CREATE (cl:ContractClause {type: clause.clause_type})
    MERGE (agreement)-[clt:HAS_CLAUSE]->(cl)
    SET clt.type = clause.clause_type
    // ON CREATE SET c.excerpts = clause.excerpts
    FOREACH (excerpt IN clause.excerpts |
    MERGE (cl)-[:HAS_EXCERPT]->(e:Excerpt {text: excerpt})
    )
    //link clauses to a Clause Type label
    MERGE (clType:ClauseType{name: clause.clause_type})
    MERGE (cl)-[:HAS_TYPE]->(clType)
    )"""

    Here’s a breakdown of what the statement does:

    Data Binding

    WITH $data AS data
    WITH data.agreement as a
    • $data is the input data being passed into the query in JSON format. It contains information about an agreement (contract).
    • The second line assigns data.agreement to the alias a, so the contract details can be referenced in the subsequent query.

    Upsert the Agreement Node

    MERGE (agreement:Agreement {contract_id: a.contract_id})
    ON CREATE SET
    agreement.name = a.agreement_name,
    agreement.effective_date = a.effective_date,
    agreement.expiration_date = a.expiration_date,
    agreement.agreement_type = a.agreement_type,
    agreement.renewal_term = a.renewal_term,
    agreement.most_favored_country = a.governing_law.most_favored_country
    • MERGE attempts to find an existing Agreement node with the specified contract_id. If no such node exists, it creates one.
    • The ON CREATE SET clause sets various properties on the newly created Agreement node, such as contract_id, agreement_name, effective_date, and other agreement-related fields from the JSON input.

    Create Governing Law Relationship

    MERGE (gl_country:Country {name: a.governing_law.country})
    MERGE (agreement)-[gbl:GOVERNED_BY_LAW]->(gl_country)
    SET gbl.state = a.governing_law.state
    • This creates or merges a Country node for the governing law country associated with the agreement.
    • Then, it creates or merges a relationship GOVERNED_BY_LAW between the Agreement and Country.
    • It also sets the state property of the GOVERNED_BY_LAW relationship

    Create Party and Incorporation Relationships

    FOREACH (party IN a.parties |
    MERGE (p:Organization {name: party.name})
    MERGE (p)-[ipt:IS_PARTY_TO]->(agreement)
    SET ipt.role = party.role
    MERGE (country_of_incorporation:Country {name: party.incorporation_country})
    MERGE (p)-[incorporated:INCORPORATED_IN]->(country_of_incorporation)
    SET incorporated.state = party.incorporation_state
    )

    For each party in the contract (a.parties), it:

    • Upserts (Merge) an Organization node for the party.
    • Creates an IS_PARTY_TO relationship between the Organization and the Agreement, setting the role of the party (e.g., buyer, seller).
    • Merges a Country node for the country in which the organization is incorporated.
    • Creates an INCORPORATED_IN relationship between the organization and the incorporation country, and sets the state where the organization is incorporated

    Create Contract Clauses and Excerpts

    WITH a, agreement, [clause IN a.clauses WHERE clause.exists = true] AS valid_clauses
    FOREACH (clause IN valid_clauses |
    CREATE (cl:ContractClause {type: clause.clause_type})
    MERGE (agreement)-[clt:HAS_CLAUSE]->(cl)
    SET clt.type = clause.clause_type
    FOREACH (excerpt IN clause.excerpts |
    MERGE (cl)-[:HAS_EXCERPT]->(e:Excerpt {text: excerpt})
    )
    MERGE (clType:ClauseType{name: clause.clause_type})
    MERGE (cl)-[:HAS_TYPE]->(clType)
    )
    • This part first filters the list of clauses (a.clauses) to include only those where clause.exists = true (i.e., clauses with excerpts identified by the LLM in Step 1)
    • For each clause:
    • It creates a ContractClause node with a name and type corresponding to the clause type.
    • A HAS_CLAUSE relationship is established between the Agreement and the ContractClause.
    • For each excerpt associated with the clause, it creates an Excerpt node and links it to the ContractClause using a HAS_EXCERPT relationship.
    • Finally, a ClauseType node is created (or merged) for the type of the clause, and the ContractClause is linked to the ClauseType using a HAS_TYPE relationship.

    Once the import script runs, a single contract can be visualized in Neo4J as a Knowledge Graph

    A Knowledge Graph representation of a single Contract: Parties (organizations) in green, Contract Clauses in blue, Excerpts in light brown, Countries in orange. Image by the Author

    The three contracts in the knowledge graph required only a small graph (under 100 nodes and less than 200 relationships). Most importantly, only 40–50 vector embeddings for the Excerpts are needed. This knowledge graph with a small number of vectors can now be used to power a reasonably powerful Q&A agent.

    Step 3: Developing data retrieval functions for GraphRAG

    With the contracts now structured in a Knowledge Graph, the next step involves creating a small set of graph data retrieval functions. These functions serve as the core building blocks, allowing us to develop a Q&A agent in step 4.

    Let’s define a few basic data retrieval functions:

    1. Retrieve basic details about a contract (given a contract ID)
    2. Find contracts involving a specific organization (given a partial organization name)
    3. Find contracts that DO NOT contain a particular clause type
    4. Find contracts contain a specific type of clause
    5. Find contracts based on the semantic similarity with the text (Excerpt) in a clause (e.g., contracts mentioning the use of “prohibited items”)
    6. Run a natural language query against all contracts in the database. For example, an aggregation query that counts “how many contracts meet certain conditions”.

    In step 4, we will build a Q&A using the Microsoft Semantic Kernel library. This library simplifies the agent building process. It allows developers to define the functions and tools that an Agent will have at its disposal to answer a question.

    In order to simplify the integration between Neo4J and the Semantic Kernel library, let’s define a ContractPlugin that defines the “signature” of each our data retrieval functions. Note the @kernel_function decorator for each of the functions and also the type information and description provided for each function.

    Semantic Kernel uses the concept of a “Plugin” class to encapsulate a group of functions available to an Agent. It will use the decorated functions, type information and documentation to inform the LLM function calling capabilities about functions available.

    from typing import List, Optional, Annotated
    from AgreementSchema import Agreement, ClauseType
    from semantic_kernel.functions import kernel_function
    from ContractService import ContractSearchService

    class ContractPlugin:
    def __init__(self, contract_search_service: ContractSearchService ):
    self.contract_search_service = contract_search_service

    @kernel_function
    async def get_contract(self, contract_id: int) -> Annotated[Agreement, "A contract"]:
    """Gets details about a contract with the given id."""
    return await self.contract_search_service.get_contract(contract_id)

    @kernel_function
    async def get_contracts(self, organization_name: str) -> Annotated[List[Agreement], "A list of contracts"]:
    """Gets basic details about all contracts where one of the parties has a name similar to the given organization name."""
    return await self.contract_search_service.get_contracts(organization_name)

    @kernel_function
    async def get_contracts_without_clause(self, clause_type: ClauseType) -> Annotated[List[Agreement], "A list of contracts"]:
    """Gets basic details from contracts without a clause of the given type."""
    return await self.contract_search_service.get_contracts_without_clause(clause_type=clause_type)

    @kernel_function
    async def get_contracts_with_clause_type(self, clause_type: ClauseType) -> Annotated[List[Agreement], "A list of contracts"]:
    """Gets basic details from contracts with a clause of the given type."""
    return await self.contract_search_service.get_contracts_with_clause_type(clause_type=clause_type)

    @kernel_function
    async def get_contracts_similar_text(self, clause_text: str) -> Annotated[List[Agreement], "A list of contracts with similar text in one of their clauses"]:
    """Gets basic details from contracts having semantically similar text in one of their clauses to the to the 'clause_text' provided."""
    return await self.contract_search_service.get_contracts_similar_text(clause_text=clause_text)

    @kernel_function
    async def answer_aggregation_question(self, user_question: str) -> Annotated[str, "An answer to user_question"]:
    """Answer obtained by turning user_question into a CYPHER query"""
    return await self.contract_search_service.answer_aggregation_question(user_question=user_question)

    I would recommend exploring the “ContractService” class that contains the implementations of each of the above functions. Each function exercises a a different data retrieval technique.

    Let’s walk through the implementation of some of these functions as they showcase different GraphRAG data retrieval techniques / patterns

    Get Contract (from contract ID) — A Cypher-based retrieval function

    The get_contract(self, contract_id: int), is an asynchronous method designed to retrieve details about a specific contract (Agreement) from a Neo4J database using a Cypher query. The function returns an Agreement object populated with information about the agreement, clauses, parties, and their relationships.

    Here’s the implementation of this function

    async def get_contract(self, contract_id: int) -> Agreement:

    GET_CONTRACT_BY_ID_QUERY = """
    MATCH (a:Agreement {contract_id: $contract_id})-[:HAS_CLAUSE]->(clause:ContractClause)
    WITH a, collect(clause) as clauses
    MATCH (country:Country)-[i:INCORPORATED_IN]-(p:Organization)-[r:IS_PARTY_TO]-(a)
    WITH a, clauses, collect(p) as parties, collect(country) as countries, collect(r) as roles, collect(i) as states
    RETURN a as agreement, clauses, parties, countries, roles, states
    """

    agreement_node = {}

    records, _, _ = self._driver.execute_query(GET_CONTRACT_BY_ID_QUERY,{'contract_id':contract_id})

    if (len(records)==1):
    agreement_node = records[0].get('agreement')
    party_list = records[0].get('parties')
    role_list = records[0].get('roles')
    country_list = records[0].get('countries')
    state_list = records[0].get('states')
    clause_list = records[0].get('clauses')

    return await self._get_agreement(
    agreement_node, format="long",
    party_list=party_list, role_list=role_list,
    country_list=country_list,state_list=state_list,
    clause_list=clause_list
    )

    The most important component is the The Cypher query in GET_CONTRACT_BY_ID_QUERY This query is executed using contract_id supplied as input parameter. The output is the matching Agreement, its clauses and parties involved (each party has a role and country/state of incorporation)

    The data is then passed to an utility function _get_agreementwhich simply maps the data to an “Agreement”. The agreement is a TypedDict defined as

    class Agreement(TypedDict):  
    contract_id: int
    agreement_name: str
    agreement_type: str
    effective_date: str
    expiration_date: str
    renewal_term: str
    notice_period_to_terminate_Renewal: str
    parties: List[Party]
    clauses: List[ContractClause]

    Get Contracts WITHOUT a Clause type — Another Cypher retrieval function

    This function illustrate a powerful feature of a knowledge graph, which is to test for the absence of a relationship.

    The get_contracts_without_clause() function retrieves all contracts (Agreements) from the Neo4J database that do not contain a specific type of clause. The function takes a ClauseType as input and returns a list of Agreement objects that match the condition.

    This type of data retrieval information can’t be easily implemented with vector search. The full implementation follows

    async def get_contracts_without_clause(self, clause_type: ClauseType) -> List[Agreement]:
    GET_CONTRACT_WITHOUT_CLAUSE_TYPE_QUERY = """
    MATCH (a:Agreement)
    OPTIONAL MATCH (a)-[:HAS_CLAUSE]->(cc:ContractClause {type: $clause_type})
    WITH a,cc
    WHERE cc is NULL
    WITH a
    MATCH (country:Country)-[i:INCORPORATED_IN]-(p:Organization)-[r:IS_PARTY_TO]-(a)
    RETURN a as agreement, collect(p) as parties, collect(r) as roles, collect(country) as countries, collect(i) as states
    """

    #run the Cypher query
    records, _ , _ = self._driver.execute_query(GET_CONTRACT_WITHOUT_CLAUSE_TYPE_QUERY,{'clause_type':clause_type.value})

    all_agreements = []
    for row in records:
    agreement_node = row['agreement']
    party_list = row['parties']
    role_list = row['roles']
    country_list = row['countries']
    state_list = row['states']
    agreement : Agreement = await self._get_agreement(
    format="short",
    agreement_node=agreement_node,
    party_list=party_list,
    role_list=role_list,
    country_list=country_list,
    state_list=state_list
    )
    all_agreements.append(agreement)
    return all_agreements

    Once again, the format is similar to the previous function. A Cypher query,GET_CONTRACTS_WITHOUT_CLAUSE_TYPE_QUERY , defines the nodes and relationship patterns to be matched. It performs an optional match to filters out contracts that do contain a clause type, and collects related data about the agreement, such as the involved parties and their details.

    The function then constructs and returns a list of Agreement objects, which encapsulate all the relevant information for each matching agreement.

    Get Contract with Semantically Similar Text — A Vector-Search + Graph data retrieval function

    The get_contracts_similar_text() function is designed to find agreements (contracts) that contain clauses with text similar to a provided clause_text. It uses semantic vector search to identify related Excerpts and then traverses the graph to return information about the corresponding agreements and clauses, where those excerpts came from.

    This function leverages a vector index defined on the “text” property of each Excerpt. It uses the recently released Neo4J GraphRAG package to simplify the Cypher code needed to run semantic search + Graph traversal code.

    async def get_contracts_similar_text(self, clause_text: str) -> List[Agreement]:

    #Cypher to traverse from the semantically similar excerpts back to the agreement
    EXCERPT_TO_AGREEMENT_TRAVERSAL_QUERY="""
    MATCH (a:Agreement)-[:HAS_CLAUSE]->(cc:ContractClause)-[:HAS_EXCERPT]-(node)
    RETURN a.name as agreement_name, a.contract_id as contract_id, cc.type as clause_type, node.text as excerpt
    """

    #Set up vector Cypher retriever
    retriever = VectorCypherRetriever(
    driver= self._driver,
    index_name="excerpt_embedding",
    embedder=self._openai_embedder,
    retrieval_query=EXCERPT_TO_AGREEMENT_TRAVERSAL_QUERY,
    result_formatter=my_vector_search_excerpt_record_formatter
    )

    # run vector search query on excerpts and get results containing the relevant agreement and clause
    retriever_result = retriever.search(query_text=clause_text, top_k=3)

    #set up List of Agreements (with partial data) to be returned
    agreements = []
    for item in retriever_result.items:
    //extract information from returned items and append agreement to results
    // full code not shown here but available on the Github repo


    return agreements

    Let’s go over the main components of this data retrieval function

    • The Neo4j GraphRAG VectorCypherRetriever allows a developer to perform semantic similarity on a vector index. In our case, for each semantically similar Excerpt “node” found, an additional Cypher expression is used to fetch additional nodes in the graph related to the node.
    • The parameters of the VectorCypherRetriever are straightforward. The index_name is the vector index on which to run semantic similarity. The embedder generates a vector embedding for a piece of text. The driver is just an instance of a Neo4j Python driver. The retrieval_query specify the additional nodes and relationships connected with ever “Excerpt” node identified by semantic similarity
    • The EXCERPT_TO_AGREEMENT_TRAVERSAL_QUERY
      specifies the additional nodes to be retrieved. In this case, for every Excerpt, we are retrieving its related Contract Clause and corresponding Agreement
    EXCERPT_TO_AGREEMENT_TRAVERSAL_QUERY="""
    MATCH (a:Agreement)-[:HAS_CLAUSE]->(cc:ContractClause)-[:HAS_EXCERPT]-(node)
    RETURN a.name as agreement_name, a.contract_id as contract_id, cc.type as clause_type, node.text as excerpt
    """

    Run a Natural Language Query — A Text 2Cypher data retrieval function

    The answer_aggregation_question() function leverages Neo4j GraphRAG package “Text2CypherRetriever” to answer a question in natural language. The Text2CypherRetriever uses an LLM to turn the user question into a Cypher query and runs it against the Neo4j database.

    The function leverages OpenAI gpt-4o to generate the required Cypher query. Let’s walk through the main components of this data retrieval function.

     async def answer_aggregation_question(self, user_question) -> str:
    answer = ""


    NEO4J_SCHEMA = """
    omitted for brevity (see below for the full value)
    """

    # Initialize the retriever
    retriever = Text2CypherRetriever(
    driver=self._driver,
    llm=self._llm,
    neo4j_schema=NEO4J_SCHEMA
    )

    # Generate a Cypher query using the LLM, send it to the Neo4j database, and return the results
    retriever_result = retriever.search(query_text=user_question)

    for item in retriever_result.items:
    content = str(item.content)
    if content:
    answer += content + 'nn'

    return answer

    This function leverages Neo4j GraphRAG package “Text2CypherRetriever”. It uses an LLM, in this case OpenAI LLM is used to turn a user question (natural language) into a Cypher query that is executed against the database. The result of this query is returned.

    A key element to ensure that the LLM generates a query that uses the nodes, relationships and properties defined in the database is to provide the LLM with a text description of the schema.

    In our case, we used the following representation of the data model is sufficient.

    NEO4J_SCHEMA = """
    Node properties:
    Agreement {agreement_type: STRING, contract_id: INTEGER,effective_date: STRING,renewal_term: STRING, name: STRING}
    ContractClause {name: STRING, type: STRING}
    ClauseType {name: STRING}
    Country {name: STRING}
    Excerpt {text: STRING}
    Organization {name: STRING}

    Relationship properties:
    IS_PARTY_TO {role: STRING}
    GOVERNED_BY_LAW {state: STRING}
    HAS_CLAUSE {type: STRING}
    INCORPORATED_IN {state: STRING}

    The relationships:
    (:Agreement)-[:HAS_CLAUSE]->(:ContractClause)
    (:ContractClause)-[:HAS_EXCERPT]->(:Excerpt)
    (:ContractClause)-[:HAS_TYPE]->(:ClauseType)
    (:Agreement)-[:GOVERNED_BY_LAW]->(:Country)
    (:Organization)-[:IS_PARTY_TO]->(:Agreement)
    (:Organization)-[:INCORPORATED_IN]->(:Country)
    """

    Step 4: Building a Q&A Agent

    Armed with our Knowledge Graph data retrieval functions, we are ready to build an agent grounded by GraphRAG 🙂

    Let’s sets up a chatbot agent capable of answering user queries about contracts using a combination of OpenAI’s gpt-4o model, our data retrieval functions and a Neo4j-powered knowledge graph.

    We will use Microsoft Semantic Kernel, a framework that allows developers to integrate LLM function calling with existing APIs and data retrieval functions

    The framework uses a concept called Plugins to represent specific functionality that the kernel can perform. In our case, all of our data retrieval functions defined in the “ContractPlugin” can be used by the LLM to answer the question.

    The framework uses the concept of Memory to keep all interactions between user and agent, as well as functions executed and data retrieved.

    A extremely simple Terminal-based agent can be implemented with a few lines of code. The snippet below shows the main parts of the agent (imports and environment vars removed).

    logging.basicConfig(level=logging.INFO)

    # Initialize the kernel
    kernel = Kernel()

    # Add the Contract Search plugin to the kernel
    contract_search_neo4j = ContractSearchService(NEO4J_URI,NEO4J_USER,NEO4J_PASSWORD)
    kernel.add_plugin(ContractPlugin(contract_search_service=contract_search_neo4j),plugin_name="contract_search")

    # Add the OpenAI chat completion service to the Kernel
    kernel.add_service(OpenAIChatCompletion(ai_model_id="gpt-4o",api_key=OPENAI_KEY, service_id=service_id))

    # Enable automatic function calling
    settings: OpenAIChatPromptExecutionSettings = kernel.get_prompt_execution_settings_from_service_id(service_id=service_id)
    settings.function_choice_behavior = FunctionChoiceBehavior.Auto(filters={"included_plugins": ["contract_search"]})

    # Create a history of the conversation
    history = ChatHistory()

    async def basic_agent() :
    userInput = None
    while True:
    # Collect user input
    userInput = input("User > ")

    # Terminate the loop if the user says "exit"
    if userInput == "exit":
    break

    # Add user input to the history
    history.add_user_message(userInput)

    # 3. Get the response from the AI with automatic function calling
    chat_completion : OpenAIChatCompletion = kernel.get_service(type=ChatCompletionClientBase)
    result = (await chat_completion.get_chat_message_contents(
    chat_history=history,
    settings=settings,
    kernel=kernel,
    arguments=KernelArguments(),
    ))[0]

    # Print the results
    print("Assistant > " + str(result))

    # Add the message from the agent to the chat history
    history.add_message(result)

    if __name__ == "__main__":
    asyncio.run(basic_agent())

    Let ask our agent some non-trivial questions

    1. Find me contracts with Price Restrictions but no insurance clauses

    Assistant > I found the following contract that contains a Price Restrictions clause but does not contain an Insurance clause:

    - **Name:** Birch First Global Investments Inc. and Mount Knowledge Holdings Inc. MARKETING AFFILIATE AGREEMENT
    - **Agreement Type:** MARKETING AFFILIATE AGREEMENT
    - **Parties:**
    - **MOUNT KNOWLEDGE HOLDINGS INC.** (Marketing Affiliate), incorporated in Nevada, USA
    - **BIRCH FIRST GLOBAL INVESTMENTS INC.** (Company), incorporated in the Virgin Islands (VIR)

    Would you like to know more details about this contract?

    Here, The Semantic Agent planner has reviewed the available functions in the Kernel and determined that answering this question requires invoking two functions that, on their own, won’t provide the complete answer.

    First, it executes the “Get Contracts with [Price Restriction] Clauses” function, followed by the “Get Contracts WITHOUT [Insurance] Clauses” function. The planner then combines the results from both functions to identify the intersection, ultimately arriving at the correct answer.

    If you look at the debugging information, you can confirm the sequence of calls performed by the LLM, along with information on the number of tokens consumed by the call. Notice the calls with the 2 data retrieval functions.

    2. Yes, please. Provide more details

    Assistant > Here are the detailed information about the contract:

    ### Contract Details:
    - **Name:** Birch First Global Investments Inc. and Mount Knowledge Holdings Inc. MARKETING AFFILIATE AGREEMENT
    - **Agreement Type:** MARKETING AFFILIATE AGREEMENT
    - **Expiration Date:** December 31, 2014
    - **Renewal Term:** One (1) year

    ### Parties Involved:
    1. **MOUNT KNOWLEDGE HOLDINGS INC.**
    - **Role:** Marketing Affiliate
    - **Incorporation Country:** USA
    - **Incorporation State:** Nevada
    2. **BIRCH FIRST GLOBAL INVESTMENTS INC.**
    - **Role:** Company
    - **Incorporation Country:** Virgin Islands (VIR)

    ### Clauses Included:
    - No-Solicit Of Employees
    - Third Party Beneficiary
    - Price Restrictions
    - Affiliate License-Licensee
    - Affiliate License-Licensor
    - Cap On Liability
    - Audit Rights
    - Warranty Duration
    - Post-Termination Services
    - Non-Transferable License
    - License grant
    - IP Ownership Assignment
    - Minimum Commitment
    - Anti-Assignment
    - Non-Disparagement

    ### Clauses Not Included:
    - Insurance

    Is there anything specific you would like to know or any particular clause details you are interested in?

    In this case, behind the scenes, the LLM used the “Find Contract by ID”. You may have noticed that the output shown to the user did not include the id of the contract. However, the Semantic Kernel stored all information returned from the functions from previous calls in the conversation memory!

    This powerful combination of having the agent decide which function(s) to call, the use of memory and the automatic marshalling of the user queries into function calls with the right parameters explain the “Magic” behind an agent built with Semantic Kernel!

    3. Does any contract mention the ability to make price changes from time to time

    Assistant > Yes, there is a contract that mentions 
    the ability to make price changes from time to time.
    Here is the relevant excerpt:

    1. **Birch First Global Investments Inc. and Mount Knowledge Holdings Inc. MARKETING AFFILIATE AGREEMENT**
    - **Contract ID:** 1
    - **Clause Type:** Price Restrictions
    - **Excerpt:**
    ```
    Company reserves the right to change its process and/or fees, from time to time, in its sole and absolute discretion. In the event of a price and/or fee change for Technology, Company shall notify MA in writing ninety (90) days prior to the effective date of any such change. All other prices and/or fees may be adjusted without prior notice to MA.
    ```

    Would you like more information about this contract or any other details?

    In order to answer this question, Semantic Kernel is executing the get_contract_similar_text data retrieval function.

    User > any contract mentions the ability to make price changes from time to time
    INFO:semantic_kernel.connectors.ai.open_ai.services.open_ai_chat_completion_base:processing 1 tool calls in parallel.

    INFO:semantic_kernel.kernel:Calling contract_search-get_contracts_similar_text
    function with args: {"clause_text":"price changes from time to time"}


    Assistant > Yes, there is a contract that mentions the ability to make price changes from time to time. Here is the relevant excerpt:

    1. **Birch First Global Investments Inc. and Mount Knowledge Holdings Inc. MARKETING AFFILIATE AGREEMENT**
    - **Contract ID:** 1
    - **Clause Type:** Price Restrictions
    - **Excerpt:**
    ```
    Company reserves the right to change its process and/or fees, from time to time, in its sole and absolute discretion. In the event of a price and/or fee change for Technology, Company shall notify MA in writing ninety (90) days prior to the effective date of any such change. All other prices and/or fees may be adjusted without prior notice to MA.
    ```

    As explained earlier, this function uses vector search and a Cypher query to retrieve not just semantically similar excerpts but also the related contract and clauses that includes them.

    Finally, let’s ask how many contracts are there on the database

    4. How many contracts are there in the database?

    This questions requires the LLM to use the Text2Cypher data retriever

    Assistant > There are a total of 3 contracts in the database.

    The debug information confirms that Semantic Kernel ran the Text2Cypher data retrieval function with “user_question” = “How many contracts are there in the database’?

    User >  how many contracts are there on the database?
    INFO:httpx:HTTP Request: POST https://api.openai.com/v1/chat/completions "HTTP/1.1 200 OK"
    INFO:semantic_kernel.connectors.ai.open_ai.services.open_ai_chat_completion_base:processing 1 tool calls in parallel.

    INFO:semantic_kernel.kernel:Calling contract_search-answer_aggregation_question function
    with args: {"user_question":"How many contracts are there in the database?"}


    INFO:semantic_kernel.functions.kernel_function:Function completed. Duration: 0.588805s

    INFO:semantic_kernel.connectors.ai.open_ai.services.open_ai_handler:OpenAI usage: CompletionUsage(completion_tokens=13, prompt_tokens=3328, total_tokens=3341, completion_tokens_details={'reasoning_tokens': 0})

    Assistant > There are a total of 3 contracts in the database.

    Try it Yourself

    The github repo contains a Streamlit app that provides a more elegant Agent UI. You are encouraged to interact with the agent and make changes to the ContractPlugin so your agent’s ability to handle more questions!

    Conclusion

    In this blog, we explored a Graph Retrieval Augmented Generation (GraphRAG) approach to transform labor-intensive tasks of commercial contract review into a more efficient, AI-driven process.

    By focusing on targeted information extraction using LLMs and prompts, building a structured knowledge graph with Neo4j, implementing simple data retrieval functions, and ultimately developing a Q&A agent, we created an intelligent solution that handles complex questions effectively.

    This approach minimizes inefficiencies found in traditional vector search based RAG, focusing instead on extracting only relevant information, reducing the need for unnecessary vector embeddings, and simplifying the overall process. We hope this journey from contract ingestion to an interactive Q&A agent inspires you to leverage GraphRAG in your own projects for improved efficiency and smarter AI-driven decision-making.

    Start building your own commercial contract review agent today and experience the power of GraphRAG firsthand!

    Resources

    For those eager to take a deeper dive, please check out the resources linked below:

    Unless otherwise noted, all images are by the author


    GraphRAG in Action: From Commercial Contracts to a Dynamic Q&A Agent was originally published in Towards Data Science on Medium, where people are continuing the conversation by highlighting and responding to this story.

    Originally appeared here:

    GraphRAG in Action: From Commercial Contracts to a Dynamic Q&A Agent

    Go Here to Read this Fast!

    GraphRAG in Action: From Commercial Contracts to a Dynamic Q&A Agent

  • Beyond Skills: Unlocking the Full Potential of Data Scientists

    Eric Colson

    Image created through DALL-E / OpenAI by author.

    Beyond Skills: Unlocking the Full Potential of Data Scientists.

    Unlock the hidden value of data scientists by empowering them beyond technical tasks to drive innovation and strategic insights.

    [This piece is cross-posted from O’Reilly Radar here]

    Introduction

    Modern organizations regard data as a strategic asset that drives efficiency, enhances decision making, and creates new value for customers. Across the organization — product management, marketing, operations, finance, and more — teams are overflowing with ideas on how data can elevate the business. To bring these ideas to life, companies are eagerly hiring data scientists for their technical skills (Python, statistics, machine learning, SQL, etc.).

    Despite this enthusiasm, many companies are significantly underutilizing their data scientists. Organizations remain narrowly focused on employing data scientists to execute preexisting ideas, overlooking the broader value they bring. Beyond their skills, data scientists possess a unique perspective that allows them to come up with innovative business ideas of their own — ideas that are novel, strategic, or differentiating and are unlikely to come from anyone but a data scientist.

    Misplaced Focus on Skills and Execution

    Sadly, many companies behave in ways that suggest they are uninterested in the ideas of data scientists. Instead, they treat data scientists as a resource to be used for their skills alone. Functional teams provide requirements documents with fully specified plans: “Here’s how you are to build this new system for us. Thank you for your partnership.” No context is provided, and no input is sought — other than an estimate for delivery. Data scientists are further inundated with ad hoc requests for tactical analyses or operational dashboards¹. The backlog of requests grows so large that the work queue is managed through Jira-style ticketing systems, which strip the requests of any business context (e.g., “get me the top products purchased by VIP customers”). One request begets another², creating a Sisyphean endeavor that leaves no time for data scientists to think for themselves. And then there’s the myriad of opaque requests for data pulls: “Please get me this data so I can analyze it.” This is marginalizing — like asking Steph Curry to pass the ball so you can take the shot. It’s not a partnership; it’s a subordination that reduces data science to a mere support function, executing ideas from other teams. While executing tasks may produce some value, it won’t tap into the full potential of what data scientists truly have to offer.

    It’s the Ideas

    The untapped potential of data scientists lies not in their ability to execute requirements or requests but in their ideas for transforming a business. By “ideas” I mean new capabilities or strategies that can move the business in better or new directions — leading to increased³ revenue, profit, or customer retention while simultaneously providing a sustainable competitive advantage (i.e., capabilities or strategies that are difficult for competitors to replicate). These ideas often take the form of machine learning algorithms that can automate decisions within a production system⁴. For example, a data scientist might develop an algorithm to better manage inventory by optimally balancing overage and underage costs. Or they might create a model that detects hidden customer preferences, enabling more effective personalization. If these sound like business ideas, that’s because they are — but they’re not likely to come from business teams. Ideas like these typically emerge from data scientists, whose unique cognitive repertoires and observations in the data make them well-suited to uncovering such opportunities.

    Ideas That Leverage Unique Cognitive Repertoires

    A cognitive repertoire is the range of tools, strategies, and approaches an individual can draw upon for thinking, problem-solving, or processing information (Page 2017). These repertoires are shaped by our backgrounds — education, experience, training, and so on. Members of a given functional team often have similar repertoires due to their shared backgrounds. For example, marketers are taught frameworks like SWOT analysis and ROAS, while finance professionals learn models such as ROIC and Black-Scholes.

    Data scientists have a distinctive cognitive repertoire. While their academic backgrounds may vary — ranging from statistics to computer science to computational neuroscience — they typically share a quantitative tool kit. This includes frameworks for widely applicable problems, often with accessible names like the “newsvendor model,” the “traveling salesman problem,” the “birthday problem,” and many others. Their tool kit also includes knowledge of machine learning algorithms⁵ like neural networks, clustering, and principal components, which are used to find empirical solutions to complex problems. Additionally, they include heuristics such as big O notation, the central limit theorem, and significance thresholds. All of these constructs can be expressed in a common mathematical language, making them easily transferable across different domains, including business — perhaps especially business.

    The repertoires of data scientists are particularly relevant to business innovation since, in many industries⁶, the conditions for learning from data are nearly ideal in that they have high-frequency events, a clear objective function⁷, and timely and unambiguous feedback. Retailers have millions of transactions that produce revenue. A streaming service sees millions of viewing events that signal customer interest. And so on — millions or billions of events with clear signals that are revealed quickly. These are the units of induction that form the basis for learning, especially when aided by machines. The data science repertoire, with its unique frameworks, machine learning algorithms, and heuristics, is remarkably geared for extracting knowledge from large volumes of event data.

    Ideas are born when cognitive repertoires connect with business context. A data scientist, while attending a business meeting, will regularly experience pangs of inspiration. Her eyebrows raise from behind her laptop as an operations manager describes an inventory perishability problem, lobbing the phrase “We need to buy enough, but not too much.” “Newsvendor model,” the data scientist whispers to herself. A product manager asks, “How is this process going to scale as the number of products increases?” The data scientist involuntarily scribbles “O(N²)” on her notepad, which is big O notation to indicate that the process will scale superlinearly. And when a marketer brings up the topic of customer segmentation, bemoaning, “There are so many customer attributes. How do we know which ones are most important?,” the data scientist sends a text to cancel her evening plans. Instead, tonight she will eagerly try running principal components analysis on the customer data⁸.

    No one was asking for ideas. This was merely a tactical meeting with the goal of reviewing the state of the business. Yet the data scientist is practically goaded into ideating. “Oh, oh. I got this one,” she says to herself. Ideation can even be hard to suppress. Yet many companies unintentionally seem to suppress that creativity. In reality our data scientist probably wouldn’t have been invited to that meeting. Data scientists are not typically invited to operating meetings. Nor are they typically invited to ideation meetings, which are often limited to the business teams. Instead, the meeting group will assign the data scientist Jira tickets of tasks to execute. Without the context, the tasks will fail to inspire ideas. The cognitive repertoire of the data scientist goes unleveraged — a missed opportunity to be sure.

    Ideas Born from Observation in the Data

    Beyond their cognitive repertoires, data scientists bring another key advantage that makes their ideas uniquely valuable. Because they are so deeply immersed in the data, data scientists discover unforeseen patterns and insights that inspire novel business ideas. They are novel in the sense that no one would have thought of them — not product managers, executives, marketers — not even a data scientist for that matter. There are many ideas that cannot be conceived of but rather are revealed by observation in the data.

    Company data repositories (data warehouses, data lakes, and the like) contain a primordial soup of insights lying fallow in the information. As they do their work, data scientists often stumble upon intriguing patterns — an odd-shaped distribution, an unintuitive relationship, and so forth. The surprise finding piques their curiosity, and they explore further.

    Imagine a data scientist doing her work, executing on an ad hoc request. She is asked to compile a list of the top products purchased by a particular customer segment. To her surprise, the products bought by the various segments are hardly different at all. Most products are bought at about the same rate by all segments. Weird. The segments are based on profile descriptions that customers opted into, and for years the company had assumed them to be meaningful groupings useful for managing products. “There must be a better way to segment customers,” she thinks. She explores further, launching an informal, impromptu analysis. No one is asking her to do this, but she can’t help herself. Rather than relying on the labels customers use to describe themselves, she focuses on their actual behavior: what products they click on, view, like, or dislike. Through a combination of quantitative techniques — matrix factorization and principal component analysis — she comes up with a way to place customers into a multidimensional space. Clusters of customers adjacent to one another in this space form meaningful groupings that better reflect customer preferences. The approach also provides a way to place products into the same space, allowing for distance calculations between products and customers. This can be used to recommend products, plan inventory, target marketing campaigns, and many other business applications. All of this is inspired from the surprising observation that the tried-and-true customer segments did little to explain customer behavior. Solutions like this have to be driven by observation since, absent the data saying otherwise, no one would have thought to inquire about a better way to group customers.

    As a side note, the principal component algorithm that the data scientists used belongs to a class of algorithms called “unsupervised learning,” which further exemplifies the concept of observation-driven insights. Unlike “supervised learning,” in which the user instructs the algorithm what to look for, an unsupervised learning algorithm lets the data describe how it is structured. It is evidence based; it quantifies and ranks each dimension, providing an objective measure of relative importance. The data does the talking. Too often we try to direct the data to yield to our human-conceived categorization schemes, which are familiar and convenient to us, evoking visceral and stereotypical archetypes. It’s satisfying and intuitive but often flimsy and fails to hold up in practice.

    Examples like this are not rare. When immersed in the data, it’s hard for the data scientists not to come upon unexpected findings. And when they do, it’s even harder for them to resist further exploration — curiosity is a powerful motivator. Of course, she exercised her cognitive repertoire to do the work, but the entire analysis was inspired by observation of the data. For the company, such distractions are a blessing, not a curse. I’ve seen this sort of undirected research lead to better inventory management practices, better pricing structures, new merchandising strategies, improved user experience designs, and many other capabilities — none of which were asked for but instead were discovered by observation in the data.

    Isn’t discovering new insights the data scientist’s job? Yes — that’s exactly the point of this article. The problem arises when data scientists are valued only for their technical skills. Viewing them solely as a support team limits them to answering specific questions, preventing deeper exploration of insights in the data. The pressure to respond to immediate requests often causes them to overlook anomalies, unintuitive results, and other potential discoveries. If a data scientist were to suggest some exploratory research based on observations, the response is almost always, “No, just focus on the Jira queue.” Even if they spend their own time — nights and weekends — researching a data pattern that leads to a promising business idea, it may still face resistance simply because it wasn’t planned or on the roadmap. Roadmaps tend to be rigid, dismissing new opportunities, even valuable ones. In some organizations, data scientists may pay a price for exploring new ideas. Data scientists are often judged by how well they serve functional teams, responding to their requests and fulfilling short-term needs. There is little incentive to explore new ideas when doing so detracts from a performance review. In reality, data scientists frequently find new insights in spite of their jobs, not because of them.

    Ideas That Are Different

    These two things — their cognitive repertoires and observations from the data — make the ideas that come from data scientists uniquely valuable. This is not to suggest that their ideas are necessarily better than those from the business teams. Rather, their ideas are different from those of the business teams. And being different has its own set of benefits.

    Having a seemingly good business idea doesn’t guarantee that the idea will have a positive impact. Evidence suggests that most ideas will fail. When properly measured for causality⁹, the vast majority of business ideas either fail to show any impact at all or actually hurt metrics. (See some statistics here.) Given the poor success rates, innovative companies construct portfolios of ideas in the hopes that at least a few successes will allow them to reach their goals. Still savvier companies use experimentation¹⁰ (A/B testing) to try their ideas on small samples of customers, allowing them to assess the impact before deciding to roll them out more broadly.

    This portfolio approach, combined with experimentation, benefits from both the quantity and diversity of ideas¹¹. It’s similar to diversifying a portfolio of stocks. Increasing the number of ideas in the portfolio increases exposure to a positive outcome — an idea that makes a material positive impact on the company. Of course, as you add ideas, you also increase the risk of bad outcomes — ideas that do nothing or even have a negative impact. However, many ideas are reversible — the “two-way door” that Amazon’s Jeff Bezos speaks of (Haden 2018). Ideas that don’t produce the expected results can be pruned after being tested on a small sample of customers, greatly mitigating the impact, while successful ideas can be rolled out to all relevant customers, greatly amplifying the impact.

    So, adding ideas to the portfolio increases exposure to upside without a lot of downside — the more, the better¹². However, there is an assumption that the ideas are independent (uncorrelated). If all the ideas are similar, then they may all succeed or fail together. This is where diversity comes in. Ideas from different groups will leverage divergent cognitive repertoires and different sets of information. This makes them different and less likely to be correlated with each other, producing more varied outcomes. For stocks, the return on a diverse portfolio will be the average of the returns for the individual stocks. However, for ideas, since experimentation lets you mitigate the bad ones and amplify the good ones, the return of the portfolio can be closer to the return of the best idea (Page 2017).

    In addition to building a portfolio of diverse ideas, a single idea can be significantly strengthened through collaboration between data scientists and business teams¹³. When they work together, their combined repertoires fill in each other’s blind spots (Page 2017)¹⁴. By merging the unique expertise and insights from multiple teams, ideas become more robust, much like how diverse groups tend to excel in trivia competitions. However, organizations must ensure that true collaboration happens at the ideation stage rather than dividing responsibilities such that business teams focus solely on generating ideas and data scientists are relegated to execution.

    Cultivating Ideas

    Data scientists are much more than a skilled resource for executing existing ideas; they are a wellspring of novel, innovative thinking. Their ideas are uniquely valuable because (1) their cognitive repertoires are highly relevant to businesses with the right conditions for learning, (2) their observations in the data can lead to novel insights, and (3) their ideas differ from those of business teams, adding diversity to the company’s portfolio of ideas.

    However, organizational pressures often prevent data scientists from fully contributing their ideas. Overwhelmed with skill-based tasks and deprived of business context, they are incentivized to merely fulfill the requests of their partners. This pattern exhausts the team’s capacity for execution while leaving their cognitive repertoires and insights largely untapped.

    Here are some suggestions that organizations can follow to better leverage data scientists and shift their roles from mere executors to active contributors of ideas:

    • Give them context, not tasks. Providing data scientists with tasks or fully specified requirements documents will get them to do work, but it won’t elicit their ideas. Instead, give them context. If an opportunity is already identified, describe it broadly through open dialogue, allowing them to frame the problem and propose solutions. Invite data scientists to operational meetings where they can absorb context, which may inspire new ideas for opportunities that haven’t yet been considered.
    • Create slack for exploration. Companies often completely overwhelm data scientists with tasks. It may seem paradoxical, but keeping resources 100% utilized is very inefficient¹⁵. Without time for exploration and unexpected learning, data science teams can’t reach their full potential. Protect some of their time for independent research and exploration, using tactics like Google’s 20% time or similar approaches.
    • Eliminate the task management queue. Task queues create a transactional, execution-focused relationship with the data science team. Priorities, if assigned top-down, should be given in the form of general, unframed opportunities that need real conversations to provide context, goals, scope, and organizational implications. Priorities might also emerge from within the data science team, requiring support from functional partners, with the data science team providing the necessary context. We don’t assign Jira tickets to product or marketing teams, and data science should be no different.
    • Hold data scientists accountable for real business impact. Measure data scientists by their impact on business outcomes, not just by how well they support other teams. This gives them the agency to prioritize high-impact ideas, regardless of the source. Additionally, tying performance to measurable business impact¹⁶ clarifies the opportunity cost of low-value ad hoc requests¹⁷.
    • Hire for adaptability and broad skill sets. Look for data scientists who thrive in ambiguous, evolving environments where clear roles and responsibilities may not always be defined. Prioritize candidates with a strong desire for business impact¹⁸, who see their skills as tools to drive outcomes, and who excel at identifying new opportunities aligned with broad company goals. Hiring for diverse skill sets enables data scientists to build end-to-end systems, minimizing the need for handoffs and reducing coordination costs — especially critical during the early stages of innovation when iteration and learning are most important¹⁹.
    • Hire functional leaders with growth mindsets. In new environments, avoid leaders who rely too heavily on what worked in more mature settings. Instead, seek leaders who are passionate about learning and who value collaboration, leveraging diverse perspectives and information sources to fuel innovation.

    These suggestions require an organization with the right culture and values. The culture needs to embrace experimentation to measure the impact of ideas and to recognize that many will fail. It needs to value learning as an explicit goal and understand that, for some industries, the vast majority of knowledge has yet to be discovered. It must be comfortable relinquishing the clarity of command-and-control in exchange for innovation. While this is easier to achieve in a startup, these suggestions can guide mature organizations toward evolving with experience and confidence. Shifting an organization’s focus from execution to learning is a challenging task, but the rewards can be immense or even crucial for survival. For most modern firms, success will depend on their ability to harness human potential for learning and ideation — not just execution (Edmondson 2012). The untapped potential of data scientists lies not in their ability to execute existing ideas but in the new and innovative ideas no one has yet imagined.

    Footnotes

    1. To be sure, dashboards have value in providing visibility into business operations. However, dashboards are limited in their ability to provide actionable insights. Aggregated data is typically so full of confounders and systemic bias that it is rarely appropriate for decision making. The resources required to build and maintain dashboards need to be balanced against other initiatives the data science team could be doing that might produce more impact.
    2. It’s a well-known phenomenon that data-related inquiries tend to evoke more questions than they answer.
    3. I used “increased” in place of “incremental” since the latter is associated with “small” or “marginal.” The impact from data science initiatives can be substantial. I use the term here to indicate the impact as an improvement — though without a fundamental change to the existing business model.
    4. As opposed to data used for human consumption, such as short summaries or dashboards, which do have value in that they inform our human workers but are typically limited in direct actionability.
    5. I resist referring to knowledge of the various algorithms as skills since I feel it’s more important to emphasize their conceptual appropriateness for a given situation versus the pragmatics of training or implementing any particular approach.
    6. Industries such as ecommerce, social networks, and streaming content have favorable conditions for learning in comparison to fields like medicine, where the frequency of events is much lower and the time to feedback is much longer. Additionally, in many aspects of medicine, the feedback can be very ambiguous.
    7. Typically revenue, profit, or user retention. However, it can be challenging for a company to identify a single objective function.
    8. Voluntary tinkering is common among data scientists and is driven by curiosity, the desire for impact, the desire for experience, etc.
    9. Admittedly, the data available on the success rates of business ideas is likely biased in that most of it comes from tech companies experimenting with online services. However, at least anecdotally, the low success rates seem to be consistent across other types of business functions, industries, and domains.
    10. Not all ideas are conducive to experimentation due to unattainable sample size, inability to isolate experimentation arms, ethical concerns, or other factors.
    11. I purposely exclude the notion of “quality of idea” since, in my experience, I’ve seen little evidence that an organization can discern the “better” ideas within the pool of candidates.
    12. Often, the real cost of developing and trying an idea is the human resources — engineers, data scientists, PMs, designers, etc. These resources are fixed in the short term and act as a constraint to the number of ideas that can be tried in a given time period.
    13. See Duke University professor Martin Ruef, who studied the coffee house model of innovation (coffee house is analogy for bringing diverse people together to chat). Diverse networks are 3x more innovative than linear networks (Ruef 2002).
    14. The data scientists will appreciate the analogy to ensemble models, where errors from individual models can offset each other.
    15. See The Goal, by Eliyahu M. Goldratt, which articulates this point in the context of supply chains and manufacturing lines. Maintaining resources at a level above the current needs enables the firm to take advantage of unexpected surges in demand, which more than pays for itself. The practice works for human resources as well.
    16. Causal measurement via randomized controlled trials is ideal, to which algorithmic capabilities are very amenable.
    17. Admittedly, the value of an ad hoc request is not always clear. But there should be a high bar to consume data science resources. A Jira ticket is far too easy to submit. If a topic is important enough, it will merit a meeting to convey context and opportunity.
    18. If you are reading this and find yourself skeptical that your data scientist who spends his time dutifully responding to Jira tickets is capable of coming up with a good business idea, you are likely not wrong. Those comfortable taking tickets are probably not innovators or have been so inculcated to a support role that they have lost the will to innovate.
    19. As the system matures, more specialized resources can be added to make the system more robust. This can create a scramble. However, by finding success first, we are more judicious with our precious development resources.

    References

    1. Page, Scott E. 2017. The Diversity Bonus. Princeton University Press.
    2. Edmondson, Amy C. 2012. Teaming: How Organizations Learn, Innovate, and Compete in the Knowledge Economy. Jossey-Bass.
    3. Haden, Jeff. 2018. “Amazon Founder Jeff Bezos: This Is How Successful People Make Such Smart Decisions.” Inc., December 3. https://www.inc.com/jeff-haden/amazon-founder-jeff-bezos-this-is-how-successful-people-make-such-smart-decisions.html.
    4. Ruef, Martin. 2002. “Strong Ties, Weak Ties and Islands: Structural and Cultural Predictors of Organizational Innovation.” Industrial and Corporate Change 11 (3): 427–449. https://doi.org/10.1093/icc/11.3.427.


    Beyond Skills: Unlocking the Full Potential of Data Scientists was originally published in Towards Data Science on Medium, where people are continuing the conversation by highlighting and responding to this story.

    Originally appeared here:
    Beyond Skills: Unlocking the Full Potential of Data Scientists

    Go Here to Read this Fast! Beyond Skills: Unlocking the Full Potential of Data Scientists

  • A Simple Example Using PCA for Outlier Detection

    A Simple Example Using PCA for Outlier Detection

    W Brett Kennedy

    Improve accuracy, speed, and memory usage by performing PCA transformation before outlier detection

    This article continues a series related to applications of PCA (principle component analysis) for outlier detection, following Using PCA for Outlier Detection. That article described PCA itself, and introduced the two main ways we can use PCA for outlier detection: evaluating the reconstruction error, and running standard outlier detectors on the PCA-transformed space. It also gave an example of the first approach, using reconstruction error, which is straightforward to do using the PCA and KPCA detectors provided by PyOD.

    This article covers the second approach, where we first transform the data space using PCA and then run standard outlier detection on this. As covered in the previous article, this can in some cases lower interpretability, but it does have some surprising benefits in terms of accuracy, execution time, and memory usage.

    This article is also part of a larger series on outlier detection, so far covering FPOF, Counts Outlier Detector, Distance Metric Learning, Shared Nearest Neighbors, and Doping. This article also includes another excerpt from my book Outlier Detection in Python.

    If you’re reasonably familiar with PCA itself (as it’s used for dimensionality reduction or visualization), you can probably skip the previous article if you wish, and dive straight into this one. I will, though, very quickly review the main idea.

    PCA is a means to transform data (viewing data records as points in high-dimensional space) from one set of coordinates to another. If we start with a dataset (as shown below in the left pane), with 100 records and two features, then we can view the data as 100 points in 2-dimensional space. With more realistic data, we would have many more records and many more dimensions, but the same idea holds. Using PCA, we move the data to a new set of coordinates, so effectively create a new set of features describing each record. As described in the previous article, this is done by identifying orthogonal lines through the data (shown in the left pane as the blue and orange lines) that fit the data well.

    So, if we start with a dataset, such as is shown in the left pane below, we can apply PCA transformation to transform the data into something like is shown in the right pane. In the right pane, we show the two PCA components the data was mapped to. The components are simply named 0 and 1.

    Left pane: 100 data points in a dataset with two features. The blue and orange lines show orthogonal lines that may be drawn through the data to capture the location of the points well. These are used to determine the PCA transformation. Right pane: the same data after PCA transformation. We have the same 100 data points, but two new coordinates, called Component 0 and Component 1.

    One thing to note about PCA components is that they are completely uncorrelated. This is a result of how they are constructed; they are based on lines, planes, or hyperplanes through the original data that are all strictly orthogonal to each other. We can see in the right pane, there is no relationship between component 0 and component 1.

    This has strong implications for outlier detection; in particular it means that outliers tend to be transformed into extreme values in one or more of the components, and so are easier to detect. It also means that more sophisticated outlier tests (that test for unusual associations among the features) are not necessary, and simpler tests can be used.

    Univariate and Multivariate outer detectors

    Before looking closer at the benefits of PCA for for outlier detection, I’ll quickly go over two types of outlier detectors. There are many ways to classify outlier detection algorithms, but one useful way is to distinguish between what are called univariate from multivariate tests.

    Univariate Tests

    The term univariate refers to tests that just check one feature — tests that identify the rare or extreme values in that one feature. Examples are tests based on z-score, interquartile range (IQR), inter-decile range (IDR), median absolute deviation (MAD), histogram tests, KDE tests, and so on.

    One histogram-based test provided by PyOD (PyOD is probably the most complete and useful tool for outlier detection on tabular data available in Python today) is HBOS (Histogram-based Outlier Score — described in my Medium article on Counts Outlier Detector, and in detail in Outlier Detection in Python).

    As covered in Using PCA for Outlier Detection, another univariate test provided by PyOD is ECOD.

    To describe univariate tests, we look at an example of outlier detection for a specific real-world dataset. The following table is a subset of the baseball dataset from OpenML (available with a public license), here showing just three rows and five columns (there are several more features in the full dataset). Each row represents one player, with statistics for each, including the number of seasons they played, number of games, and so on.

    Subset of the baseball dataset

    To identify unusual players, we can look for those records with unusual single values (for example, players that played in unusually many seasons, had unusually many At bats, and so on). These would be found with univariate tests.

    For example, using z-score tests to find unusual records, we would actually perform a z-score test on each column, one at a time. We’d first check the Number seasons column (assessing how unusual each value in the column is relative to that column), then the Games played column and so on.

    When checking, for example, the Number seasons column, using a z-score test, we would first determine the mean and standard deviation of the column. (Other tests may determine the median and interquartile range for the column, histogram bin counts, etc.).

    We would then determine the absolute z-score for each value in the Number seasons column: the number of standard deviations each value is from the mean. The larger the z-score, the more unusual the value. Any values with an absolute z-score over about 4.0 or 5.0 can likely be considered anomalous, though this depends on the size of the data and the distribution.

    We’d then repeat this for each other column. Once this is done, we have, for each row, a score for how unusual each value in the row is relative to their columns. So, each row would have a set of scores: one score for each value in that row.

    We then need to determine an overall outlier score for each record. There are different ways to do this, and some nuances associated with each, but two simple methods are to take the average z-score of the values per row, or to take the maximum z-score per row.

    Multivariate Tests

    Multivariate tests consider multiple features at once. In fact, almost all multivariate outlier detectors consider all features at once.

    The majority of outlier detectors (including Isolation Forest, Local Outlier Factor (LOF), KNN, and so on) are based on multivariate tests.

    The advantage of these detectors is, we can look for records with unusual combinations of values. For example, some players may have a typical number of Runs and a typical number of At bats, but may have unusually many (or possibly unusually few) Runs given their number of At bats. These would be found with multivariate tests.

    In the scatter plot above (considering the original data in the left pane), Point A is extreme in both dimensions, so could be detected by a univariate test. In fact, a univariate test on Feature A would likely flag Point A, and a univariate test on Feature B would likely as well, and so Point A, being anomalous in both features, would be scored highly using univariate tests.

    Point B, though, is typical in both dimensions. Only the combination of values is unusual, and to detect this as an anomaly, we would require a multivariate test.

    Normally, when performing outlier detection on tabular data, we’re looking for unusual rows, as opposed to unusual single values. And, unusual rows will include both those rows with unusual single values, as well as unusual combinations of values. So, both univariate and multivariate tests are typically useful. However, multivariate tests will catch both univariate and multivariate outliers (in the scatter plot, a multivariate test such as Isolation Forest, LOF, or KNN would generally catch both Point A and Point B), and so in practice, multivariate tests tend to be used more often.

    Nevertheless, in outlier detection do we quite often limit analysis to univariate tests. Univariate tests are faster — often much faster (which can be very important in real-time environments, or environments where there are very large volumes of data to assess). Univariate tests also tend to be more interpretable.

    And they don’t suffer from the curse of dimensionality. This is covered in Counts Outlier Detector, Shared Nearest Neighbors, and Outlier Detection in Python, but the general idea is that multivariate tests can break down when working with too many features. This is for a number of reasons, but an important one is that distance calculations (which many outlier detectors, including LOF and KNN, rely on) can become meaningless given enough dimensions. Often working with just 20 or more features, and very often with about 50 or more, outlier scores can become unreliable.

    Univariate tests scale to higher dimensions much better than multivariate tests, as they do not rely on distance calculations between the rows.

    And so, there are some major advantages to using univariate tests. But, also some major disadvantages: these miss outliers that relate to unusual combinations of values, and so can detect only a portion of the relevant outliers.

    Univariate tests on PCA components

    So, in most contexts, it’s useful (and more common) to run multivariate tests. But, they are slower, less interpretable, and more susceptible to the curse of dimensionality.

    An interesting effect of PCA transformation is that univariate tests become much more practical. Once PCA transformation is done, there are no associations between the features, and so there is no concept of unusual combinations of values.

    In the scatter plot above (right pane — after the PCA transformation), we can see that Points A and B can both be identified simply as extreme values. Point A is extreme in Component 0; Point B is extreme in Component 1.

    Which means, we can perform outlier detection effectively using simple statistical tests, such as z-score, IQR, IDR or MAD tests, or using simple tools such as HBOS and ECOD.

    Having said that, it’s also possible, after transforming the dataspace using PCA, to still use standard multivariate tests such as Isolation Forest, LOF, or any other standard tools. If these are the tools we most commonly use, there is a convenience to continuing to use them, and to simply first transform the data using PCA as a pre-processing step.

    One advantage they provide over statistical methods (such as z-score, etc.) is that they automatically provide a single outlier score for each record. If we use z-score tests on each record, and the data has, say, 20 features and we convert this to 10 components (it’s possible to not use all components, as described below), then each record will have 10 outlier scores — one related to how unusual it is in each of the 10 components used. It’s then necessary to combine these scores into a single outlier score. As indicated above, there are simple ways to do this (including taking the mean, median, or maximum z-score for each value per row), but there are some complications doing this (as covered in Outlier Detection in Python). This is quite manageable, but having a detector provide a single score is convenient as well.

    Example of outlier detection with PCA

    We’ll now look at an example using PCA to help better identify outliers in a dataset. To make it easier to see how outlier detection works with PCA, for this example we’ll create two quite straightforward synthetic datasets. We’ll create both with 100,000 rows and 10 features. And we add some known outliers, somewhat similar to Points A and B in the scatter plot above.

    We limit the datasets to ten features for simplicity, but as suggested above and in the previous article, there can be strong benefits to using PCA in high-dimensional space, and so (though it’s not covered in this example), more of an advantage to using PCA with, say, hundreds of features, than ten. The datasets used here, though, are reasonably easy to work with and to understand.

    The first dataset, data_corr, is created to have strong associations (correlations) between the features. We update the last row to contain some large (but not exceptionally large) values. The main thing is that this row deviates from the normal patterns between the features.

    We create another test dataset called data_extreme, which has no associations between the features. The last row of this is modified to contain extreme values in some features.

    This allows us to test with two well-understood data distributions as well as well-understood outlier types (we have one outlier in data_corr that ignores the normal correlations between the features; and we have one outlier in data_extreme that has extreme values in some features).

    This example uses several PyOD detectors, which requires first executing:

    pip install pyod

    The code then starts with creating the first test dataset:

    import numpy as np
    import pandas as pd
    from sklearn.decomposition import PCA
    from pyod.models.ecod import ECOD
    from pyod.models.iforest import IForest
    from pyod.models.lof import LOF
    from pyod.models.hbos import HBOS
    from pyod.models.gmm import GMM
    from pyod.models.abod import ABOD
    import time

    np.random.seed(0)

    num_rows = 100_000
    num_cols = 10
    data_corr = pd.DataFrame({0: np.random.random(num_rows)})

    for i in range(1, num_cols):
    data_corr[i] = data_corr[i-1] + (np.random.random(num_rows) / 10.0)

    copy_row = data_corr[0].argmax()
    data_corr.loc[num_rows-1, 2] = data_corr.loc[copy_row, 2]
    data_corr.loc[num_rows-1, 4] = data_corr.loc[copy_row, 4]
    data_corr.loc[num_rows-1, 6] = data_corr.loc[copy_row, 6]
    data_corr.loc[num_rows-1, 8] = data_corr.loc[copy_row, 8]

    start_time = time.process_time()
    pca = PCA(n_components=num_cols)
    pca.fit(data_corr)
    data_corr_pca = pd.DataFrame(pca.transform(data_corr),
    columns=[x for x in range(num_cols)])
    print("Time for PCA tranformation:", (time.process_time() - start_time))

    We now have the first test dataset, data_corr. When creating this, we set each feature to be the sum of the previous features plus some randomness, so all features are well-correlated. The last row is deliberately set as an outlier. The values are large, though not outside of the existing data. The values in the known outlier, though, do not follow the normal patterns between the features.

    We then calculate the PCA transformation of this.

    We next do this for the other test dataset:

    np.random.seed(0)

    data_extreme = pd.DataFrame()
    for i in range(num_cols):
    data_extreme[i] = np.random.random(num_rows)

    copy_row = data_extreme[0].argmax()
    data_extreme.loc[num_rows-1, 2] = data_extreme[2].max() * 1.5
    data_extreme.loc[num_rows-1, 4] = data_extreme[4].max() * 1.5
    data_extreme.loc[num_rows-1, 6] = data_extreme[6].max() * 1.5
    data_extreme.loc[num_rows-1, 8] = data_extreme[8].max() * 1.5

    start_time = time.process_time()
    pca = PCA(n_components=num_cols)
    pca.fit(data_corr)
    data_extreme_pca = pd.DataFrame(pca.transform(data_corr),
    columns=[x for x in range(num_cols)])

    print("Time for PCA tranformation:", (time.process_time() - start_time))

    Here each feature is created independently, so there are no associations between the features. Each feature simply follows a uniform distribution. The last row is set as an outlier, having extreme values in features 2, 4, 6, and 8, so in four of the ten features.

    We now have both test datasets. We next define a function that, given a dataset and a detector, will train the detector on the full dataset as well as predict on the same data (so will identify the outliers in a single dataset), timing both operations. For the ECOD (empirical cumulative distribution) detector, we add special handling to create a new instance so as not to maintain a memory from previous executions (this is not necessary with the other detectors):

    def evaluate_detector(df, clf, model_type):
    """
    params:
    df: data to be assessed, in a pandas dataframe
    clf: outlier detector
    model_type: string indicating the type of the outlier detector
    """

    global scores_df

    if "ECOD" in model_type:
    clf = ECOD()
    start_time = time.process_time()
    clf.fit(df)
    time_for_fit = (time.process_time() - start_time)

    start_time = time.process_time()
    pred = clf.decision_function(df)
    time_for_predict = (time.process_time() - start_time)

    scores_df[f'{model_type} Scores'] = pred
    scores_df[f'{model_type} Rank'] =
    scores_df[f'{model_type} Scores'].rank(ascending=False)

    print(f"{model_type:<20} Fit Time: {time_for_fit:.2f}")
    print(f"{model_type:<20} Predict Time: {time_for_predict:.2f}")

    The next function defined executes for each dataset, calling the previous method for each. Here we test four cases: using the original data, using the PCA-transformed data, using the first 3 components of the PCA-transformed data, and using the last 3 components. This will tell us how these four cases compare in terms of time and accuracy.

    def evaluate_dataset_variations(df, df_pca, clf, model_name): 
    evaluate_detector(df, clf, model_name)
    evaluate_detector(df_pca, clf, f'{model_name} (PCA)')
    evaluate_detector(df_pca[[0, 1, 2]], clf, f'{model_name} (PCA - 1st 3)')
    evaluate_detector(df_pca[[7, 8, 9]], clf, f'{model_name} (PCA - last 3)')

    As described below, using just the last three components works well here in terms of accuracy, but in other cases, using the early components (or the middle components) can work well. This is included here as an example, but the remainder of the article will focus just on the option of using the last three components.

    The final function defined is called for each dataset. It executes the previous function for each detector tested here. For this example, we use six detectors, each from PyOD (Isolation Forest, LOF, ECOD, HBOS, Gaussian Mixture Models (GMM), and Angle-based Outlier Detector (ABOD)):

    def evaluate_dataset(df, df_pca): 
    clf = IForest()
    evaluate_dataset_variations(df, df_pca, clf, 'IF')

    clf = LOF(novelty=True)
    evaluate_dataset_variations(df, df_pca, clf, 'LOF')

    clf = ECOD()
    evaluate_dataset_variations(df, df_pca, clf, 'ECOD')

    clf = HBOS()
    evaluate_dataset_variations(df, df_pca, clf, 'HBOS')

    clf = GMM()
    evaluate_dataset_variations(df, df_pca, clf, 'GMM')

    clf = ABOD()
    evaluate_dataset_variations(df, df_pca, clf, 'ABOD')

    We finally call the evaluate_dataset() method for both test datasets and print out the top outliers (the known outliers are known to be in the last rows of the two test datasets):

    # Test the first dataset
    # scores_df stores the outlier scores given to each record by each detector
    scores_df = data_corr.copy()
    evaluate_dataset(data_corr, data_corr_pca)
    rank_columns = [x for x in scores_df.columns if type(x) == str and 'Rank' in x]
    print(scores_df[rank_columns].tail())

    # Test the second dataset
    scores_df = data_extreme.copy()
    evaluate_dataset(data_extreme, data_extreme_pca)
    rank_columns = [x for x in scores_df.columns if type(x) == str and 'Rank' in x]
    print(scores_df[rank_columns].tail())

    There are several interesting results. We look first at the fit times for the data_corr dataset, shown in table below (the fit and predict times for the other test set were similar, so not shown here). The tests were conducted on Google colab, with the times shown in seconds. We see that different detectors have quite different times. ABOD is significantly slower than the others, and HBOS considerably faster. The other univariate detector included here, ECOD, is also very fast.

    The times to fit the PCA-transformed data are about the same as the original data, which makes sense given this data is the same size: we converted the 10 features to 10 components, which are equivalent, in terms of time, to process.

    We also test using only the last three PCA components (components 7, 8, and 9), and the fit times are drastically reduced in some cases, particularly for local outlier factor (LOF). Compared to using all 10 original features (19.4s), or using all 10 PCA components (16.9s), using 3 components required only 1.4s. In all cases as well0, other than Isolation Forest, there is a notable drop in fit time.

    Fit times for 6 PyOD detectors on the first test dataset, data_corr.

    In the next table, we see the predict times for the data_corr dataset (the times for the other test set were similar here as well). Again, we see a very sizable drop in prediction times using just three components, especially for LOF. We also see again that the two univariate detectors, HBOS and ECOD were among the fastest, though GMM is as fast or faster in the case of prediction (though slightly slower in terms of fit time).

    With Isolation Forest (IF), as we train the same number of trees regardless of the number of features, and pass all records to be evaluated through the same set of trees, the times are unaffected by the number of features. For all other detectors shown here, however, the number of features is very relevant: all others show a significant drop in predict time when using 3 components compared to all 10 original features or all 10 components.

    Predict times for 6 PyOD detectors on the first dataset, data_corr

    In terms of accuracy, all five detectors performed well on the two datasets most of the time, in terms of assigning the highest outlier score to the last row, which, for both test datasets, is the one known outlier. The results are shown in the next table. There are two rows, one for each dataset. For each, we show the rank assigned by each detector to the one known outlier. Ideally, all detectors would assign this rank 1 (the highest outlier score).

    In most cases, the last row was, in fact, given the highest or nearly highest rank, with the exception of IF, ECOD, and HBOS on the first dataset. This is a good example where even strong detectors such as IF can occasionally do poorly even for clear outliers.

    Rank assigned to the one known outlier in both test datasets using 6 PyOD detectors when executed on the original data.

    For the first dataset, ECOD and HBOS completely miss the outlier, but this is as expected, as it is an outlier based on a combination of values (it ignores the normal linear relationship among the features), which univariate tests are unable to detect. The second dataset’s outlier is based on extreme values, which both univariate and multivariate tests are typically able to detect reliably, and can do so here.

    We see a drastic improvement in accuracy when using PCA for these datasets and these detectors, shown in the next table. This is not always the case, but it does hold true here. When the detectors execute on the PCA-transformed data, all 6 detectors rank the known outlier the highest on both datasets. When data is PCA-transformed, the components are all unassociated with each other; the outliers are the extreme values, which are much easier to identify.

    Rank assigned to the one known outlier in both test datasets using 6 PyOD detectors when executed on the PCA-transformed data, using all 10 components.

    Also interesting is that only the last three components are necessary to rank the known outliers as the top outliers, shown in the table here.

    Similar to the previous table, but using only 3 PCA components.

    And, as we saw above, fit and predict times are substantially shorter in these cases. This is where we can achieve significant performance improvements using PCA: it’s often necessary to use only a small number of the components.

    Using only a small set of components will also reduce memory requirements. This is not always an issue, but often when working with large datasets, this can be an important consideration.

    This experiment covered two of the main types of outliers we can have with data: extreme values and values that deviate from a linear pattern, both of which are identifiable in the later components. In these cases, using the last three components worked well.

    It can vary how many components to use, and which components are best to use, and some experimentation will be needed (likely best discovered using doped data). In some cases, it may be preferable (in terms of execution time, detecting the relevant outliers reliably, and reducing noise) to use the earlier components, in some cases the middle, and in some cases the later. As we can see in the scatter plot at the beginning of this article, different components can tend to highlight different types of outlier.

    Improving the outlier detection system over time

    Another useful benefit of working with PCA components is that it can make it easier to tune the outlier detection system over time. Often with outlier detection, the system is run not just once on a single dataset, but on an ongoing basis, so constantly assessing new data as it arrives (for example, new financial transactions, sensor readings, web site logs, network logs, etc.), and over time we gain a better sense of what outliers are most relevant to us, and which are being under- and over-reported.

    As the outliers reported when working with PCA-transformed data all relate to a single component, we can see how many relevant and irrelevant outliers being reported are associated with each component. This can be particularly easy when using simple univariate tests on each component, like z-score, IQR, IDR, MAD-based tests, and similar tests.

    Over time, we can learn to weight outliers associated with some components more highly and other components lower (depending on our tolerance for false positive and false negatives).

    Visualization

    Dimensionality reduction also has some advantages in that it can help visualize the outliers, particularly where we reduce the data to two or three dimensions. Though, as with the original features, even where there are more than three dimensions, we can view the PCA components one at a time in the form of histograms, or two at a time in scatter plots.

    For example, inspecting the last two components of the first test dataset, data_corr (which contained unusual combinations of values) we can see the known outlier clearly, as shown below. However, it’s somewhat questionable how informative this is, as the components themselves are difficult to understand.

    Scatterplot of the last two components (components 8 and 9) of the PCA transformation of the first dataset, which contained an unusual combination of values. Here we see a single point in the top-right of the space. It is clear that the point is a strong outlier, though it is not as clear what components 8 and 9 represent.

    Conclusions

    This article covered PCA, but there are other dimensionality reduction tools that can be similarly used, including t-SNE (as with PCA, this is provided in scikit-learn), UMAP, and auto-encoders (also covered in Outlier Detection in Python).

    As well, using PCA, methods based on reconstruction error (measuring how well the values of a record can be approximated using only a subset of the components) can be very effective and is often worth investigating, as covered in the previous article in this series.

    This article covered using standard outlier detectors (though, as demonstrated, this can more readily include simple univariate outlier detectors than is normally possible) for outlier detection, showing the benefits of first transforming the data using PCA.

    How well this process will work depends on the data (for example, PCA relies on there being strong linear relationships between the features, and can breakdown if the data is heavily clustered) and the types of outliers you’re interested in finding. It’s usually necessary to use doping or other forms of testing to determine how well this works, and to tune the process — particularly determining which components are used. Where there are no constraints related to execution time or memory limits though, it can be a good starting point to simply use all components and weight them equally.

    As well, in outlier detection, usually no single outlier detection process will reliably identify all the types of outliers you’re interested in (especially where you’re interested in finding all records that can be reasonably considered statistically unusual in one way or another), and so multiple outlier detection methods generally need to be used. Combining PCA-based outlier detection with other methods can cover a wider range of outliers than can be detected using just PCA-based methods, or just methods without PCA transformations.

    But, where PCA-based methods work well, they can often provide more accurate detection, as the outliers are often better separated and easier to detect.

    PCA-based methods can also execute more quickly (particularly where they’re sufficient and do not need to be combined with other methods), because: 1) simpler (and faster) detectors such as z-score, IQR, HBOS and ECOD can be used; and 2) fewer components may be used. The PCA transformations themselves are generally extremely fast, with times almost negligible compared to fitting or executing outlier detection.

    Using PCA, at least where only a subset of the components are necessary, can also reduce memory requirements, which can be an issue when working with particularly large datasets.

    All images by author


    A Simple Example Using PCA for Outlier Detection was originally published in Towards Data Science on Medium, where people are continuing the conversation by highlighting and responding to this story.

    Originally appeared here:
    A Simple Example Using PCA for Outlier Detection

    Go Here to Read this Fast! A Simple Example Using PCA for Outlier Detection