Category: AI

  • Semantic Signal Separation

    Semantic Signal Separation

    Márton Kardos

    Understand Semantic Structures with Transformers and Topic Modeling

    We live in the age of big data. At this point it’s become a cliche to say that data is the oil of the 21st century but it really is so. Data collection practices have resulted in huge piles of data in just about everyone’s hands.

    Interpreting data, however, is no easy task, and much of the industry and academia still rely on solutions, which provide little in the ways of explanations. While deep learning is incredibly useful for predictive purposes, it rarely gives practitioners an understanding of the mechanics and structures that underlie the data.

    Textual data is especially tricky. While natural language and concepts like “topics” are incredibly easy for humans to have an intuitive grasp of, producing operational definitions of semantic structures is far from trivial.

    In this article I will introduce you to different conceptualizations of discovering latent semantic structures in natural language, we will look at operational definitions of the theory, and at last I will demonstrate the usefulness of the method with a case study.

    Theory: What is a “Topic”?

    While topic to us humans seems like a completely intuitive and self-explanatory term, it is hardly so when we try to come up with a useful and informative definition. The Oxford dictionary’s definition is luckily here to help us:

    A subject that is discussed, written about, or studied.

    Well, this didn’t get us much closer to something we can formulate in computational terms. Notice how the word subject, is used to hide all the gory details. This need not deter us, however, we can certainly do better.

    Semantic Space of Academic Disciplines

    In Natural Language Processing, we often use a spatial definition of semantics. This might sound fancy, but essentially we imagine that semantic content of text/language can be expressed in some continuous space (often high-dimensional), where concepts or texts that are related are closer to each other than those that aren’t. If we embrace this theory of semantics, we can easily come up with two possible definitions for topic.

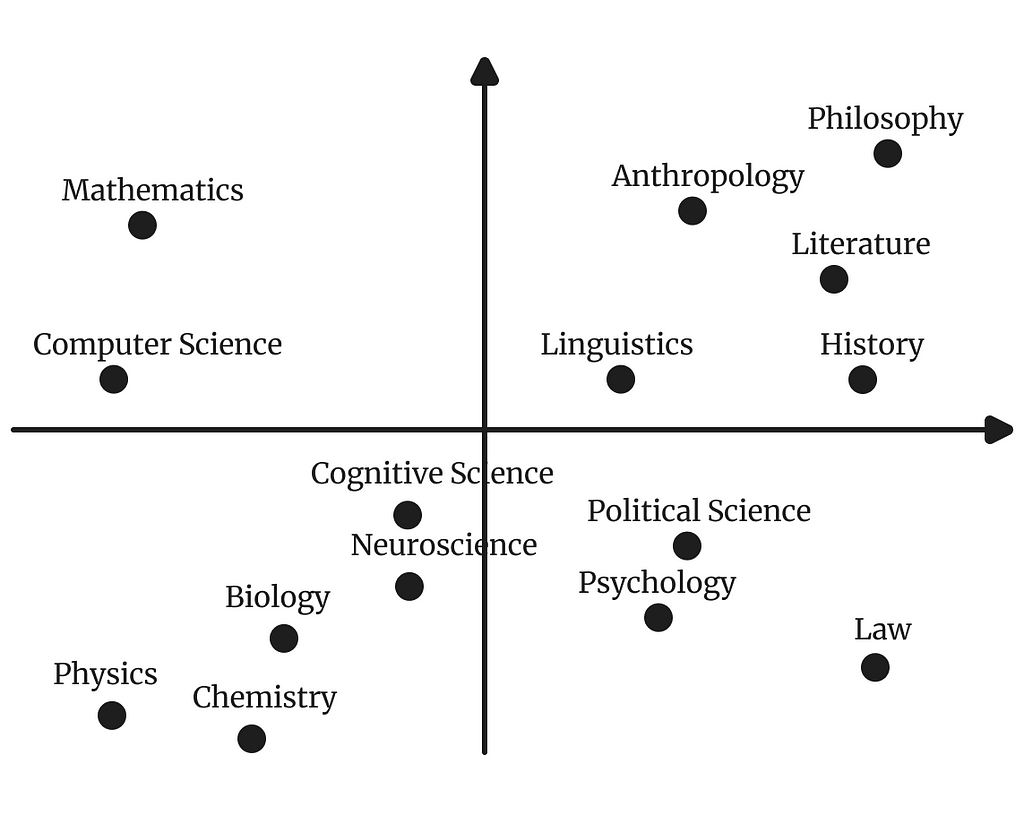
    Topics as Semantic Clusters

    A rather intuitive conceptualization is to imagine topic as groups of passages/concepts in semantic space that are closely related to each other, but not as closely related to other texts. This incidentally means that one passage can only belong to one topic at a time.

    Semantic Clusters of Academic Disciplines

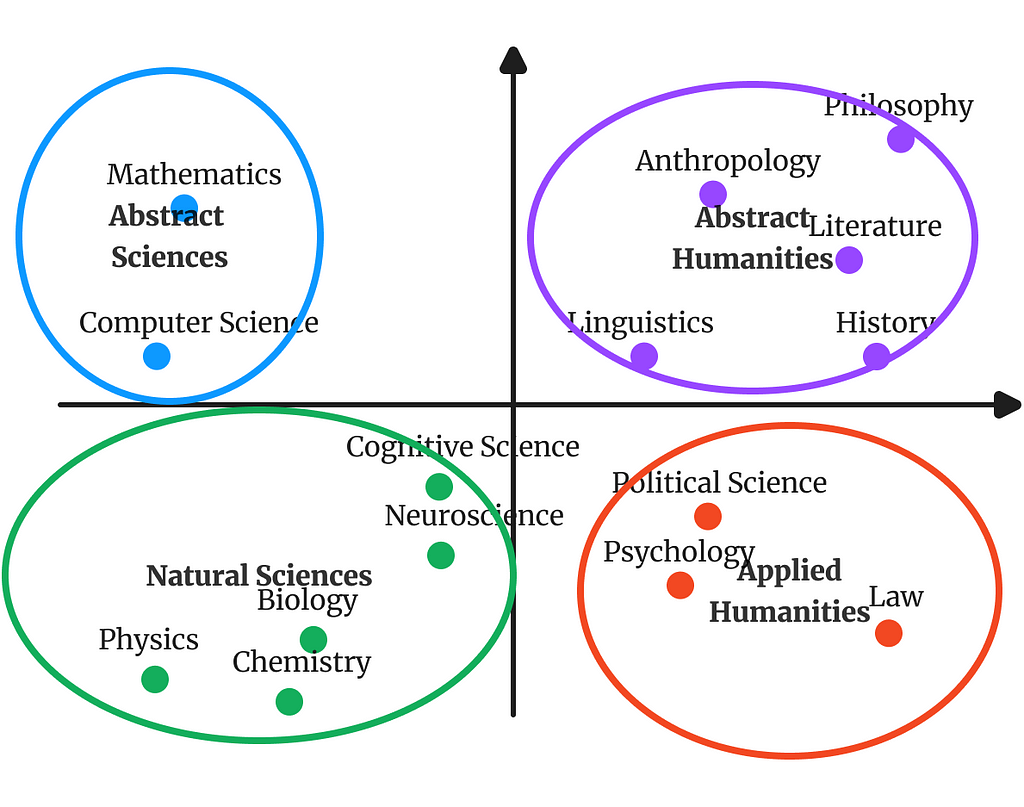
    This clustering conceptualization also lends itself to thinking about topics hierarchically. You can imagine that the topic “animals” might contain two subclusters, one which is “Eukaryates”, while the other is “Prokaryates”, and then you could go down this hierarchy, until, at the leaves of the tree you will find actual instances of concepts.

    Of course a limitation of this approach is that longer passages might contain multiple topics in them. This could either be addressed by splitting up texts to smaller, atomic parts (e.g. words) and modeling over those, but we can also ditch the clustering conceptualization alltogether.

    Topics as Axes of Semantics

    We can also think of topics as the underlying dimensions of the semantic space in a corpus. Or in other words: Instead of describing what groups of documents there are we are explaining variation in documents by finding underlying semantic signals.

    Underlying Axes in the Semantic Space of Academic Disciplines

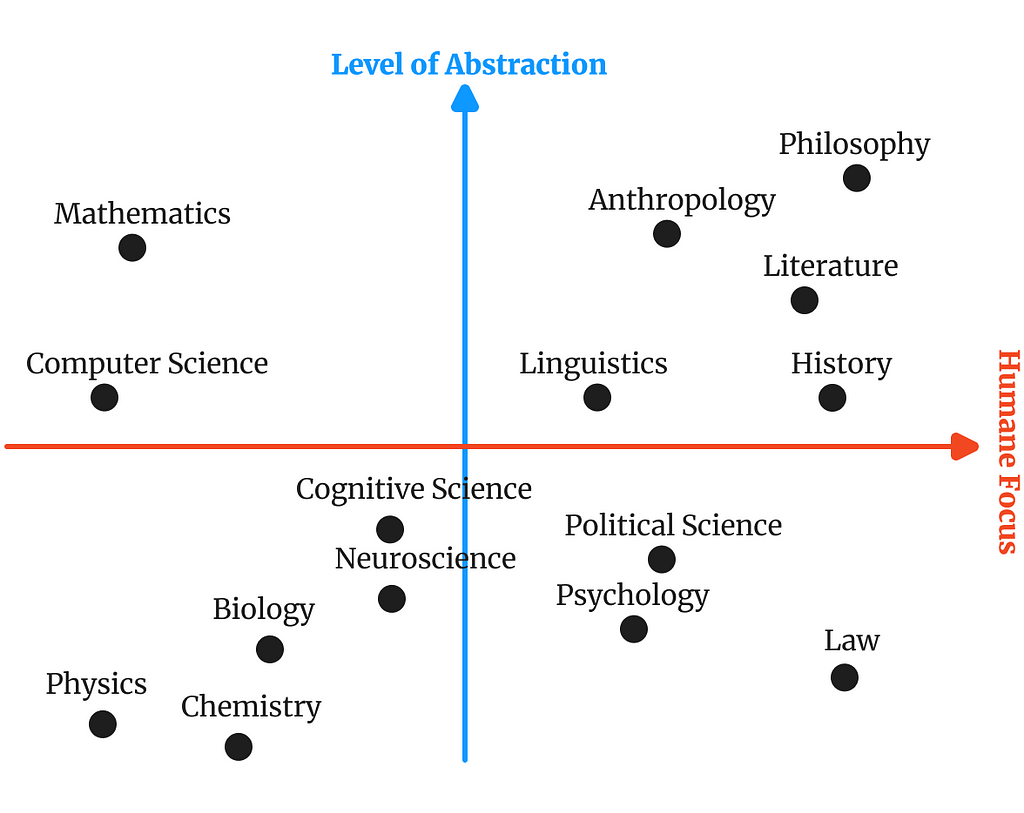
    We are explaining variation in documents by finding underlying semantic signals.

    You could for instance imagine that the most important axes that underlie restaurant reviews would be:

    1. Satisfaction with the food
    2. Satisfaction with the service

    I hope you see why this conceptualization is useful for certain purposes. Instead of us finding “good reviews” and “bad reviews”, we get an understanding of what it is that drives differences between these. A pop culture example of this kind of theorizing is of course the political compass. Yet again, instead of us being interested in finding “conservatives” and “progressives”, we find the factors that differentiate these.

    Let’s Model!

    Now that we got the philosophy out of the way, we can get our hands dirty with designing computational models based on our conceptual understanding.

    Semantic Representations

    Classically the way we represented the semantic content of texts, was the so-called bag-of-words model. Essentially you make the very strong, and almost trivially wrong assumption, that the unordered collection of words in a document is constitutive of its semantic content. While these representations are plagued with a number of issues (curse of dimensionality, discrete space, etc.) they have been demonstrated useful by decades of research.

    Luckily for us, the state of the art has progressed beyond these representations, and we have access to models that can represent text in context. Sentence Transformers are transformer models which can encode passages into a high-dimensional continuous space, where semantic similarity is indicated by vectors having high cosine similarity. In this article I will mainly focus on models that use these representations.

    Clustering Models

    Models that are currently the most widespread in the topic modeling community for contextually sensitive topic modeling (Top2Vec, BERTopic) are based on the clustering conceptualization of topics.

    Clusters in Semantic Space Discovered by BERTopic (figure from BERTopic’s documentation)

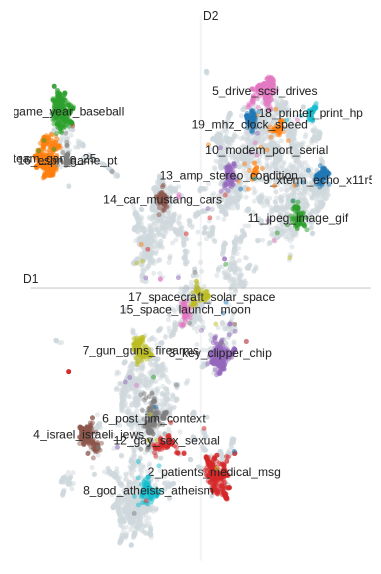
    They discover topics in a process that consists of the following steps:

    1. Reduce dimensionality of semantic representations using UMAP
    2. Discover cluster hierarchy using HDBSCAN
    3. Estimate importances of terms for each cluster using post-hoc descriptive methods (c-TF-IDF, proximity to cluster centroid)

    These models have gained a lot of traction, mainly due to their interpretable topic descriptions and their ability to recover hierarchies, as well as to learn the number of topics from the data.

    If we want to model nuances in topical content, and understand factors of semantics, clustering models are not enough.

    I do not intend to go into great detail about the practical advantages and limitations of these approaches, but most of them stem from philosophical considerations outlined above.

    Semantic Signal Separation

    If we are to discover the axes of semantics in a corpus, we will need a new statistical model.

    We can take inspiration from classical topic models, such as Latent Semantic Allocation. LSA utilizes matrix decomposition to find latent components in bag-of-words representations. LSA’s main goal is to find words that are highly correlated, and explain their cooccurrence as an underlying semantic component.

    Since we are no longer dealing with bag-of-words, explaining away correlation might not be an optimal strategy for us. Orthogonality is not statistical independence. Or in other words: Just because two components are uncorrelated, it does not mean that they are statistically independent.

    Orthogonality is not statistical independence

    Other disciplines have luckily come up with decomposition models that discover maximally independent components. Independent Component Analysis has been extensively used in Neuroscience to discover and remove noise signals from EEG data.

    Difference between Orthogonality and Independence Demonstrated with PCA and ICA (Figure from scikit-learn’s documentation)

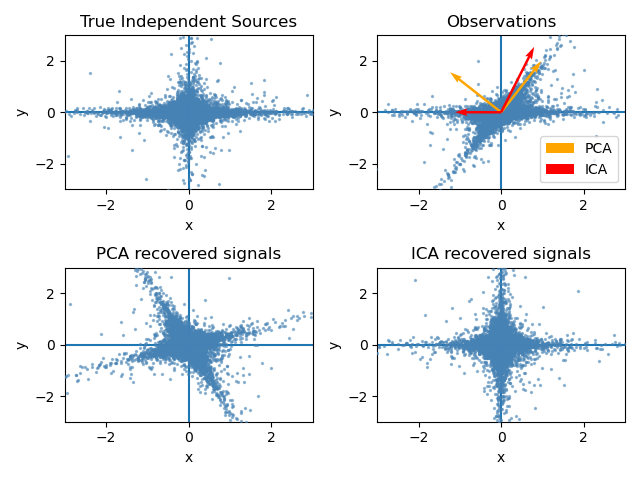
    The main idea behind Semantic Signal Separation is that we can find maximally independent underlying semantic signals in a corpus of text by decomposing representations with ICA.

    We can gain human-readable descriptions of topics by taking terms from the corpus that rank highest on a given component.

    Case Study: Machine Learning Papers

    To demonstrate the usefulness of Semantic Signal Separation for understanding semantic variation in corpora, we will fit a model on a dataset of approximately 118k machine learning abstracts.

    To reiterate once again what we’re trying to achieve here: We want to establish the dimensions, along which all machine learning papers are distributed. Or in other words we would like to build a spatial theory of semantics for this corpus.

    For this we are going to use a Python library I developed called Turftopic, which has implementations of most topic models that utilize representations from transformers, including Semantic Signal Separation. Additionally we are going to install the HuggingFace datasets library so that we can download the corpus at hand.

    pip install turftopic datasets

    Let us download the data from HuggingFace:

    from datasets import load_dataset

    ds = load_dataset("CShorten/ML-ArXiv-Papers", split="train")

    We are then going to run Semantic Signal Separation on this data. We are going to use the all-MiniLM-L12-v2 Sentence Transformer, as it is quite fast, but provides reasonably high quality embeddings.

    from turftopic import SemanticSignalSeparation

    model = SemanticSignalSeparation(10, encoder="all-MiniLM-L12-v2")
    model.fit(ds["abstract"])

    model.print_topics()
    Topics Found in the Abstracts by Semantic Signal Separation

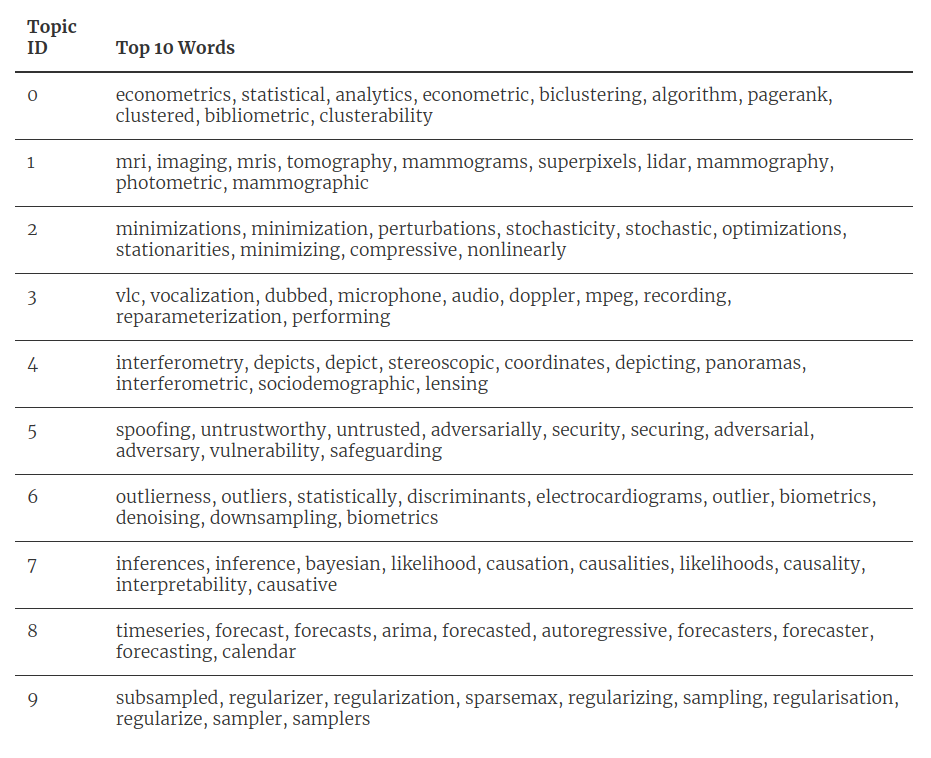
    These are highest ranking keywords for the ten axes we found in the corpus. You can see that most of these are quite readily interpretable, and already help you see what underlies differences in machine learning papers.

    I will focus on three axes, sort of arbitrarily, because I found them to be interesting. I’m a Bayesian evangelist, so Topic 7 seems like an interesting one, as it seems that this component describes how probabilistic, model based and causal papers are. Topic 6 seems to be about noise detection and removal, and Topic 1 is mostly concerned with measurement devices.

    We are going to produce a plot where we display a subset of the vocabulary where we can see how high terms rank on each of these components.

    First let’s extract the vocabulary from the model, and select a number of words to display on our graphs. I chose to go with words that are in the 99th percentile based on frequency (so that they still remain somewhat visible on a scatter plot).

    import numpy as np

    vocab = model.get_vocab()

    # We will produce a BoW matrix to extract term frequencies
    document_term_matrix = model.vectorizer.transform(ds["abstract"])
    frequencies = document_term_matrix.sum(axis=0)
    frequencies = np.squeeze(np.asarray(frequencies))

    # We select the 99th percentile
    selected_terms_mask = frequencies > np.quantile(frequencies, 0.99)

    We will make a DataFrame with the three selected dimensions and the terms so we can easily plot later.

    import pandas as pd

    # model.components_ is a n_topics x n_terms matrix
    # It contains the strength of all components for each word.
    # Here we are selecting components for the words we selected earlier

    terms_with_axes = pd.DataFrame({
    "inference": model.components_[7][selected_terms],
    "measurement_devices": model.components_[1][selected_terms],
    "noise": model.components_[6][selected_terms],
    "term": vocab[selected_terms]
    })

    We will use the Plotly graphing library for creating an interactive scatter plot for interpretation. The X axis is going to be the inference/Bayesian topic, Y axis is going to be the noise topic, and the color of the dots is going to be determined by the measurement device topic.

    import plotly.express as px

    px.scatter(
    terms_with_axes,
    text="term",
    x="inference",
    y="noise",
    color="measurement_devices",
    template="plotly_white",
    color_continuous_scale="Bluered",
    ).update_layout(
    width=1200,
    height=800
    ).update_traces(
    textposition="top center",
    marker=dict(size=12, line=dict(width=2, color="white"))
    )
    Plot of Most Frequent Terms in the Corpus Distributed by Semantic Axes

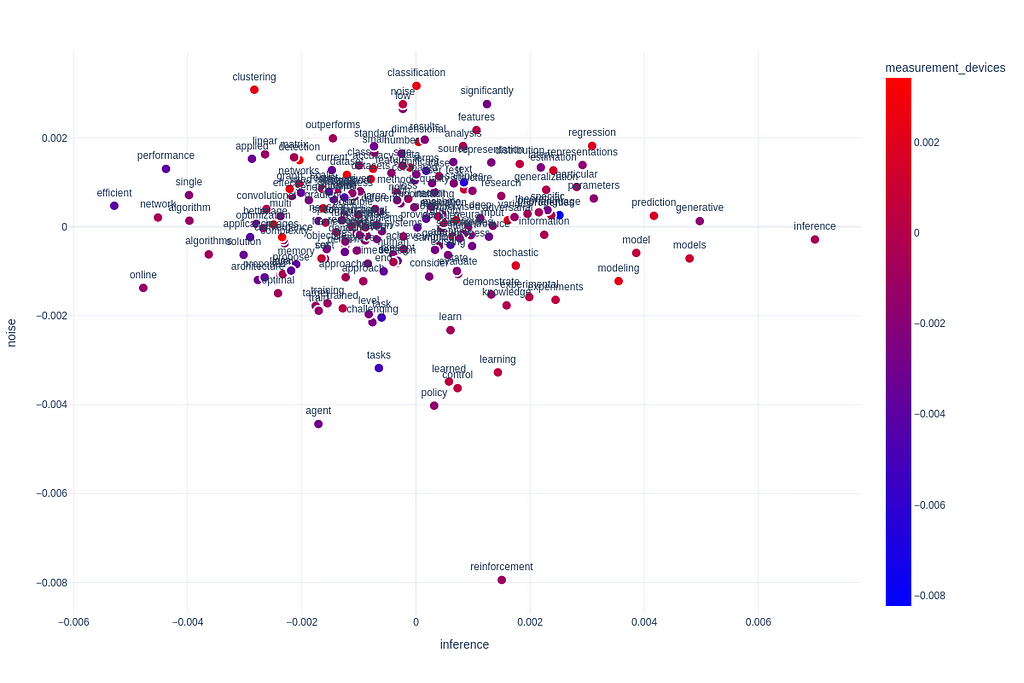
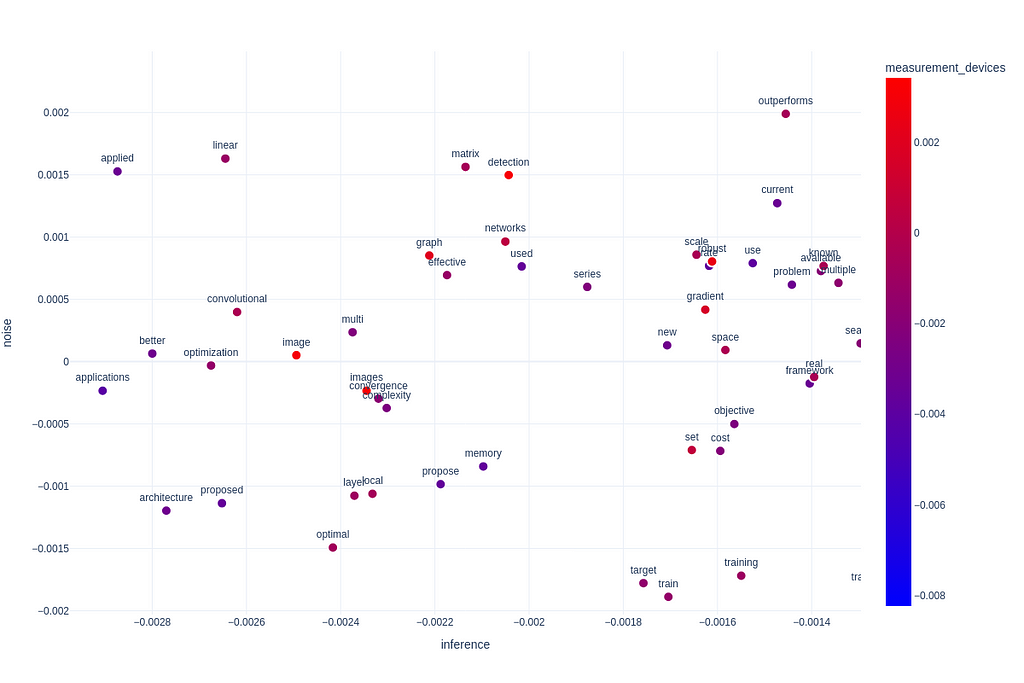
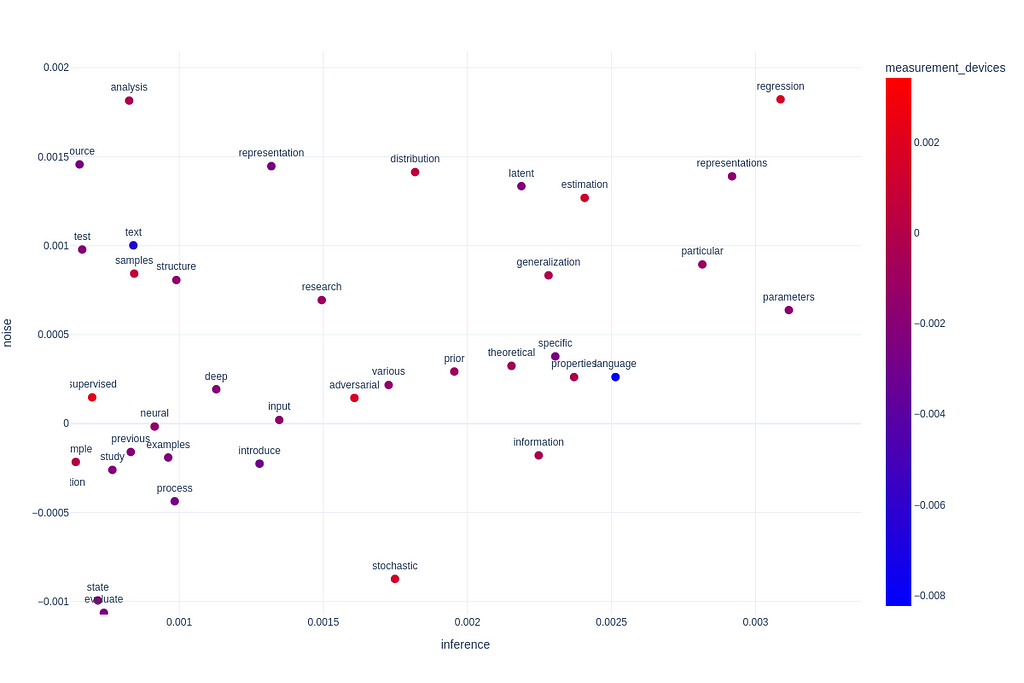
    We can already infer a lot about the semantic structure of our corpus based on this visualization. For instance we can see that papers that are concerned with efficiency, online fitting and algorithms score very low on statistical inference, this is somewhat intuitive. On the other hand what Semantic Signal Separation has already helped us do in a data-based approach is confirm, that deep learning papers are not very concerned with statistical inference and Bayesian modeling. We can see this from the words “network” and “networks” (along with “convolutional”) ranking very low on our Bayesian axis. This is one of the criticisms the field has received. We’ve just given support to this claim with empirical evidence.

    Deep learning papers are not very concerned with statistical inference and Bayesian modeling, which is one of the criticisms the field has received. We’ve just given support to this claim with empirical evidence.

    We can also see that clustering and classification is very concerned with noise, but that agent-based models and reinforcement learning isn’t.

    Additionally an interesting pattern we may observe is the relation of our Noise axis to measurement devices. The words “image”, “images”, “detection” and “robust” stand out as scoring very high on our measurement axis. These are also in a region of the graph where noise detection/removal is relatively high, while talk about statistical inference is low. What this suggests to us, is that measurement devices capture a lot of noise, and that the literature is trying to counteract these issues, but mainly not by incorporating noise into their statistical models, but by preprocessing. This makes a lot of sense, as for instance, Neuroscience is known for having very extensive preprocessing pipelines, and many of their models have a hard time dealing with noise.

    Noise in Measurement Devices’ Output is Countered with Preprocessing

    We can also observe that the lowest scoring terms on measurement devices is “text” and “language”. It seems that NLP and machine learning research is not very concerned with neurological bases of language, and psycholinguistics. Observe that “latent” and “representation is also relatively low on measurement devices, suggesting that machine learning research in neuroscience is not super involved with representation learning.

    Text and Language are Rarely Related with Measurement Devices

    Of course the possibilities from here are endless, we could spend a lot more time interpreting the results of our model, but my intent was to demonstrate that we can already find claims and establish a theory of semantics in a corpus by using Semantic Signal Separation.

    Semantic Signal Separation should mainly be used as an exploratory measure for establishing theories, rather than taking its results as proof of a hypothesis.

    One thing I would like to emphasize is that Semantic Signal Separation should mainly be used as an exploratory measure for establishing theories, rather than taking its results as proof of a hypothesis. What I mean here, is that our results are sufficient for gaining an intuitive understanding of differentiating factors in our corpus, an then building a theory about what is happening, and why it is happening, but it is not sufficient for establishing the theory’s correctness.

    Conclusion

    Exploratory data analysis can be confusing, and there are of course no one-size-fits-all solutions for understanding your data. Together we’ve looked at how to enhance our understanding with a model-based approach from theory, through computational formulation, to practice.

    I hope this article will serve you well when analysing discourse in large textual corpora. If you intend to learn more about topic models and exploratory text analysis, make sure to have a look at some of my other articles as well, as they discuss some aspects of these subjects in greater detail.

    (( Unless stated otherwise, figures were produced by the author. ))


    Semantic Signal Separation was originally published in Towards Data Science on Medium, where people are continuing the conversation by highlighting and responding to this story.

    Originally appeared here:
    Semantic Signal Separation

    Go Here to Read this Fast! Semantic Signal Separation

  • Large Language Models, GPT-2 — Language Models are Unsupervised Multitask Learners

    Large Language Models, GPT-2 — Language Models are Unsupervised Multitask Learners

    Vyacheslav Efimov

    Large Language Models, GPT-2 — Language Models Are Unsupervised Multitask Learners

    Acing GPT capabilities by turning it into a powerful multitask zero-shot model

    Introduction

    GPT is a well-known series of models whose last versions are currently dominating in various NLP tasks. The first GPT version was a significant milestone: being trained on enormous 120M parameters, this model demonstrated state-of-the-art performance on top benchmarks. Starting from this point, researchers tried to improve the base version.

    In 2019, researchers from OpenAI officially released GPT-2. It was 10 times bigger than GPT-1 which allowed it to improve performance even further. Apart from that, the authors conjectured in their work that LLMs are multitask learners meaning that they can learn to perform several tasks at the same time. This important statement made it possible to further develop LLMs in a much more efficient framework.

    In this article, we will refer to the official GPT-2 paper by going through its main aspects and improvements over GPT-1 and understand a novel approach for building LLMs.

    Note. This article assumes that you are already familiar with the first version of GPT. If not, check out this article.

    Large Language Models, GPT-1 — Generative Pre-Trained Transformer

    The importance of understanding the GPT evolution

    It is no secret that with the recent introduction of powerful models like ChatGPT or GPT-4, the first GPT versions no longer attract that much attention and appear obsolete.

    Nevertheless, the following reasons explain the important motivation behind studying the GPT evolution.

    • The first GPT versions introduced language learning concepts that are still used by the most recent models. The best example is GPT-2 innovating the multitask learning technique. Thanks to this concept, the modern GPT models can accurately solve a large variety of NLP tasks.
    • From the algorithmic perspective, most LLMs already use many advanced techniques and it becomes harder to innovate new efficient methods. That is why NLP researchers focus more on scraping and feeding more high-quality data to models. This detail explains why there is not so much difference between internal working mechanisms in first GPT models, in comparison to ChatGPT-3.5 or GPT-4. As a result, the most principled differences are usually the amount of data fed to them and the complexity of a neural network. By understanding how first GPT models work, you can automatically recognize the working concepts of more advanced models.
    Even though there might be some subtle differences in the training process between different GPT models, the aspects contributing the most to the model’s performance is the amount of data fed to it and the neural network’s complexity.

    Multitask learning

    GPT-2 is built on top of GPT-1 meaning that it has the same architecture. During training, GPT-1 uses the standard log-likelihood language modeling objective:

    GPT’s learning objective

    This expression can be thought of as an optimization of conditional probability distribution p(output | input) for a given task (in the case of GPT-1, the task consists of predicting the next token). While this approach works well for individual tasks, the model is still not able to learn to perform multiple tasks. For instance, a model trained with the aforementioned objective to predict the next token in the sequence will perform poorly on a sentiment analysis problem without proper fine-tuning.

    The GPT-2 authors proposed a novel approach for replacing the common pre-training + fine-tuning framework that would allow a trained model to perform well across different tasks. The idea consists of not modeling the standard probability p(output | input) but including task conditioning p(output | input, task) instead. There exist several approaches to incorporating task type into the model. Most of the previous methods considered this information by making changes on the architecture level. Though this approach worked well in the past, it turned out that there would be no need to modify the model’s architecture for task-type incorporation.

    The ultimate idea is that task information can be easily incorporated into the input sequence. For example:

    • If a sentence in language A needs to be translated into the language B, then the input sequence in the dataset will be written as:
    Example from the paper demonstrating input adaption for translation tasks
    • If an answer should be given to a question in a provided context, then the input sequence will take the following form:
    Example from the paper demonstrating input adaption for question answering tasks

    Surprisingly the described approach was already proven to be competitive in previous works (e.g. MQAN model)! The only main disadvantage is its slow learning speed.

    Zero-shot learning is a popular term and designates the ability of a model to perform a certain task without having explicitly received any training examples for it. GPT-2 is an example of a model having this ability.

    Dataset

    To use the idea of multitask learning from the previous section, for training, we would normally need a dataset whose objects contain task descriptions, text inputs and labels. However, in reality, the authors developed a robust framework which turns this supervised problem into an unsupervised one and does not even need task descriptions!

    The researchers conjectured that if a model was trained on a large and diverse dataset, then there would probably be a lot of language demonstration tasks in different domains that would definitely help the model to fully understand them. To validate this hypothesis, the authors designed a web scraping algorithm that collected human responses on Reddit which received at least 3 likes. Collecting all possible Reddit responses would likely have led to data quality issues and also have been too large for a model. As a result, the final dataset version includes 8M documents containing 40GB of text data in total.

    Dataset fragment containing a sentence including phrases in English and French. Such text fragments can help the model perform translation tasks. The example is taken from the paper.
    A similar example to the previous one from the paper.

    Since the collected dataset is very diverse, to better account for rare words and characters, the authors incorporated a slightly modified version of Byte-Pair Encoding (BPE) for input representations.

    Model

    According to the paper, GPT-2 has the same architecture as GPT-1 except for several changes:

    • Layer normalization was moved to the input of each Transformer block and was added to the final self-attention block.
    • Weights of residual layers are divided by √N at initialization where (N is the number of residual layers).
    • Context size is increased from 512 to 1024.
    • Batch size is augmented from 64 to 512.
    • Vocabulary size is expanded from 40,000 tokens to 50,257.

    Conclusion

    By turning a supervised problem into the unsupervised format, multitask learning helps GPT-2 to ace the performance on various downstream tasks (except for text summarization) without explicit fine-tuning. In fact, after several years, this learning framework is still constantly gaining popularity in machine learning.

    When a training dataset is sufficiently large and diverse, it allows gigantic models to enrich linguistic knowledge by simply optimizing the log-likelihood language objective. Finally, GPT-2 has become a perfect example of such a model.

    Resources

    All images are by the author unless noted otherwise.


    Large Language Models, GPT-2 — Language Models are Unsupervised Multitask Learners was originally published in Towards Data Science on Medium, where people are continuing the conversation by highlighting and responding to this story.

    Originally appeared here:
    Large Language Models, GPT-2 — Language Models are Unsupervised Multitask Learners

    Go Here to Read this Fast! Large Language Models, GPT-2 — Language Models are Unsupervised Multitask Learners

  • Building a Data Platform in 2024

    Building a Data Platform in 2024

    Dave Melillo

    How to build a modern, scalable data platform to power your analytics and data science projects (updated)

    Table of Contents:

    What’s changed?

    Since 2021, maybe a better question is what HASN’T changed?

    Stepping out of the shadow of COVID, our society has grappled with a myriad of challenges — political and social turbulence, fluctuating financial landscapes, the surge in AI advancements, and Taylor Swift emerging as the biggest star in the … *checks notes* … National Football League!?!

    Over the last three years, my life has changed as well. I’ve navigated the data challenges of various industries, lending my expertise through work and consultancy at both large corporations and nimble startups.

    Simultaneously, I’ve dedicated substantial effort to shaping my identity as a Data Educator, collaborating with some of the most renowned companies and prestigious universities globally.

    As a result, here’s a short list of what inspired me to write an amendment to my original 2021 article:

    • Scale

    Companies, big and small, are starting to reach levels of data scale previously reserved for Netflix, Uber, Spotify and other giants creating unique services with data. Simply cobbling together data pipelines and cron jobs across various applications no longer works, so there are new considerations when discussing data platforms at scale.

    • Streaming

    Although I briefly mentioned streaming in my 2021 article, you’ll see a renewed focus in the 2024 version. I’m a strong believer that data has to move at the speed of business, and the only way to truly accomplish this in modern times is through data streaming.

    • Orchestration

    I mentioned modularity as a core concept of building a modern data platform in my 2021 article, but I failed to emphasize the importance of data orchestration. This time around, I have a whole section dedicated to orchestration and why it has emerged as a natural compliment to a modern data stack.

    The Platform

    To my surprise, there is still no single vendor solution that has domain over the entire data vista, although Snowflake has been trying their best through acquisition and development efforts (Snowpipe, Snowpark, Snowplow). Databricks has also made notable improvements to their platform, specifically in the ML/AI space.

    All of the components from the 2021 articles made the cut in 2024, but even the familiar entries look a little different 3 years later:

    • Source
    • Integration
    • Data Store
    • Transformation
    • Orchestration
    • Presentation
    • Transportation
    • Observability

    Integration

    The integration category gets the biggest upgrade in 2024, splitting into three logical subcategories:

    • Batch
    • Streaming
    • Eventing

    Batch

    The ability to process incoming data signals from various sources at a daily/hourly interval is the bread and butter of any data platform.

    Fivetran still seems like the undeniable leader in the managed ETL category, but it has some stiff competition via up & comers like Airbyte and big cloud providers that have been strengthening their platform offerings.

    Over the past 3 years, Fivetran has improved its core offering significantly, extended its connector library and even started to branch out into light orchestration with features like their dbt integration.

    It’s also worth mentioning that many vendors, such as Fivetran, have merged the best of OSS and venture capital funding into something called Product Led Growth, offering free tiers in their product offering that lower the barrier to entry into enterprise grade platforms.

    Even if the problems you are solving require many custom source integrations, it makes sense to use a managed ETL provider for the bulk and custom Python code for the rest, all held together by orchestration.

    Streaming

    Kafka/Confluent is king when it comes to data streaming, but working with streaming data introduces a number of new considerations beyond topics, producers, consumers, and brokers, such as serialization, schema registries, stream processing/transformation and streaming analytics.

    Confluent is doing a good job of aggregating all of the components required for successful data streaming under one roof, but I’ll be pointing out streaming considerations throughout other layers of the data platform.

    The introduction of data streaming doesn’t inherently demand a complete overhaul of the data platform’s structure. In truth, the synergy between batch and streaming pipelines is essential for tackling the diverse challenges posed to your data platform at scale. The key to seamlessly addressing these challenges lies, unsurprisingly, in data orchestration.

    Eventing

    In many cases, the data platform itself needs to be responsible for, or at the very least inform, the generation of first party data. Many could argue that this is a job for software engineers and app developers, but I see a synergistic opportunity in allowing the people who build your data platform to also be responsible for your eventing strategy.

    I break down eventing into two categories:

    • Change Data Capture — CDC

    The basic gist of CDC is using your database’s CRUD commands as a stream of data itself. The first CDC platform I came across was an OSS project called Debezium and there are many players, big and small, vying for space in this emerging category.

    • Click Streams — Segment/Snowplow

    Building telemetry to capture customer activity on websites or applications is what I am referring to as click streams. Segment rode the click stream wave to a billion dollar acquisition, Amplitude built click streams into an entire analytical platform and Snowplow has been surging more recently with their OSS approach, demonstrating that this space is ripe for continued innovation and eventual standardization.

    AWS has been a leader in data streaming, offering templates to establish the outbox pattern and building data streaming products such as MSK, SQS, SNS, Lambdas, DynamoDB and more.

    Data Store

    Another significant change from 2021 to 2024 lies in the shift from “Data Warehouse” to “Data Store,” acknowledging the expanding database horizon, including the rise of Data Lakes.

    Viewing Data Lakes as a strategy rather than a product emphasizes their role as a staging area for structured and unstructured data, potentially interacting with Data Warehouses. Selecting the right data store solution for each aspect of the Data Lake is crucial, but the overarching technology decision involves tying together and exploring these stores to transform raw data into downstream insights.

    Distributed SQL engines like Presto , Trino and their numerous managed counterparts (Pandio, Starburst), have emerged to traverse Data Lakes, enabling users to use SQL to join diverse data across various physical locations.

    Amid the rush to keep up with generative AI and Large Language Model trends, specialized data stores like vector databases become essential. These include open-source options like Weaviate, managed solutions like Pinecone and many more.

    Transformation

    Few tools have revolutionized data engineering like dbt. Its impact has been so profound that it’s given rise to a new data role — the analytics engineer.

    dbt has become the go-to choice for organizations of all sizes seeking to automate transformations across their data platform. The introduction of dbt core, the free tier of the dbt product, has played a pivotal role in familiarizing data engineers and analysts with dbt, hastening its adoption, and fueling the swift development of new features.

    Among these features, dbt mesh stands out as particularly impressive. This innovation enables the tethering and referencing of multiple dbt projects, empowering organizations to modularize their data transformation pipelines, specifically meeting the challenges of data transformations at scale.

    Stream transformations represent a less mature area in comparison. Although there are established and reliable open-source projects like Flink, which has been in existence since 2011, their impact hasn’t resonated as strongly as tools dealing with “at rest” data, such as dbt. However, with the increasing accessibility of streaming data and the ongoing evolution of computing resources, there’s a growing imperative to advance the stream transformations space.

    In my view, the future of widespread adoption in this domain depends on technologies like Flink SQL or emerging managed services from providers like Confluent, Decodable, Ververica, and Aiven. These solutions empower analysts to leverage a familiar language, such as SQL, and apply those concepts to real-time, streaming data.

    Orchestration

    Reviewing the Ingestion, Data Store, and Transformation components of constructing a data platform in 2024 highlights the daunting challenge of choosing between a multitude of tools, technologies, and solutions.

    From my experience, the key to finding the right iteration for your scenario is through experimentation, allowing you to swap out different components until you achieve the desired outcome.

    Data orchestration has become crucial in facilitating this experimentation during the initial phases of building a data platform. It not only streamlines the process but also offers scalable options to align with the trajectory of any business.

    Orchestration is commonly executed through Directed Acyclic Graphs (DAGs) or code that structures hierarchies, dependencies, and pipelines of tasks across multiple systems. Simultaneously, it manages and scales the resources utilized to run these tasks.

    Airflow remains the go-to solution for data orchestration, available in various managed flavors such as MWAA, Astronomer, and inspiring spin-off branches like Prefect and Dagster.

    Without an orchestration engine, the ability to modularize your data platform and unlock its full potential is limited. Additionally, it serves as a prerequisite for initiating a data observability and governance strategy, playing a pivotal role in the success of the entire data platform.

    Presentation

    Surprisingly, traditional data visualization platforms like Tableau, PowerBI, Looker, and Qlik continue to dominate the field. While data visualization witnessed rapid growth initially, the space has experienced relative stagnation over the past decade. An exception to this trend is Microsoft, with commendable efforts towards relevance and innovation, exemplified by products like PowerBI Service.

    Emerging data visualization platforms like Sigma and Superset feel like the natural bridge to the future. They enable on-the-fly, resource-efficient transformations alongside world-class data visualization capabilities. However, a potent newcomer, Streamlit, has the potential to redefine everything.

    Streamlit, a powerful Python library for building front-end interfaces to Python code, has carved out a valuable niche in the presentation layer. While the technical learning curve is steeper compared to drag-and-drop tools like PowerBI and Tableau, Streamlit offers endless possibilities, including interactive design elements, dynamic slicing, content display, and custom navigation and branding.

    Streamlit has been so impressive that Snowflake acquired the company for nearly $1B in 2022. How Snowflake integrates Streamlit into its suite of offerings will likely shape the future of both Snowflake and data visualization as a whole.

    Transportation

    Transportation, Reverse ETL, or data activation — the final leg of the data platform — represents the crucial stage where the platform’s transformations and insights loop back into source systems and applications, truly impacting business operations.

    Currently, Hightouch stands out as a leader in this domain. Their robust core offering seamlessly integrates data warehouses with data-hungry applications. Notably, their strategic partnerships with Snowflake and dbt emphasize a commitment to being recognized as a versatile data tool, distinguishing them from mere marketing and sales widgets.

    The future of the transportation layer seems destined to intersect with APIs, creating a scenario where API endpoints generated via SQL queries become as common as exporting .csv files to share query results. While this transformation is anticipated, there are few vendors exploring the commoditization of this space.

    Observability

    Similar to data orchestration, data observability has emerged as a necessity to capture and track all the metadata produced by different components of a data platform. This metadata is then utilized to manage, monitor, and foster the growth of the platform.

    Many organizations address data observability by constructing internal dashboards or relying on a single point of failure, such as the data orchestration pipeline, for observation. While this approach may suffice for basic monitoring, it falls short in solving more intricate logical observability challenges, like lineage tracking.

    Enter DataHub, a popular open-source project gaining significant traction. Its managed service counterpart, Acryl, has further amplified its impact. DataHub excels at consolidating metadata exhaust from various applications involved in data movement across an organization. It seamlessly ties this information together, allowing users to trace KPIs on a dashboard back to the originating data pipeline and every step in between.

    Monte Carlo and Great Expectations serve a similar observability role in the data platform but with a more opinionated approach. The growing popularity of terms like “end-to-end data lineage” and “data contracts” suggests an imminent surge in this category. We can expect significant growth from both established leaders and innovative newcomers, poised to revolutionize the outlook of data observability.

    Closing

    The 2021 version of this article is 1,278 words.

    The 2024 version of this article is well ahead of 2K words before this closing.

    I guess that means I should keep it short.

    Building a platform that is fast enough to meet the needs of today and flexible enough to grow to the demands of tomorrow starts with modularity and is enabled by orchestration. In order to adopt the most innovative solution for your specific problem, your platform must make room for data solutions of all shapes in sizes, whether it’s an OSS project, a new managed service or a suite of products from AWS.

    There are many ideas in this article but ultimately the choice is yours. I’m eager to hear how this inspires people to explore new possibilities and create new ways of solving problems with data.

    Note: I’m not currently affiliated with or employed by any of the companies mentioned in this post, and this post isn’t sponsored by any of these tools.


    Building a Data Platform in 2024 was originally published in Towards Data Science on Medium, where people are continuing the conversation by highlighting and responding to this story.

    Originally appeared here:
    Building a Data Platform in 2024

    Go Here to Read this Fast! Building a Data Platform in 2024

  • Build an internal SaaS service with cost and usage tracking for foundation models on Amazon Bedrock

    Build an internal SaaS service with cost and usage tracking for foundation models on Amazon Bedrock

    Hasan Poonawala

    In this post, we show you how to build an internal SaaS layer to access foundation models with Amazon Bedrock in a multi-tenant (team) architecture. We specifically focus on usage and cost tracking per tenant and also controls such as usage throttling per tenant. We describe how the solution and Amazon Bedrock consumption plans map to the general SaaS journey framework. The code for the solution and an AWS Cloud Development Kit (AWS CDK) template is available in the GitHub repository.

    Originally appeared here:
    Build an internal SaaS service with cost and usage tracking for foundation models on Amazon Bedrock

    Go Here to Read this Fast! Build an internal SaaS service with cost and usage tracking for foundation models on Amazon Bedrock

  • Navigating Data in Datathons: Insights and Guidelines at Neural Information Processing Systems…

    Navigating Data in Datathons: Insights and Guidelines at Neural Information Processing Systems…

    Carlos Mougan

    Navigating Data in Datathons: Insights and Guidelines [NeurIPS’23]

    How to data in datathons

    What is a datathon?

    Datathons or data hackathons, loosely defined as data or data science-centric hackathons, have become increasingly popular in recent years, providing a platform for participants and organisations to collaborate, innovate, and learn in the area of data science over a short timeframe.

    These events challenge participants to tackle data-related problems within a constrained timeframe, necessitating an understanding of data science and an acute awareness of the data being used.

    What is the problem?

    Datathons, high-energy events where data science and machine learning practicioners come together to solve pressing problems, are as much about innovation as they are about the effective handling of data.

    Despite the significant and potential benefits of datathons, organizations often struggle to work with data effectively due to a lack of clear guidelines and best practices for potential issues that might arise.

    What is the goal of this blog?

    This blog post, written out of a Neural Information Processing Systems Conference 2023 paper on How to Data in Datathons,” dives into critical aspects of preparing and selecting data for datathons, addressing:

    — What does it mean for data to be appropriate for a datathon?

    — How much data is enough data?

    — How can we identify, categorise, and use sensitive data?

    — Is the data analysis ready?

    — Is the data reliable?

    This framework is drawn from The Alan Turing Institute’s experiences and insights from organizing 80+ datathon challenges with 60+ partnership organizations since 2016!!

    It aims to offer a set of guidelines and recommendations to prepare different data types for datathons drawn from extensive experience in datathon organisation. If interested, consider participating in one of the Data Study Group events as a participant or as a challenge owner; more info [here]

    A picture of the Applied Skills Team of the Alan Turing Institute, May 2023.

    Assessing Data in Datathons

    Data Assessment Matrix. Extracted from “How to Data in Datathons” #NeurIPS23

    When it comes to datathons, not just any data will do. The data needs to be ‘appropriate,’ ‘sufficient,’ and sensitive to privacy concerns. Organizers and participants often grapple with questions like: What makes data suitable for a datathon? How much data is considered enough? How do we handle sensitive data? Each dimension is crucial for ensuring the data used in datathons is suitable, ethical, and conducive to achieving the event’s objectives. Let’s dive into these aspects one by one.

    1. Data Appropriateness

    The appropriateness of data concerns its relevance and utility in addressing the datathon’s specific challenge questions. This dimension evaluates whether the data provided aligns with the objectives of the datathon, ensuring that participants have the right kind of data to work with.

    • Insufficient: The data has no apparent connection to the datathon’s goals, making it impossible for participants to use it effectively. For instance, providing weather data for a challenge focused on financial forecasting is entirely off-mark.
    • Developing: While the data is somewhat related to the challenge, it lacks critical elements or target variables necessary for a comprehensive analysis or solution development.
    • Functional: The data is relevant and can be directly applied to the challenge. However, there are opportunities for enhancing its value through the inclusion of additional variables or more detailed metadata that could provide deeper insights.
    • Optimal: The provided data perfectly matches the challenge requirements, including a rich set of features, relevant target variables, and comprehensive metadata. This level represents an ideal scenario where participants have access to all necessary information for analysis and solution development.

    2. Data Readiness

    Readiness assesses the condition of the data regarding its preparation for immediate analysis. It involves factors such as data cleanliness, completeness, structure, and accessibility, which significantly impact the efficiency of the datathon.

    • Insufficient: Data is either not collected or so poorly organized that significant effort is required to make it usable. This scenario poses a severe limitation on what can be achieved during the datathon timeframe.
    • Developing: Data has been collected, but it may be incomplete, inconsistently formatted, or lacking in documentation, necessitating preliminary work before meaningful analysis can begin.
    • Functional: While the data requires some cleaning or preprocessing, it is largely in a state that allows for analysis. Minor efforts may be needed to consolidate data sources or format data correctly.
    • Optimal: Data is in an analysis-ready state, being well-documented, clean, and structured. Participants can focus on applying data science techniques rather than on data preparation tasks.

    3. Data Reliability

    Reliability pertains to the accuracy and bias in the data. It questions the extent to which data can be considered a truthful representation of the phenomena or population it is supposed to depict.

    • Insufficient: The data is heavily biased or contains significant errors that could lead to misleading conclusions. Such data might misrepresent certain groups or phenomena, skewing analysis results.
    • Developing: The reliability of the data is uncertain due to unknown sources of bias or potential errors in data collection and recording. This status calls for caution in interpretation and may limit the confidence in the outcomes.
    • Functional: Known biases or issues exist but can be addressed through careful analysis or acknowledged as limitations of the study. This level of reliability requires transparency about the data’s limitations.
    • Optimal: The data is considered highly reliable, with no known significant biases or errors. It accurately represents the target phenomena, allowing for confident and robust analysis.

    4. Data Sensitivity

    Sensitivity deals with the data’s privacy, confidentiality, and ethical considerations. It evaluates the level of risk associated with using and sharing the data, particularly concerning personal or proprietary information.

    • Insufficient (Tier 4): Data is highly sensitive, posing significant legal, ethical, or personal risks. Such data is typically not suitable for datathons due to the high potential for misuse or harm.
    • Developing (Tier 3): While not as critically sensitive, the data still requires stringent measures to protect privacy and confidentiality, possibly limiting its usability in a freely collaborative environment like a datathon.
    • Functional (Tier 2): Data sensitivity is managed through de-identification or other safeguards, but attention to data protection remains important. Participants must be mindful of privacy considerations during their analysis.
    • Optimal (Tier 0/1): The data presents minimal sensitivity risks, allowing for more straightforward sharing and analysis. This level is ideal for fostering open collaboration without compromising privacy or ethical standards.

    5. Sufficiency

    Sufficiency evaluates whether the amount and type of data provided are adequate to address the challenge questions effectively. It considers the volume, variety, and granularity of the data in relation to the datathon’s goals.

    • Insufficient: The data volume or diversity is too limited to allow for meaningful analysis or to draw reliable conclusions. Such insufficiency can severely hamper the success of the datathon.
    • Developing: Although some data is available, its quantity or quality may not be sufficient to explore the challenge questions fully or to build robust models. Participants may find it challenging to achieve significant insights.
    • Functional: The data provided is adequate to engage with the challenge questions meaningfully. While not exhaustive, it enables participants to derive useful insights and propose viable solutions.
    • Optimal: The data is abundant and varied, exceeding the basic requirements for the datathon. This level provides a rich playground for participants to explore innovative solutions and conduct thorough analyses.

    Insights and Reccomendations

    Data Study Groups (DSGs) are an award-winning collaborative datathon event organised by The Alan Turing Institute, the UK’s national institute for data science and artificial intelligence. ADSGs consist on a datathons that is worked collaboratively by a single team (rather than multiple teams competing with each other). The aim of DSGs is to provide opportunities for organisations and participants from academia and industry to work together to solve real-world challenges using data science and ML methodologies. The DSGs are managed and prepared by a specialised internal team of event organisers and interdisciplinary academic support staff. More info [here]

    A successful datathon is the result of preparation, flexibility, and the collective effort of organizers, challenge owners, and participants. We outline the following reccomendations.

    Before the Event: Collaborate and Align

    The groundwork for a successful datathon is laid well before the event. Early engagement with challenge owners (business partners) is crucial. Their domain expertise and understanding of the data can significantly shape the event’s direction and outcomes. Their understanding of the problem and domain expertise can greatly improve the data, and early collaboration helps align the objectives and expectations on both sides, increasing the likelihood of a fruitful event.

    As the datathon approaches, it is beneficial to do sanity checks on data readiness and consider changing the challenge questions based on input from an experience investigator that is able to align the industry requirements and the research requirements taking into consideration the perspective of participants.

    During the Datathon: Adapt and Engage

    The live event is where planning meets reality. PIs play a crucial role in guiding participants through data challenges and ensuring the objectives are met. Additionally, participant feedback is a goldmine. Their fresh eyes on the data can uncover new insights or identify areas for improvement, making the datathon a dynamic environment where adjustments are not just possible but encouraged.

    Interested in real use cases? In the proceedings paper, we mapped 10 use cases to our framework.

    1. Cefas: Centre for Environment, Fisheries and Aquaculture Science
    2. The University of Sheffield Advanced Manufacturing Research Centre: Multi-sensor-based Intelligent Machining Process Monitoring
    3. CityMaaS: Making Travel for People in Cities Accessible through Prediction and Personalisation
    4. WWF: Smart Monitoring for Conservation Areas
    5. British Antarctic Survey: Seals from Space
    6. DWP: Department for Work and Pension
    7. Dementia Research Institute and DEMON Network: Predicting Functional Relationship between DNA Sequence and the Epigenetic State
    8. Automating Perfusion Assessment of Sublingual Microcirculation in Critical Illness
    9. Entale: Recommendation Systems for Podcast Discovery
    10. Odin Vision: Exploring AI-Supported Decision-Making for Early-Stage Diagnosis of Colorectal Cancer

    The full reports, along with the outcome of other Data Study Groups, can be found at [Reports Section]

    Report count data assessment classification of the last 10 DSG reports

    Conclusion

    In this paper, we have analysed data in the context of datathons along five key dimensions: appropriateness, readiness, reliability, sensitivity and sufficiency, drawn from organizing 80+ datathons since 2016. By doing so, we hope to improve the handling of data for organisations prior to datathon events.

    Our proposed qualitative analysis provides a degree of data status across several perspectives; these degrees can be adapted or extended, similar to the Technology Readiness Levels provided by NASA, which have been extended through time and further work.

    Bibtex Citation:

    @inproceedings{
    mougan2023how,
    title={How to Data in Datathons},
    author={Carlos Mougan and Richard Plant and Clare Teng and Marya Bazzi and Alvaro Cabrejas-Egea and Ryan Sze-Yin Chan and David Salvador Jasin and martin stoffel and Kirstie Jane Whitaker and JULES MANSER},
    booktitle={Thirty-seventh Conference on Neural Information Processing Systems Datasets and Benchmarks Track},
    year={2023},
    url={https://openreview.net/forum?id=bjvRVA2ihO}
    }

    Mougan, C., Plant, R., Teng, C., Bazzi, M., Cabrejas-Egea, A., Chan, R. S.-Y., Jasin, D. S., Stoffel, M., Whitaker, K. J., & Manser, J. (2023). How to data in datathons. In Thirty-seventh Conference on Neural Information Processing Systems Datasets and Benchmarks Track.

    A picture of me (Carlos Mougan) at the Alan Turing Institute. (All images are provided by the author and used with permission)


    Navigating Data in Datathons: Insights and Guidelines at Neural Information Processing Systems… was originally published in Towards Data Science on Medium, where people are continuing the conversation by highlighting and responding to this story.

    Originally appeared here:
    Navigating Data in Datathons: Insights and Guidelines at Neural Information Processing Systems…

    Go Here to Read this Fast! Navigating Data in Datathons: Insights and Guidelines at Neural Information Processing Systems…