
The Untapped Potential of Neuron-State Data

Have you ever wondered if there’s a better way to spot what doesn’t belong in a set of image data?
Traditional methods have their place, but what if the key to a more refined approach lies within the model itself — specifically, in the state of its neurons?
Could these neural states offer a new perspective on detecting anomalies, providing us with insights we’ve previously overlooked?
Let’s find out!
I performed this project freshly graduated, stepping into a big company for the first time. I was honestly a bit scared. This was my first real test in the professional world. But as the project moved from concept to success, I realized that I had the skills and, more importantly, the ability to learn and adapt.
I genuinely had fun performing this project and I was extremely curious to discover the outcomes of this new method that was still just a scattered idea before its implementation.
Just a heads-up: what I’m about to dive into in this post isn’t the whole end-to-end of a machine learning project. Think of it more as a sneak peek into the early, experimental side of things — where one plays around with ideas and see what sticks. But I promise it comes with interesting results!
The essence of this task? To pilot a novel approach for anomaly detection in image pixel data, leveraging the state of neurons within an Artificial Neural Network (ANN) already in training.
Why and How to Explore Neuron States in Anomaly Detection?
Picture it: diving into the state of those neurons might be the key to a game-changing approach in anomaly detection.
In this project the aim is to test and compare two distinct methods. What’s the twist? The novel approach differentiates itself on the input data fed into the models.
The Methods
The first approach, the usual one, takes in the standard image (pixel) data from the MNIST dataset and is given to an ANN and then to an Isolation Forest model. Pretty straightforward. But here’s where things get intriguing.
In the new method, instead of feeding pixel data into those two models, we’re ingesting model-state data by leveraging the state of the neurons of the MNIST 10-digit ANN classifier.
What does that even mean? you are wondering. First, we train a simple ANN with MNIST pixel data, both with normal and anomalous data to simulate anomalies. Then, we peek into the inner workings of this ANN, accessing the state of the neurons on the first and second layers. In this post, I will call this that data “model-state data” . We then feed this unique input into an Isolation Forest model and another ANN, sparking a whole new level of analysis.
The main goal? To pinpoint which anomalies each strategy is great at detecting and to find out if one method is better ate detecting certain types of anomalies that the other is not able to.
But wait, there’s more. With this new method, we’re also on a quest to determine which layer of model-state data is the best at predicting anomalies.
The Data
MNIST Pixel Data
The first dataset employed here is the usual MNIST pixel data, comprised by hand-written numbers. Here, the background is black and the digits are white.

Anomalous MNIST Pixel Data
To test the new procedure and compare it to the usual one, I created four simple types of anomalous data.
The goal was to test each method’s detection capabilities across a small spectrum of noise variations, incrementally intensified from one anomaly type to the next.
The noise rate increases from the first to the fourth type of anomalous data. As you can see in the figure below, in the first and second types of data, the noise is not even detectable to the naked eye, while in the third type, you can already spot some white pixels.

Model-state data
While MNIST pixel data, with its hand-written digits against a stark backdrop, provides a classic foundation for anomaly detection, we’re trying something else. It’s a bit of a leap, taking us right into the core of the trained ANN to see what the neurons are up to. This could give us a whole new angle on spotting anomalies.
As mentioned, this model state data is comprised by the state of the neurons in an ANN when trained with MNIST data. As such, to generate this data, we start with training a simple ANN with MNIST pixel data, both with normal and anomalous data (the anomalous are comprised by the noisy data showed before in Figure 2).
We then perform the usual: split the data into training and testing, and then we fit the ANN model:
model.fit(X_train,Y_cat_train,epochs=8, validation_data=(X_test, y_cat_test))
After that, we want to retrieve the names of the layers in model and store them in a list:
list(map(lambda x: x.name, model.layers))
Finally, we create a new model that takes the same input as the original model but produces output from a specific layer called “dense”:
intermediate_layer_model=Model(inputs=model.input, outputs=model.get_layer("dense").output)
This is useful for extracting information from intermediate layers of a neural network.
Let’s take a look at this model-state data:
model_state_data_layer1=pd.read_csv("first_layer_dense.csv",header=None)
model_state_data_layer2=pd.read_csv("second_layer_dense.csv",header=None)

model_state_data_layer1.head(4)

The model-state data of the first neural layer is comprised by 32 columns and 4 rows.
With just a few lines of code, we are able to extract data from the intermediate layers of a neural network.
To study the effectiveness of the new method, I’ll be using data from both the first and second layers of the neural network.
The two models
As mentioned, the goal is to compare the anomaly detection task using two different input datasets across two different models: an ANN classifier and an Isolation Forest model. This comparison seeks to understand how each model performs with different types of input data in identifying anomalies.
The ANN:
An Artificial Neural Network (ANN) is a model inspired by the human brain’s network of neurons, designed to recognize patterns and process data in a manner similar to the way a human brain operates.
from tensorflow.keras.models import Sequential
from tensorflow.keras.layers import Dense, Dropout
from tensorflow.keras.optimizers import SGD

model = Sequential()
model.add(Dense(X_train.shape[1], input_shape=(784,), activation='relu'))
model.add(Dropout(0.2))
model.add(Dense(1, activation='sigmoid'))
model.compile(loss="binary_crossentropy", optimizer='adam', metrics=["accuracy"])

The Isolation Forest:
from sklearn.ensemble import IsolationForest

model = IsolationForest(max_samples=100, contamination=0.01)
model.fit(X_train)
Isolation forest is an unsupervised machine learning model for data anomaly detection. It employs binary trees to detect anomalies and, contrary to a Random Forest model, the selection of the splitting points of each branch is done randomly. This random splitting is efficient to isolate anomalies from normal observations. Since anomalies are few and different, they’re easier to separate with fewer random splits compared to normal data.
The second code line creates an instance of the IsolationForest class, setting max_samples to 100 which determines the number of samples to draw from X to train each base estimator, and contamination to 0.01 which is the expected proportion of outliers in the data.
print(model.get_params())

In this project, the aim was to assess the efficacy of anomaly detection by utilizing two distinct datasets across two models: a straightforward Artificial Neural Network (ANN) and the Isolation Forest model. This comparison seeks to understand how each model performs with different types of input data in identifying anomalies.
Results
- ANN Results
Inspecting True Positives
Both datasets are fed into an ANN.
First, let’s inspect the percentage of anomalies that both methods were able to detect:

Figure 6 shows the results when feeding an ANN with pixel data. The y-axis represents the anomaly score, in which data points with a threshold > 0.45 are considered anomalies. The different anomaly types are depicted in the plot with different colors.


Figure 7 showcases the detection capabilities of the model-state method across two different neural layers, providing insights into how each layer’s data influences anomaly detection results.
Inspecting the left plot concerning the first layer, we can see that the new method detects more true positives (anomalies) regarding type 3 than the usual approach with the pixel data (Figure 6). The second layer is not useful at all, only predicting some anomalies of type 1.
However, it predicts anomalies of type 3 with low confidence, when compared to the pixel data method. Besides, the first layer does not predict well the anomalies of type 1,2 and 4. Interestingly, anomalies of types 1 and 4 represent the least and most noisy data, respectively.
Also curious to note is the statistical distribution of the data in the plots. In the normal data approach, the predictions are more scattered, and in the model-state one it is almost the opposite scenario.
Inspecting False Positives
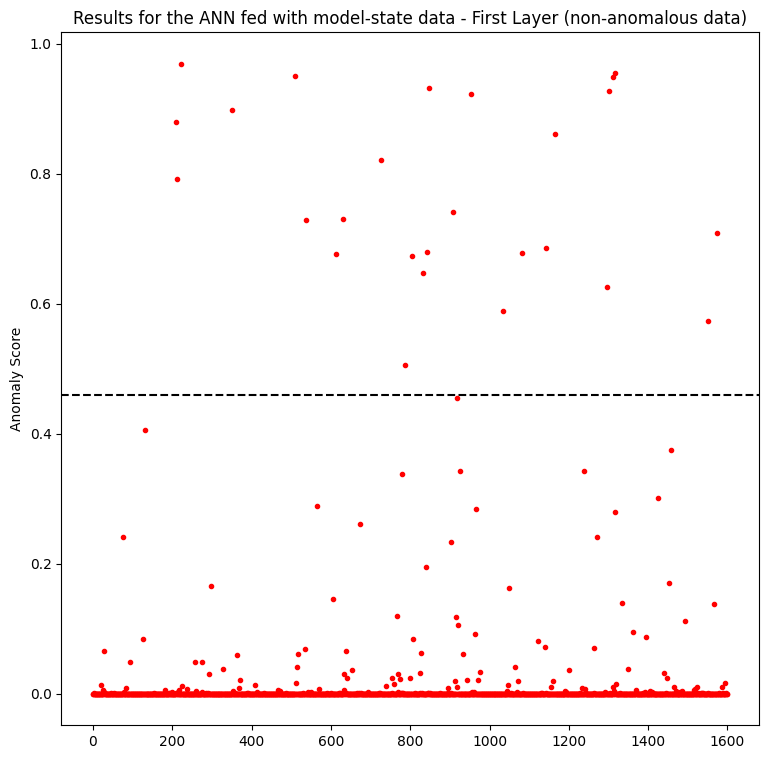

In anomaly detection tasks, achieving a balance between precision and recall is crucial. Recall, in the context of anomaly detection, represents the ability of the model to correctly identify all actual anomalies in the dataset.
However, it’s often important to prioritize precision over recall in these tasks. This is because false positives (instances where normal data is wrongly classified as anomalous) can have significant consequences, such as triggering unnecessary alarms or interventions. In situations where it is risky to have a high rate of false positives, maintaining a low recall helps minimize the number of false alarms.
It is clear from the plots that the model-state approach performs much better on detecting true negatives, with the obvious benefit of discerning false positives. In this case, the first layer outperforms the second one:
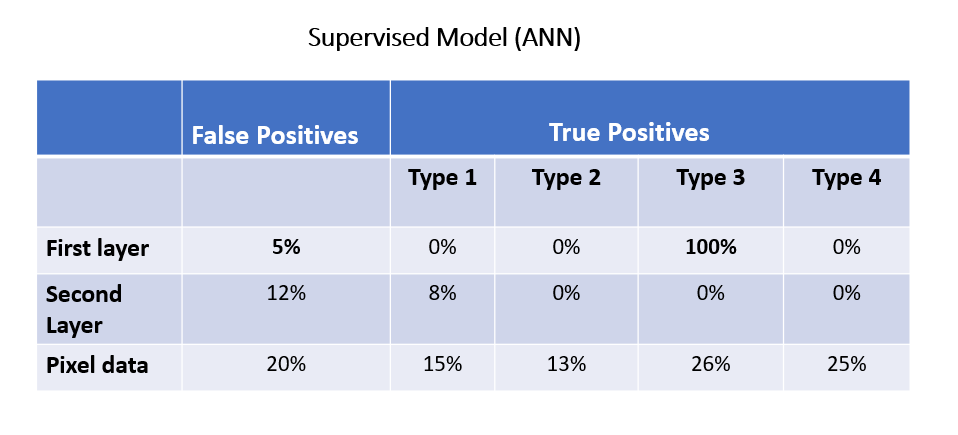
The model-state data of the first layer outperforms the second layer and pixel data in detecting types 2 and 3 anomalies and in identifying false positives. However, normal data still exhibits better performance in detecting types 1 and 4 anomalies.
2. Isolation Forest Results
Inspecting True Positives
Isolation forest computes a negative anomaly score, in which the smaller (more negative) the score, the more anomalous the data point is considered to be. We considered a threshold of < -0.45 to be considered anomalous.

The isolation forest model when fed with pixel data, predicted 54% of the anomalous data of type 1 and predicted no anomalies of the other types.
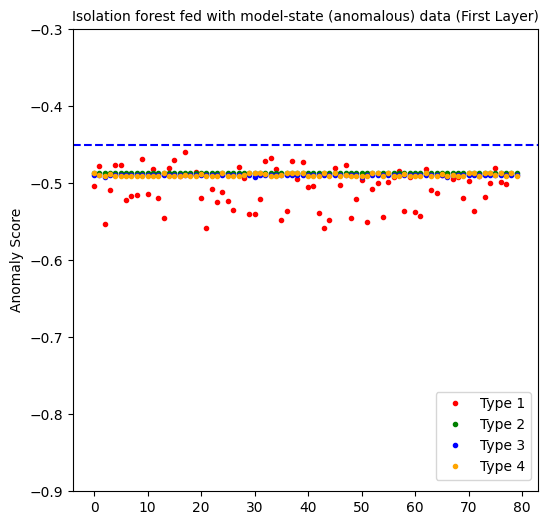

The first layer perfectly predicts all the anomalous data points. But as you will sew below, it also generates a 100% false positive rate. At the end, it is not an effective approach.
The second layer yields interesting results. With 100% of true positives for the second, third and fourth type of noisy types, it sounds promising on detecting certain kinds of anomalous data. The only downside is predicting 19% of anomalous data points for the 1st type of noisy data. But not that these are the hardest anomalies to detect, given that the noise ratio is the lowest!
Inspecting False Positives
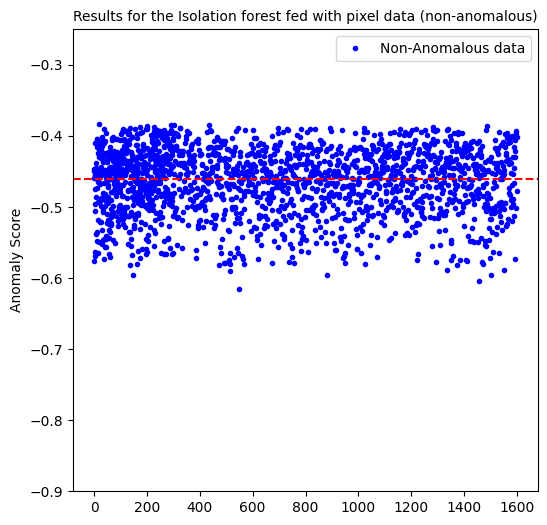
Here, the percentage of false positives is 50%. As good as flipping a coin!

Inspecting how model-state data from different layers behave in predicting non-anomalous data, we see that the first layer predicted 100% of false positives whereas the second layer only 1%.

When fed with the usual pixel data, we are only able to predict 54% of anomalies of type 1 and besides, we are left with a false positive percentage of 50%.
On the other hand, the procedure employing model-state yields curious results especially regarding the second layer.
Wrapping-up
In conclusion, the results obtained from comparing the anomaly detection performance of an ANN and an Isolation Forest model using two different input data types provide valuable insights.
Even though this project was a preliminary experiment, I believe it underscores the importance of trying new strategies in detecting anomalies.
- The ANN, when trained with model-state data representing the state of neurons, showed improved performance in detecting certain types of anomalies compared to the traditional procedure using pixel data. More specifically, the model-state data from the first layer of neurons showed promising results in identifying a certain type of anomaly with a low false positive rate.
A potential possibility for future exploration could be combining both methods within the ANN framework — utilizing normal data to capture certain anomalies and model-state data to detect others.
- The Isolation Forest, being an unsupervised model, faced some challenges in effectively detecting anomalies when fed with model-state data of the first layer. This layer showed high accuracy in identifying anomalous samples and it also produced a high rate of false positives, making it less suitable for this task. However, the second layer of neurons in the Isolation forest model showcased a better performance than the usual method, particularly in detecting anomaly types 2, 3 and 4 with minimal false positives, despite facing challenges in identifying the anomalies with lowest noise ratio.
Conclusion
This project not only contributed to the understanding of anomaly detection methodologies but also underscored the importance of exploring innovative approaches, such as utilizing the state of neurons, to enhance the performance of anomaly detection models!
Another thing this project taught me. As mentioned, it was my very first experience at a real company and I was scared of messing up. Either if you are a beginner or an experienced data scientist, if you’re feeling unsure about taking on a project because it seems daunting or you doubt your skills, remember that success in these projects isn’t just about what you already know; it’s about your willingness to learn and push through the fear. So, go for it!
What are your thoughts on utilizing neuron states for anomaly detection?
Thanks a million for reading.
References
My name is Sara Nóbrega and I am an R&D Engineer focused on Data Science, with a background in physics and astrophysics. I’m an enthusiast on AI, smart cities, sustainability, cosmology and human rights.
An Exploration of Model-State Data in Anomaly Detection was originally published in Towards Data Science on Medium, where people are continuing the conversation by highlighting and responding to this story.
Originally appeared here:
An Exploration of Model-State Data in Anomaly Detection
Go Here to Read this Fast! An Exploration of Model-State Data in Anomaly Detection
