All You Need to Know About the Non-Inferiority Hypothesis Test
A non-inferiority test statistically proves that a new treatment is not worse than the standard by more than a clinically acceptable margin

While working on a recent problem, I encountered a familiar challenge — “How can we determine if a new treatment or intervention is at least as effective as a standard treatment?” At first glance, the solution seemed straightforward — just compare their averages, right? But as I dug deeper, I realised it wasn’t that simple. In many cases, the goal isn’t to prove that the new treatment is better, but to show that it’s not worse by more than a predefined margin.
This is where non-inferiority tests come into play. These tests allow us to demonstrate that the new treatment or method is “not worse” than the control by more than a small, acceptable amount. Let’s take a deep dive into how to perform this test and, most importantly, how to interpret it under different scenarios.
The Concept of Non-Inferiority Testing
In non-inferiority testing, we’re not trying to prove that the new treatment is better than the existing one. Instead, we’re looking to show that the new treatment is not unacceptably worse. The threshold for what constitutes “unacceptably worse” is known as the non-inferiority margin (Δ). For example, if Δ=5, the new treatment can be up to 5 units worse than the standard treatment, and we’d still consider it acceptable.
This type of analysis is particularly useful when the new treatment might have other advantages, such as being cheaper, safer, or easier to administer.
Formulating the Hypotheses
Every non-inferiority test starts with formulating two hypotheses:
- Null Hypothesis (H0): The new treatment is worse than the standard treatment by more than the non-inferiority margin Δ.
- Alternative Hypothesis (H1): The new treatment is not worse than the standard treatment by more than Δ.
When Higher Values Are Better:
For example, when we are measuring something like drug efficacy, where higher values are better, the hypotheses would be:
- H0: The new treatment is worse than the standard treatment by at least Δ (i.e., μnew − μcontrol ≤ −Δ).
- H1: The new treatment is not worse than the standard treatment by more than Δ (i.e., μnew − μcontrol > −Δ).
When Lower Values Are Better:
On the other hand, when lower values are better, like when we are measuring side effects or error rates, the hypotheses are reversed:
- H0: The new treatment is worse than the standard treatment by at least Δ (i.e., μnew − μcontrol ≥ Δ).
- H1: The new treatment is not worse than the standard treatment by more than Δ (i.e., μnew − μcontrol < Δ).
Z-Statistic
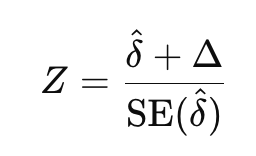
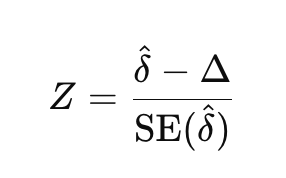
To perform a non-inferiority test, we calculate the Z-statistic, which measures how far the observed difference between treatments is from the non-inferiority margin. Depending on whether higher or lower values are better, the formula for the Z-statistic will differ.
- When higher values are better:

- When lower values are better:

where δ is the observed difference in means between the new and standard treatments, and SE(δ) is the standard error of that difference.
Calculating P-Values
The p-value tells us whether the observed difference between the new treatment and the control is statistically significant in the context of the non-inferiority margin. Here’s how it works in different scenarios:
- When higher values are better, we calculate
p = 1 − P(Z ≤ calculated Z)
as we are testing if the new treatment is not worse than the control (one-sided upper-tail test). - When lower values are better, we calculate
p = P(Z ≤ calculated Z)
since we are testing whether the new treatment has lower (better) values than the control (one-sided lower-tail test).
Understanding Confidence Intervals
Along with the p-value, confidence intervals provide another key way to interpret the results of a non-inferiority test.
- When higher values are preferred, we focus on the lower bound of the confidence interval. If it’s greater than −Δ, we conclude non-inferiority.
- When lower values are preferred, we focus on the upper bound of the confidence interval. If it’s less than Δ, we conclude non-inferiority.

The confidence interval is calculated using the formula:
- when higher values preferred

- when lower values preferred

Calculating the Standard Error (SE)
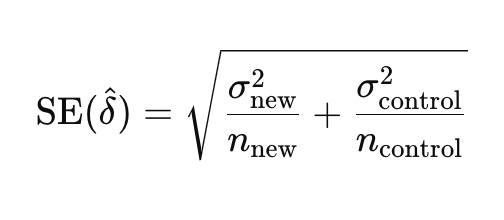
The standard error (SE) measures the variability or precision of the estimated difference between the means of two groups, typically the new treatment and the control. It is a critical component in the calculation of the Z-statistic and the confidence interval in non-inferiority testing.
To calculate the standard error for the difference in means between two independent groups, we use the following formula:
- between two means

- between two proportions

Where:
- σ_new and σ_control are the standard deviations of the new and control groups.
- p_new and p_control are the proportion of success of the new and control groups.
- n_new and n_control are the sample sizes of the new and control groups.
The Role of Alpha (α)
In hypothesis testing, α (the significance level) determines the threshold for rejecting the null hypothesis. For most non-inferiority tests, α=0.05 (5% significance level) is used.
- A one-sided test with α=0.05 corresponds to a critical Z-value of 1.645. This value is crucial in determining whether to reject the null hypothesis.
- The confidence interval is also based on this Z-value. For a 95% confidence interval, we use 1.645 as the multiplier in the confidence interval formula.
In simple terms, if your Z-statistic is greater than 1.645 for higher values, or less than -1.645 for lower values, and the confidence interval bounds support non-inferiority, then you can confidently reject the null hypothesis and conclude that the new treatment is non-inferior.
Interpretation
Let’s break down the interpretation of the Z-statistic and confidence intervals across four key scenarios, based on whether higher or lower values are preferred and whether the Z-statistic is positive or negative.
Here’s a 2×2 framework:

Conclusion
Non-inferiority tests are invaluable when you want to demonstrate that a new treatment is not significantly worse than an existing one. Understanding the nuances of Z-statistics, p-values, confidence intervals, and the role of α will help you confidently interpret your results. Whether higher or lower values are preferred, the framework we’ve discussed ensures that you can make clear, evidence-based conclusions about the effectiveness of your new treatment.
Now that you’re equipped with the knowledge of how to perform and interpret non-inferiority tests, you can apply these techniques to a wide range of real-world problems.
Happy testing!
Note: All images, unless otherwise noted, are by the author.
All you need to know about Non-Inferiority Hypothesis Test was originally published in Towards Data Science on Medium, where people are continuing the conversation by highlighting and responding to this story.
Originally appeared here:
All you need to know about Non-Inferiority Hypothesis Test
Go Here to Read this Fast! All you need to know about Non-Inferiority Hypothesis Test
