The Battle for Access: Overcoming (Unintended) Data Jails
Even when you can see the data, it might be completely useless.

Better data beats clever algorithms, but more data beats better data.
— Peter Norvig
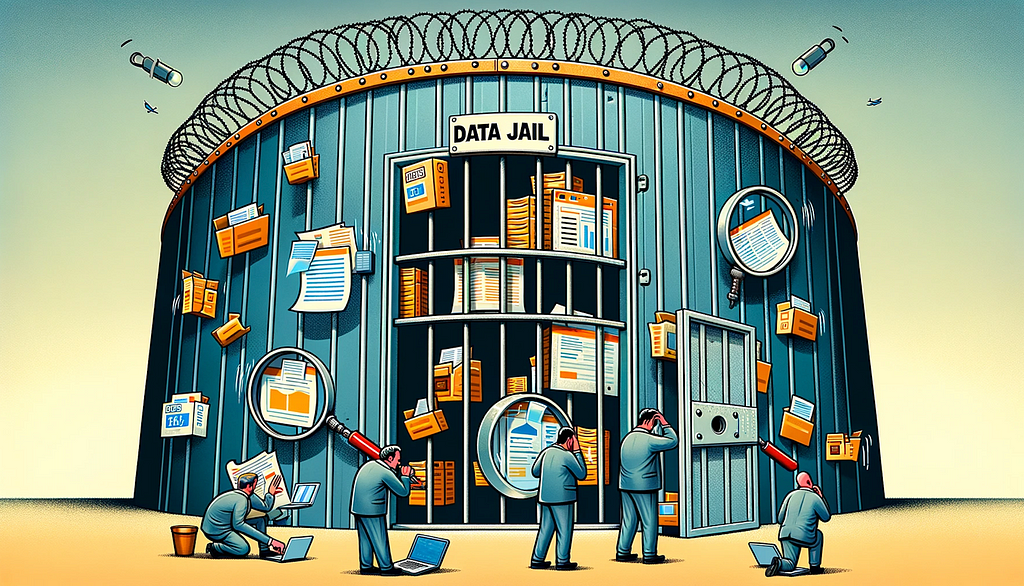
I built a thing. It was fun, and I think it brought (or hopefully will bring) value. But it came at an expense which I’ve become all too familiar with in my industry. It shouldn’t be (and doesn’t have to be) the norm that data is difficult to access. I refer to this as Data Jail. It’s easy to get data in, hard to get it back out. And many cases, the proverbial bars of the data jail are transparent. You don’t know it’s hard to get to until you need to.
Defining ‘Data Jail’
Let me start by making sure we’re all clear on what I mean by Data Jail. Essentially, Data Jail describes a scenario where data, despite being technically available, is confined within formats that hinder easy access, analysis, and effective usage. Common culprits include PDFs and other document formats that are not designed for seamless data extraction and manipulation.
Some Context into the Problem I’m Solving
Seattle Public Schools (SPS) announced near the end of the 2023/2024 school year that they were unable to overcome a budget shortfall in excess of $100M/year and growing through time. Soon after, a program and analysis were initiated which aimed to identify and close up to 20 of the nearly 70 elementary schools in Seattle.
I’m a parent of one of the kids in one of these elementary schools. And like many of the other parents who were thrust upon this program without much warning, I felt frustrated at the lack of open & readily available data, even though the district pointed towards numerous PDFs available through their webpage.
Sure, someone could go and copy/paste the data from each of the PDFs, but that’s going to take a tremendous amount of time.
Sure, someone could go look at prior analyses which are made available (again, through PDF), but those analyses might only be tangentially relevant.
Sure, someone could request the data via CSVs, but those requests are only supported by 2 part-time individuals, and the lead time for getting the data is measured in months, not days.
And so I spent some time trying to acquire the data that I believe anyone would need to come to a reasonable conclusion on which schools (if any) to close. Obvious information like Budget, Enrollment and Facilities data — for the past 3 years by school.
Thankfully I did not have to copy & paste the data manually. Instead, I used Python to scrape the PDFs in order to get a dataset which anyone could use to perform a robust analysis. It still took forever.
What’s Possible when the Data is Unlocked
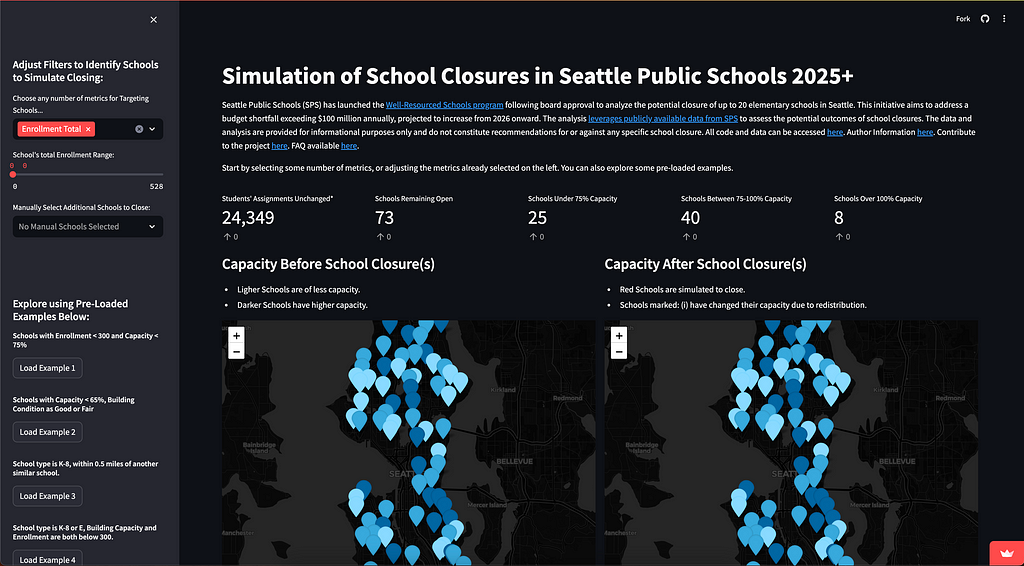
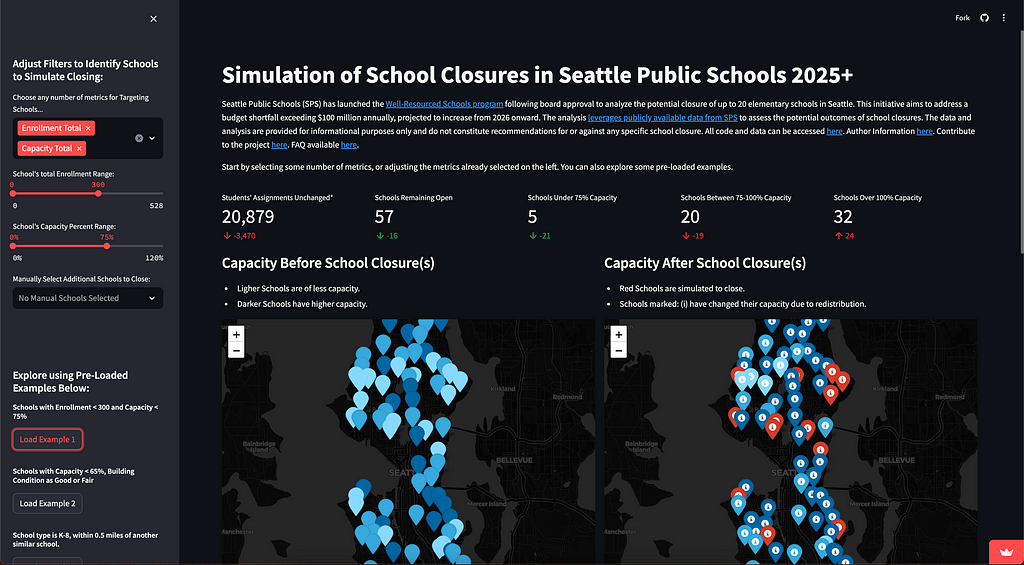
Fast forward a couple of weeks from when I started pulling the data, and you can see the final product. The app I built is hosted on Streamlit, which is a super-slick platform that provides all of the scaffolding and support to quickly enable exploration of your data, or provide a UI on top of your code. You get to spend time on solving the problem instead of having to fiddle with buttons, HTML and the like.

My exploration began as an examination of the budgets and enrollment themselves, but then quickly morphed into a way to understand one of many impacts from closing schools — specifically, how do the students become redistributed based on existing relationships between enrollment boundaries and number of students who attend within or outside of them.
So, that became the primary use-case for what I created:
As a member of the community, how will a specific scenario of school closures impact other surrounding schools from a capacity perspective?

All of the data can be quickly downloaded through the tables below the maps, and users can quickly play with and observe their own scenarios. Like, “What if they closed my school?”
An unintended A-Ha!
I did make an interesting observation while analyzing this data. This observation was done just after completing a fairly simple linear regression. The y-intercept for the regression was around $760k, which represented an estimated baseline cost for having a school open. In simpler terms, by closing a school, and redistributing staff and budget dollars, the district will probably see on average $760k in cost savings per school. Therefore closing up to 20 schools, maintaining staffing levels, and redistributing students, would save a little over $15M. There’s a big gap between that and the $100M deficit that the closures intend to address. This probably warrants some additional analysis — if only I had access to better (or even more) data…
Breaking Out is a Choice
As I went through this exercise, it became increasingly clear that FOIA and Public Records laws give an opportunity (maybe unintended) to help break through data jails when scrappy scraping skills can’t be leveraged.
Others have likely requested this data in the past, sought and received necessary approvals, and been provided that data. And even though that data shared with the requestor is considered public, it’s not made accessible to anyone else in an easy way. Herein lies the problem. Why can’t I just look at and use the data that others have already asked for and been given?
Wrapping Up
So — I built a thing. I scraped data from PDFs using a thing. But, I also have a request in the queue with Seattle Public Schools and Seattle.gov to get access to any information provided via public requests and FOIAs for public school data over the last 2 years. Those responses and the requests are also themselves public records.
But, for those who don’t have the skills to write code to scrape this themselves, this data remains just beyond arm’s length, locked behind the bars of PDFs, webpages, & images. It doesn’t have to be that way. And, it shouldn’t be that way.
There are certainly discussions to be had on formalizing on a consistent format for data in the first place. Things like standard table formats such as Delta Lake seem like a very scalable and reasonable solution across the board (Thank you Robert Dale Thompson), but even making the data from past FOIAs and public records requests accessible on existing sites such as data.seattle.gov seem like table stakes.
Let’s work together to unlock the potential of public data. Check out my Streamlit app to see how accessible data can make a real difference. Join me in advocating for open data by reaching out to your local representatives and backing initiatives that promote transparency. Share your own experiences and knowledge with your community to spread awareness and drive change. Together, we can break down these data jails and ensure information is truly accessible to everyone.
More to come, once I get access to the data.
Overcoming (Unintended) Data Jails was originally published in Towards Data Science on Medium, where people are continuing the conversation by highlighting and responding to this story.
Originally appeared here:
Overcoming (Unintended) Data Jails
Go Here to Read this Fast! Overcoming (Unintended) Data Jails
