A practical example of setting up observability for a data pipeline using best practices from SWE world

Introduction
At the time of this writing (July 2024) Databricks has become a standard platform for data engineering in the cloud, this rise to prominence highlights the importance of features that support robust data operations (DataOps). Among these features, observability capabilities — logging, monitoring, and alerting — are essential for a mature and production-ready data engineering tool.
There are many tools to log, monitor, and alert the Databricks workflows including built-in native Databricks Dashboards, Azure Monitor, DataDog among others.
However, one common scenario that is not obviously covered by the above is the need to integrate with an existing enterprise monitoring and alerting stack rather than using the dedicated tools mentioned above. More often than not, this will be Elastic stack (aka ELK) — a de-facto standard for logging and monitoring in the software development world.
Components of the ELK stack?
ELK stands for Elasticsearch, Logstash, and Kibana — three products from Elastic that offer end-to-end observability solution:
- Elasticsearch — for log storage and retrieval
- Logstash — for log ingestion
- Kibana — for visualizations and alerting
The following sections will present a practical example of how to integrate the ELK Stack with Databricks to achieve a robust end-to-end observability solution.
A practical example
Prerequisites
Before we move on to implementation, ensure the following is in place:
- Elastic cluster — A running Elastic cluster is required. For simpler use cases, this can be a single-node setup. However, one of the key advantages of the ELK is that it is fully distributed so in a larger organization you’ll probably deal with a cluster running in Kubernetes. Alternatively, an instance of Elastic Cloud can be used, which is equivalent for the purposes of this example.
If you are experimenting, refer to the excellent guide by DigitalOcean on how to deploy an Elastic cluster to a local (or cloud) VM. - Databricks workspace — ensure you have permissions to configure cluster-scoped init scripts. Administrator rights are required if you intend to set up global init scripts.
Storage
For log storage, we will use Elasticsearch’s own storage capabilities. We start by setting up. In Elasticsearch data is organized in indices. Each index contains multiple documents, which are JSON-formatted data structures. Before storing logs, an index must be created. This task is sometimes handled by an organization’s infrastructure or operations team, but if not, it can be accomplished with the following command:
curl -X PUT "http://localhost:9200/logs_index?pretty"
Further customization of the index can be done as needed. For detailed configuration options, refer to the REST API Reference: https://www.elastic.co/guide/en/elasticsearch/reference/current/indices-create-index.html
Once the index is set up documents can be added with:
curl -X POST "http://localhost:9200/logs_index/_doc?pretty"
     -H 'Content-Type: application/json'
     -d'
{
  "timestamp": "2024-07-21T12:00:00",
  "log_level": "INFO",
  "message": "This is a log message."
}'
To retrieve documents, use:
curl -X GET "http://localhost:9200/logs_index/_search?pretty"
     -H 'Content-Type: application/json'
     -d'
{
  "query": {
    "match": {
      "message": "This is a log message."
    }
  }
}'
This covers the essential functionality of Elasticsearch for our purposes. Next, we will set up the log ingestion process.
Transport / Ingestion
In the ELK stack, Logstash is the component that is responsible for ingesting logs into Elasticsearch.
The functionality of Logstash is organized into pipelines, which manage the flow of data from ingestion to output.
Each pipeline can consist of three main stages:
- Input: Logstash can ingest data from various sources. In this example, we will use Filebeat, a lightweight shipper, as our input source to collect and forward log data — more on this later.
- Filter: This stage processes the incoming data. While Logstash supports various filters for parsing and transforming logs, we will not be implementing any filters in this scenario.
- Output: The final stage sends the processed data to one or more destinations. Here, the output destination will be an Elasticsearch cluster.
Pipeline configurations are defined in YAML files and stored in the /etc/logstash/conf.d/ directory. Upon starting the Logstash service, these configuration files are automatically loaded and executed.
You can refer to Logstash documentation on how to set up one. An example of a minimal pipeline configuration is provided below:
input {
  beats {
    port => 5044
  }
}

filter {}

output {
  elasticsearch {
    hosts => ["http://localhost:9200"]
    index => "filebeat-logs-%{+YYYY.MM.dd}"
  }
}
Finally, ensure the configuration is correct:
bin/logstash -f /etc/logstash/conf.d/test.conf --config.test_and_exit
Collecting application logs
There is one more component in ELK — Beats. Beats are lightweight agents (shippers) that are used to deliver log (and other) data into either Logstash or Elasticsearch directly. There’s a number of Beats — each for its individual use case but we’ll concentrate on Filebeat — by far the most popular one — which is used to collect log files, process them, and push to Logstash or Elasticsearch directly.
Beats must be installed on the machines where logs are generated. In Databricks we’ll need to setup Filebeat on every cluster that we want to log from — either All-Purpose (for prototyping, debugging in notebooks and similar) or Job (for actual workloads). Installing Filebeat involves three steps:
- Installation itself — download and execute distributable package for your operating system (Databricks clusters are running Ubuntu — so a Debian package should be used)
- Configure the installed instance
- Starting the service via system.d and asserting it’s active status
This can be achieved with the help of Init scripts. A minimal example Init script is suggested below:
#!/bin/bash

# Check if the script is run as root
if [ "$EUID" -ne 0 ]; then
  echo "Please run as root"
  exit 1
fi

# Download filebeat installation package
SRC_URL="https://artifacts.elastic.co/downloads/beats/filebeat/filebeat-8.14.3-amd64.deb"
DEST_DIR="/tmp"
FILENAME=$(basename "$SRC_URL")
wget -q -O "$DEST_DIR/$FILENAME" "$SRC_URL"

# Install filebeat
export DEBIAN_FRONTEND=noninteractive
dpkg -i /tmp/filebeat-8.14.3-amd64.deb
apt-get -f install -y

# Configure filebeat
cp /etc/filebeat/filebeat.yml /etc/filebeat/filebeat_backup.yml
tee /etc/filebeat/filebeat.yml > /dev/null <<EOL
filebeat.inputs:
- type: filestream
  id: my-application-filestream-001
  enabled: true
  paths:
    - /var/log/myapplication/*.txt
  parsers:
    - ndjson:
      keys_under_root: true
      overwrite_keys: true
      add_error_key: true
      expand_keys: true

processors:
- timestamp:
    field: timestamp
    layouts:
      - "2006-01-02T15:04:05Z"
      - "2006-01-02T15:04:05.0Z"
      - "2006-01-02T15:04:05.00Z"
      - "2006-01-02T15:04:05.000Z"
      - "2006-01-02T15:04:05.0000Z"
      - "2006-01-02T15:04:05.00000Z"
      - "2006-01-02T15:04:05.000000Z"
    test:
      - "2024-07-19T09:45:20.754Z"
      - "2024-07-19T09:40:26.701Z"

output.logstash:
  hosts: ["localhost:5044"]

logging:
  level: debug
  to_files: true
  files:
    path: /var/log/filebeat
    name: filebeat
    keepfiles: 7
    permissions: 0644
EOL

# Start filebeat service
systemctl start filebeat

# Verify status
# systemctl status filebeat
Timestamp Issue
Notice how in the configuration above we set up a processor to extract timestamps. This is done to address a common problem with Filebeat — by default it will populate logs @timestamp field with a timestamp when logs were harvested from the designated directory — not with the timestamp of the actual event. Although the difference is rarely more than 2–3 seconds for a lot of applications, this can mess up the logs real bad — more specifically, it can mess up the order of records as they are coming in.
To address this, we will overwrite the default @timestamp field with values from log themselves.
Logging
Once Filebeat is installed and running, it will automatically collect all logs output to the designated directory, forwarding them to Logstash and subsequently down the pipeline.
Before this can occur, we need to configure the Python logging library.
The first necessary modification would be to set up FileHandler to output logs as files to the designated directory. Default logging FileHandler will work just fine.
Then we need to format the logs into NDJSON, which is required for proper parsing by Filebeat. Since this format is not natively supported by the standard Python library, we will need to implement a custom Formatter.
class NDJSONFormatter(logging.Formatter):
    def __init__(self, extra_fields=None):
        super().__init__()
        self.extra_fields = extra_fields if extra_fields is not None else {}

    def format(self, record):
        log_record = {
            "timestamp": datetime.datetime.fromtimestamp(record.created).isoformat() + 'Z',
            "log.level": record.levelname.lower(),
            "message": record.getMessage(),
            "logger.name": record.name,
            "path": record.pathname,
            "lineno": record.lineno,
            "function": record.funcName,
            "pid": record.process,
        }
        log_record = {**log_record, **self.extra_fields}
        if record.exc_info:
            log_record["exception"] = self.formatException(record.exc_info)
        return json.dumps(log_record)
We will also use the custom Formatter to address the timestamp issue we discussed earlier. In the configuration above a new field timestamp is added to the LogRecord object that will conatain a copy of the event timestamp. This field may be used in timestamp processor in Filebeat to replace the actual @timestamp field in the published logs.
We can also use the Formatter to add extra fields — which may be useful for distinguishing logs if your organization uses one index to collect logs from multiple applications.
Additional modifications can be made as per your requirements. Once the Logger has been set up we can use the standard Python logging API — .info() and .debug(), to write logs to the log file and they will automatically propagate to Filebeat, then to Logstash, then to Elasticsearch and finally we will be able to access those in Kibana (or any other client of our choice).
Visualization
In the ELK stack, Kibana is a component responsible for visualizing the logs (or any other). For the purpose of this example, we’ll just use it as a glorified search client for Elasticsearch. It can however (and is intended to) be set up as a full-featured monitoring and alerting solution given its rich data presentation toolset.
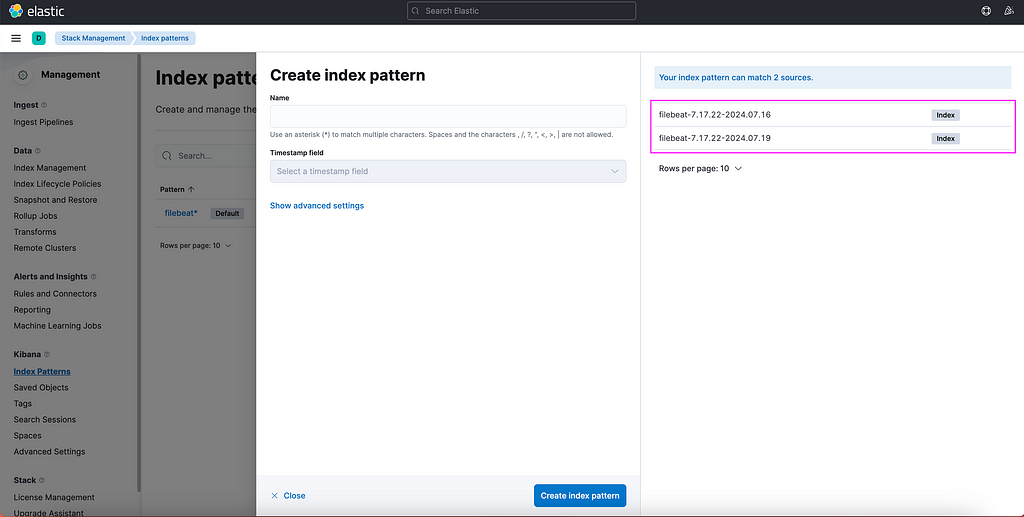
In order to finally see our log data in Kibana, we need to set up Index Patterns:
- Navigate to Kibana.
- Open the “Burger Menu” (≡).
- Go to Management -> Stack Management -> Kibana -> Index Patterns.
- Click on Create Index Pattern.

Kibana will helpfully suggest names of the available sources for the Index Patterns. Type out a name that will capture the names of the sources. In this example it can be e.g. filebeat*, then click Create index pattern.
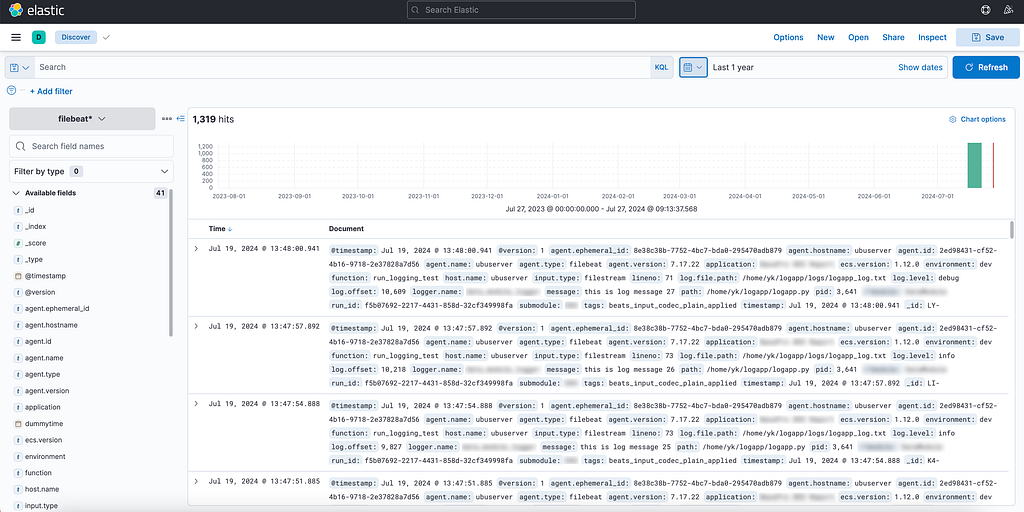
Once selected, proceed to Discover menu, select the newly created index pattern on the left drop-down menu, adjust time interval (a common pitfall — it is set up to last 15 minutes by default) and start with your own first KQL query to retrieve the logs.

We have now successfully completed the multi-step journey from generating a log entry in a Python application hosted on Databricks to to visualizing and monitoring this data using a client interface.
Conclusion
While this article has covered the introductory aspects of setting up a robust logging and monitoring solution using the ELK Stack in conjunction with Databricks, there are additional considerations and advanced topics that suggest further exploration:
- Choosing Between Logstash and Direct Ingestion: Evaluating whether to use Logstash for additional data processing capabilities versus directly forwarding logs from Filebeat to Elasticsearch.
- Schema Considerations: Deciding on the adoption of the Elastic Common Schema (ECS) versus implementing custom field structures for log data.
- Exploring Alternative Solutions: Investigating other tools such as Azure EventHubs and other potential log shippers that may better fit specific use cases.
- Broadening the Scope: Extending these practices to encompass other data engineering tools and platforms, ensuring comprehensive observability across the entire data pipeline.
These topics will be explored in further articles.
Unless otherwise noted, all images are by the author.
How To Log Databricks Workflows with the Elastic (ELK) Stack was originally published in Towards Data Science on Medium, where people are continuing the conversation by highlighting and responding to this story.
Originally appeared here:
How To Log Databricks Workflows with the Elastic (ELK) Stack
Go Here to Read this Fast! How To Log Databricks Workflows with the Elastic (ELK) Stack