Diving into Word Embeddings with EDA
Visualizing unexpected insights in text data
When starting work with a new dataset, it’s always a good idea to start with some exploratory data analysis (EDA). Taking the time to understand your data before training any fancy models can help you understand the structure of the dataset, identify any obvious issues, and apply domain-specific knowledge.
You see EDA in various forms with everything from house prices to advanced applications in the data science industry. But I still haven’t seen it for the hottest new dataset: word embeddings, the basis of our best large language models. So why not try it?
In this article, we’ll apply EDA to GloVe word embeddings, using techniques like covariance matrices, clustering, PCA, and vector math. This will help us understand the structure of word embeddings, giving us a useful starting point for building more powerful models with this data. As we discover this structure, we’ll find that it’s not always what it seems, and some surprising biases are hidden in the corpus.
You will need:
- Basic understanding of linear algebra, statistics, and vector mathematics
- Python packages: numpy, sklearn, and matplotlib
- About 3 GB of spare disk space
The Dataset
To get started, download the dataset at huggingface.co/stanfordnlp/glove/resolve/main/glove.6B.zip[1]. This contains three text files, each containing a list of words along with their vector representations. We will use the 300-dimensional representations (glove.6B.300d.txt).
A quick note on where this dataset comes from: essentially, this is a list of word embeddings derived from 6 billion tokens’ worth of co-occurrence data from Wikipedia and various news sources. A useful side effect of using co-occurrence is that words that mean similar things tend to be close together. For example, since “the red bird” and “the blue bird” are both valid sentences, we might expect the vectors for “red” and “blue” to be close to each other. For more technical information, you can check the original GloVe paper[1].
To be clear, these are not word embeddings trained for the purpose of large language models. They are a fully unsupervised technique based on a large corpus. But they display a lot of similar properties to language model embeddings, and are interesting in their own right.
Each line of this text file consists of a word, followed by all 300 vector components of the associated embedding separated by spaces. We can load that in with Python. (To reduce noise and speed things up, I’m using the top 10% of the full dataset here with the //10, but you can change that if you’d like.)
import numpy as np

embeddings = {}

with open(f"glove.6B/glove.6B.300d.txt", "r") as f:
    glove_content = f.read().split('n')

for i in range(len(glove_content)//10):
    line = glove_content[i].strip().split(' ')
    if line[0] == '':
        continue
    word = line[0]
    embedding = np.array(list(map(float, line[1:])))
    embeddings[word] = embedding

print(len(embeddings))
That leaves us with 40,000 embeddings loaded in.
Similarity Metrics
One natural question we might ask is: are vectors generally close to other vectors with similar meaning? And as a follow-up question, how do we quantify this?
There are two main ways we will quantify similarity between vectors: one is Euclidean distance, which is simply the natural Pythagorean theorem distance we are familiar with. The other is cosine similarity, which measures the cosine of the angle between two vectors. A vector has a cosine similarity of 1 with itself, -1 with an opposite vector, and 0 with an orthogonal vector.
Let’s implement these in NumPy:
def cos_sim(a, b):
    return np.dot(a,b)/(np.linalg.norm(a) * np.linalg.norm(b))
def euc_dist(a, b):
    return np.sum(np.square(a - b)) # no need for square root since we are just ranking distances
Now we can find all the closest vectors to a given word or embedding vector! We’ll do this in increasing order.
def get_sims(to_word=None, to_e=None, metric=cos_sim):
    # list all similarities to the word to_word, OR the embedding vector to_e
    assert (to_word is not None) ^ (to_e is not None) # find similarity to a word or a vector, not both
    sims = []
    if to_e is None:
        to_e = embeddings[to_word] # get the embedding for the word we are looking at
    for word in embeddings:
        if word == to_word:
            continue
        word_e = embeddings[word]
        sim = metric(word_e, to_e)
        sims.append((sim, word))
    sims.sort()
    return sims
Now we can write a function to display the 10 most similar words. It will be useful to include a reverse option as well, so we can display the least similar words.
def display_sims(to_word=None, to_e=None, n=10, metric=cos_sim, reverse=False, label=None):
    assert (to_word is not None) ^ (to_e is not None)
    sims = get_sims(to_word=to_word, to_e=to_e, metric=metric)
    display = lambda sim: f'{sim[1]}: {sim[0]:.5f}'
    if label is None:
        label = to_word.upper() if to_word is not None else ''
    print(label) # a heading so we know what these similarities are for
    if reverse:
        sims.reverse()
    for i, sim in enumerate(reversed(sims[-n:])):
        print(i+1, display(sim))
    return sims
Finally, we can test it!
display_sims(to_word='red')
# yellow, blue, pink, green, white, purple, black, colored, sox, bright
Looks like the Boston Red Sox made an unexpected appearance here. But other than that, this is about what we would expect.
Maybe we can try some verbs, and not just nouns and adjectives? How about a nice and kind verb like “share”?
display_sims(to_word='share')
# shares, stock, profit, percent, shared, earnings, profits, price, gain, cents
I guess “share” isn’t often used as a verb in this dataset. Oh well.
We can try some more conventional examples as well:
display_sims(to_word='cat')
# dog, cats, pet, dogs, feline, monkey, horse, pets, rabbit, leopard
display_sims(to_word='frog')
# toad, frogs, snake, monkey, squirrel, species, rodent, parrot, spider, rat
display_sims(to_word='queen')
# elizabeth, princess, king, monarch, royal, majesty, victoria, throne, lady, crown
Reasoning by Analogy
One of the fascinating properties about word embeddings is that analogy is built in using vector math. The example from the GloVe paper is king – queen = man – woman. In other words, rearranging the equation, we expect king = man – woman + queen. Is this true?
display_sims(to_e=embeddings['man'] - embeddings['woman'] + embeddings['queen'], label='king-queen analogy')
# queen, king, ii, majesty, monarch, prince...
Not quite: the closest vector to man – woman + queen turns out to be queen (cosine similarity 0.78), followed somewhat distantly by king (cosine similarity 0.66). Inspired by this excellent 3Blue1Brown video, we might try aunt and uncle instead:
display_sims(to_e=embeddings['aunt'] - embeddings['woman'] + embeddings['man'], label='aunt-uncle analogy')
# aunt, uncle, brother, grandfather, grandmother, cousin, uncles, grandpa, dad, father
This is better (cosine similarity 0.7348 vs 0.7344), but still doesn’t work perfectly. But we can try switching to Euclidean distance. Now we need to set reverse=True, because a higher Euclidean distance is actually a lower similarity.
display_sims(to_e=embeddings['aunt'] - embeddings['woman'] + embeddings['man'], metric=euc_dist, reverse=True, label='aunt-uncle analogy')
# uncle, aunt, grandfather, brother, cousin, grandmother, newphew, dad, grandpa, cousins
Now we got it. But it seems like the analogy math might not be as perfect as we hoped, at least in the naïve way that we are doing it here.
Magnitude
Cosine similarity is all about the angles between vectors. But is the magnitude of a vector also important?
We can reuse our existing code by expressing magnitude as the Euclidean distance from the zero vector. Let’s see which words have the largest and smallest magnitudes:
zero_vec = np.zeros_like(embeddings['the'])
display_sims(to_e=zero_vec, metric=euc_dist, label='largest magnitude')
# republish, nonsubscribers, hushen, tael, www.star, stoxx, 202-383-7824, resend, non-families, 225-issue
display_sims(to_e=zero_vec, metric=euc_dist, reverse=True, label='smallest magnitude')
# likewise, lastly, interestingly, ironically, incidentally, moreover, conversely, furthermore, aforementioned, wherein
It doesn’t look like there’s much of a pattern to the meaning of the large magnitude vectors, but they all seem to have very specific (and sometimes confusing) meanings. On the other hand, the smallest magnitude vectors tend to be very common words that can be found in a variety of contexts.
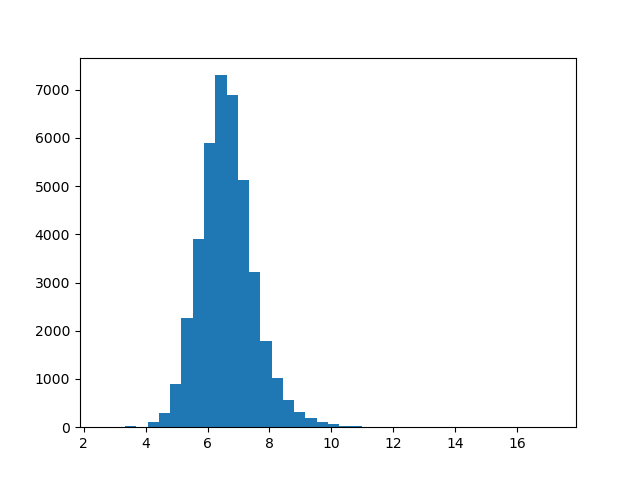
There’s a huge range between magnitudes: from about 2.6 for the smallest vector all the way to about 17 for the largest. What does this distribution look like? We can plot a histogram to get a better picture of this.
import matplotlib.pyplot as plt

def plot_magnitudes():
    words = [w for w in embeddings]
    magnitude = lambda word: np.linalg.norm(embeddings[word])
    magnitudes = list(map(magnitude, words))
    plt.hist(magnitudes, bins=40)
    plt.show()

plot_magnitudes()

This distribution looks approximately normal. If we wanted to test this further, we could use a Q-Q plot. But for our purposes right now, this is fine.
Dataset Bias
It turns out that directions and subspaces in vector embeddings can encode various kinds of concepts, often in biased ways. This paper[2] studied how this works for gender bias.
We can replicate this concept in our GloVe embeddings, too. First, let’s find the direction of the concept of “masculinity”. We can accomplish this by taking the average of differences between vectors like he and she, man and woman, and so on:
gender_pairs = [('man', 'woman'), ('men', 'women'), ('brother', 'sister'), ('he', 'she'),
                    ('uncle', 'aunt'), ('grandfather', 'grandmother'), ('boy', 'girl'),
                    ('son', 'daughter')]
masc_v = zero_vec
for pair in gender_pairs:
    masc_v += embeddings[pair[0]]
    masc_v -= embeddings[pair[1]]
Now we can find the “most masculine” and “most feminine” vectors, as judged by the embedding space.
display_sims(to_e=masc_v, metric=cos_sim, label='masculine vecs')
# brother, colonel, himself, uncle, gen., nephew, brig., brothers, son, sir
display_sims(to_e=masc_v, metric=cos_sim, reverse=True, label='feminine vecs')
# actress, herself, businesswoman, chairwoman, pregnant, she, her, sister, actresses, woman
Now, we can run an easy test to detect bias in the dataset: compute the similarity between nurse and each of man and woman. Theoretically, these should be about equal: nurse is not a gendered word. Is this true?
print("nurse - man", cos_sim(embeddings['nurse'], embeddings['man'])) # 0.24
print("nurse - woman", cos_sim(embeddings['nurse'], embeddings['woman'])) # 0.45
That’s a pretty big difference! (Remember cosine similarity runs from -1 to 1, with positive associations in the range 0 to 1.) For reference, 0.45 is also close to the cosine similarity between cat and leopard.
Clustering
Let’s see if we can cluster words with similar meaning using k-means clustering. This is easy to do with the package scikit-learn. We are going to use 300 clusters, which sounds like a lot, but trust me: almost all of the clusters are so interesting, you could write an entire article just interpreting them!
from sklearn.cluster import KMeans

def get_kmeans(n=300):
    kmeans = KMeans(n_clusters=n, n_init=1)
    X = np.array([embeddings[w] for w in embeddings])
    kmeans.fit(X)
    return kmeans

def display_kmeans(kmeans):
    # print all clusters and 5 associated words for each
    words = np.array([w for w in embeddings])
    X = np.array([embeddings[w] for w in embeddings])
    y = kmeans.predict(X) # get the cluster for each word
    for cluster in range(kmeans.cluster_centers_.shape[0]):
        print(f'KMeans {cluster}')
        cluster_words = words[y == cluster] # get all words in each cluster
        for i, w in enumerate(cluster_words[:5]):
            print(i+1, w)

kmeans = get_kmeans()
display_kmeans(kmeans)
There’s a lot to look at here. We have clusters for things as diverse as New York City (manhattan, n.y., brooklyn, hudson, borough), molecular biology (protein, proteins, enzyme, beta, molecules), and Indian names (singh, ram, gandhi, kumar, rao).
But sometimes these clusters are not what they seem. Let’s write code to display all words of a cluster containing a given word, along with the nearest and farthest cluster.
def get_kmeans_cluster(kmeans, word=None, cluster=None):
    # given a word, find the cluster of that word. (or start with a cluster index.)
    # then, get all words of that cluster.
    assert (word is None) ^ (cluster is None)
    if cluster is None:
        cluster = kmeans.predict([embeddings[word]])[0]
    words = np.array([w for w in embeddings])
    X = np.array([embeddings[w] for w in embeddings])
    y = kmeans.predict(X)
    cluster_words = words[y == cluster]
    return cluster, cluster_words

def display_cluster(kmeans, word):
    cluster, cluster_words = get_kmeans_cluster(kmeans, word=word)
    # print all words in the cluster
    print(f"Full KMeans ({word}, cluster {cluster})")
    for i, w in enumerate(cluster_words):
        print(i+1, w)
    # rank all clusters (excluding this one) by Euclidean distance of their centers from this cluster's center
    distances = np.concatenate([kmeans.cluster_centers_[:cluster], kmeans.cluster_centers_[cluster+1:]], axis=0)
    distances = np.sum(np.square(distances - kmeans.cluster_centers_[cluster]), axis=1)
    nearest = np.argmin(distances, axis=0)
    _, nearest_words = get_kmeans_cluster(kmeans, cluster=nearest)
    print(f"Nearest cluster: {nearest}")
    for i, w in enumerate(nearest_words[:5]):
        print(i+1, w)
    farthest = np.argmax(distances, axis=0)
    print(f"Farthest cluster: {farthest}")
    _, farthest_words = get_kmeans_cluster(kmeans, cluster=farthest)
    for i, w in enumerate(farthest_words[:5]):
        print(i+1, w)
Now let’s try out this code.
display_cluster(kmeans, 'animal')
# species, fish, wild, dog, bear, males, birds...
display_cluster(kmeans, 'dog')
# same as 'animal'
display_cluster(kmeans, 'birds')
# same again
display_cluster(kmeans, 'bird')
# spread, bird, flu, virus, tested, humans, outbreak, infected, sars....?
You might not get exactly this result every time: the clustering algorithm is non-deterministic. But much of the time, “birds” is associated with disease words rather than animal words. It seems the original dataset tends to use the word “bird” in the context of disease vectors.
There are literally hundreds more clusters for you to explore the contents of. Some other clusters I found interesting are “Illinois” and “Genghis”.
Principal Component Analysis
Principal Component Analysis (PCA) is a tool we can use to find the directions in vector space associated with the most variance in our dataset. Let’s try it. Like clustering, sklearn makes this easy.
from sklearn.decomposition import PCA

def get_pca_vecs(n=10): # get the first 10 principal components
    pca = PCA()
    X = np.array([embeddings[w] for w in embeddings])
    pca.fit(X)
    principal_components = list(pca.components_[:n, :])
    return pca, principal_components

pca, pca_vecs = get_pca_vecs()
for i, vec in enumerate(pca_vecs):
    # display the words with the highest and lowest values for each principal component
    display_sims(to_e=vec, metric=cos_sim, label=f'PCA {i+1}')
    display_sims(to_e=vec, metric=cos_sim, label=f'PCA {i+1} negative', reverse=True)
Like our k-means experiment, a lot of these PCA vectors are really interesting. For example, let’s take a look at principal component 9:
    PCA 9
1 featuring: 0.38193
2 hindi: 0.37217
3 arabic: 0.36029
4 sung: 0.35130
5 che: 0.34819
6 malaysian: 0.34474
7 ka: 0.33820
8 video: 0.33549
9 bollywood: 0.33347
10 counterpart: 0.33343
    PCA 9 negative
1 suffolk: -0.31999
2 cumberland: -0.31697
3 northumberland: -0.31449
4 hampshire: -0.30857
5 missouri: -0.30771
6 calhoun: -0.30749
7 erie: -0.30345
8 massachusetts: -0.30133
9 counties: -0.29710
10 wyoming: -0.29613
It looks like positive values for component 9 are associated with Middle Eastern, South Asian and Southeast Asian terms, while negative values are associated with North American and British terms.
Another interesting one is component 3. All the positive terms are decimal numbers, apparently quite a salient feature for this model. Component 8 also shows a similar pattern.
    PCA 3
1 1.8: 0.57993
2 1.6: 0.57851
3 1.2: 0.57841
4 1.4: 0.57294
5 2.3: 0.57019
6 2.6: 0.56993
7 2.8: 0.56966
8 3.7: 0.56660
9 1.9: 0.56424
10 2.2: 0.56063
Dimensionality Reduction
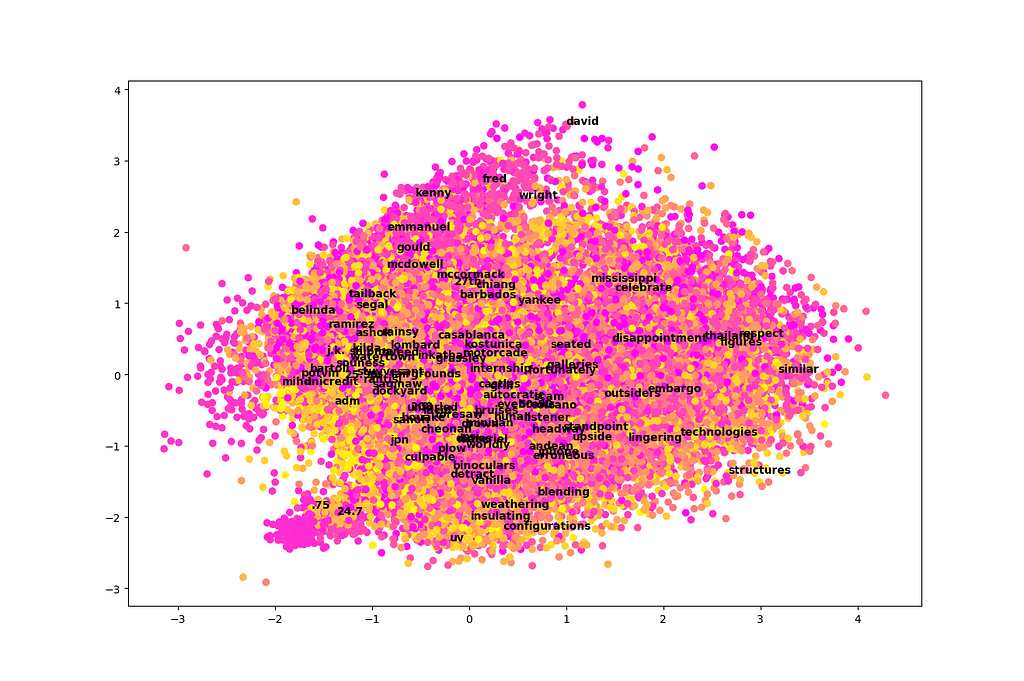
One of the main benefits of PCA is that it allows us to take a very high-dimensional dataset (300-dimensional in this case) and plot it in just two or three dimensions by projecting onto the first components. Let’s try a two-dimensional plot and see if there is any information we can gather from it. We’ll also include color-coding by cluster using k-means.
def plot_pca(pca_vecs, kmeans):
    words = [w for w in embeddings]
    x_vec = pca_vecs[0]
    y_vec = pca_vecs[1]
    X = np.array([np.dot(x_vec, embeddings[w]) for w in words])
    Y = np.array([np.dot(y_vec, embeddings[w]) for w in words])
    colors =  kmeans.predict([embeddings[w] for w in words])
    plt.scatter(X, Y, c=colors, cmap='spring') # color by cluster
    for i in np.random.choice(len(words), size=100, replace=False):
        # annotate 100 randomly selected words on the graph
        plt.annotate(words[i], (X[i], Y[i]), weight='bold')
    plt.show()

plot_pca(pca_vecs, kmeans)

Unfortunately, this plot is a total mess! It’s difficult to learn much from it. It looks like just two dimensions in isolation are not very easy to interpret among 300 total dimensions, at least in the case of this dataset.
There are two exceptions. First, we see that names tend to cluster near the top of this graph. Second, there is a little section that sticks out like a sore thumb at the bottom left. This area appears to be associated with numbers, particularly decimal numbers.
Covariance
It is often helpful to get an idea of the covariance between input features. In this case, our input features are just abstract vector directions that are difficult to interpret. Still, a covariance matrix can tell us how much of this information is actually being used. If we see high covariance, it means some dimensions are strongly correlated, and maybe we could get away with reducing the dimensionality a little bit.
def display_covariance():
    X = np.array([embeddings[w] for w in embeddings]).T # rows are variables (components), columns are observations (words)
    cov = np.cov(X)
    cov_range = np.maximum(np.max(cov), np.abs(np.min(cov))) # make sure the colorbar is balanced, with 0 in the middle
    plt.imshow(cov, cmap='bwr', interpolation='nearest', vmin=-cov_range, vmax=cov_range)
    plt.colorbar()
    plt.show()

display_covariance()

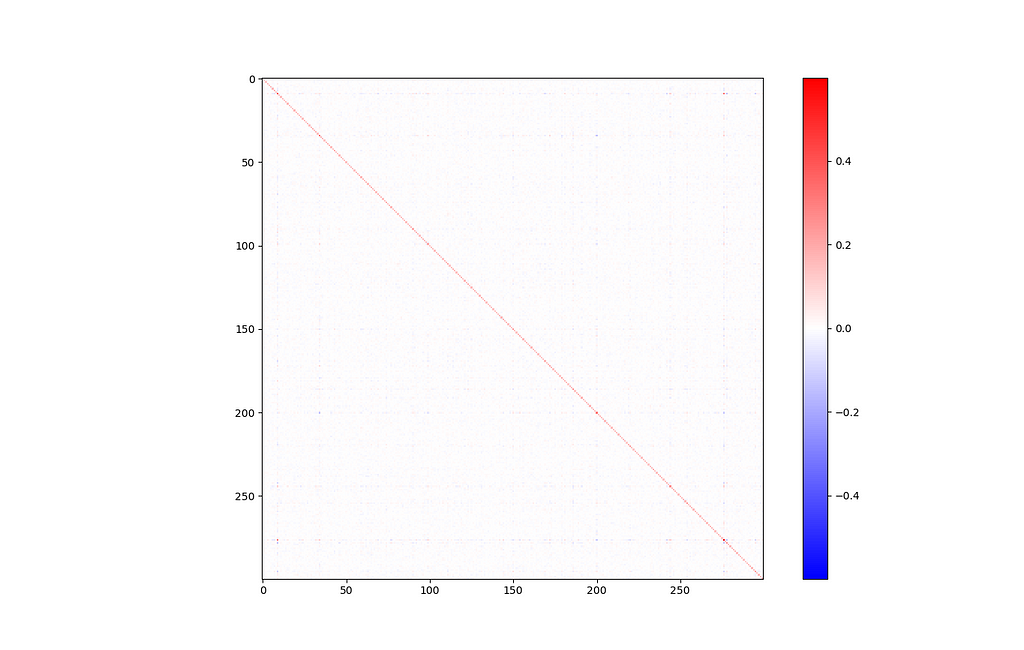
Of course, there’s a big line down the major diagonal, representing that each component is strongly correlated with itself. Other than that, this isn’t a very interesting graph. Everything looks mostly blank, which is a good sign.
If you look closely, there’s one exception: components 9 and 276 seem somewhat strongly related (covariance of 0.308).

Let’s investigate this further by printing the vectors that are most associated with components 9 and 276. This is equivalent to cosine similarity to a basis vector of all zeros, except for a one in the relevant component.
e9 = np.zeros_like(zero_vec)
e9[9] = 1.0
e276 = np.zeros_like(zero_vec)
e276[276] = 1.0
display_sims(to_e=e9, metric=cos_sim, label='e9')
# grizzlies, supersonics, notables, posey, bobcats, wannabe, hoosiers...
display_sims(to_e=e276, metric=cos_sim, label='e276')
# pehr, zetsche, steadied, 202-887-8307, bernice, goldie, edelman, kr...
These results are strange, and not very informative.
But wait: we can also have a positive covariance in these components if words with a very negative value in one tend to also be very negative in the other. Let’s try reversing the direction of similarity.
display_sims(to_e=e9, metric=cos_sim, label='e9', reverse=True)
# therefore, that, it, which, government, because, moreover, fact, thus, very
display_sims(to_e=e276, metric=cos_sim, label='e276', reverse=True)
# they, instead, those, hundreds, addition, dozens, others, dozen, only, outside
It looks like both of these components are associated with basic function words and numbers that can be found in many different contexts. This helps explain the covariance between them, at least more so than the positive case did.
Conclusion
In this article we applied a variety of exploratory data analysis (EDA) techniques to a 300-dimensional dataset of GloVe word embeddings. We used cosine similarity to measure the similarity between the meaning of words, clustering to group words into related groups, and principal component analysis (PCA) to identify the directions in vector space that are most important to the embedding model.
We visually observed overall minimal covariance between the input features using principal component analysis. We tried using PCA to plot all of our 300-dimensional data in just two dimensions, but this was still a little messy.
We also tested assumptions and biases in our dataset. We identified gender bias in our dataset by comparing the cosine similarity of nurse with each of man and woman. We tried using vector math to represent analogies (like “king” is to “queen” as “man” is to “woman”), with some success. By subtracting various examples of vectors referring to males and females, we were able to discover a vector direction associated with gender, and display the “most masculine” and “most feminine” vectors in the dataset.
There’s a lot more EDA you could try on a dataset of word embeddings, but I hope this was a good starting point to understand both some techniques of EDA in general and the structure of word embeddings in particular. If you want to see the full code associated with this article, plus some additional examples, you can check out my GitHub at crackalamoo/glove-embeddings-eda. Thank you for reading!
References
[1] J. Pennington, R. Socher and C.Manning, GloVe: Global Vectors for Word Representation (2014), Stanford NLP (Public Domain Dataset)
[2] T. Bolukbasi, K. Chang, J. Zou, V. Saligrama and A. Kalai, Man is to Computer Programmer as Woman is to Homemaker? Debiasing Word Embeddings (2016), Microsoft Research New England
All images created by the author using Matplotlib.
EDA for Word Embeddings was originally published in Towards Data Science on Medium, where people are continuing the conversation by highlighting and responding to this story.
Originally appeared here:
EDA for Word Embeddings
