
This article provides a step-by-step example of how the Hungarian algorithm solves the optimal assignment problem on a graph
The reason I am writing this article is because I struggled for a few days to understand how the Hungarian Algorithm works on a graph. The matrix version is much easier to understand, but it does not provide the required insight. All the excellent information I found on the web fell short of providing me the clarity needed to intuitively understand why the algorithm is doing what it does.
It was also not straightforward for me to translate the algorithm descriptions into a working example. While the various LLM tools we have today helped in rephrasing the description of the algorithm in various ways, they all failed miserably when I asked them to generate a working step by step example. So I persevered to generate an example of the Hungarian algorithm working its magic on a graph. I present this step by step example here and the intuition I gained from this exercise, in the hope that it helps others trying to learn this wonderful algorithm to solve the problem of optimum assignment.
The optimal assignment problem is to find a one-to-one match from a set of nodes to another set of nodes, where the edge between every pair of nodes has a cost associated with it, and the generated matching must ensure the minimum total cost.
This problem is pervasive. It could be assigning a set of people to a set of jobs, with each one demanding a specific price for a specific job, and the problem is then assigning people to the jobs such that the total cost is minimized. It could be assigning a set of available taxis to the set of people looking for taxis, with each taxi requiring a specific time to reach a specific person. The Hungarian algorithm is used to solve this problem every time we book a Uber or Ola.
The assignment problem is best represented as a bipartite graph, which is a graph with two distinct set of nodes, and the edges never connect nodes from the same set. We take the taxi matching example, and the bipartite graph here shows the possible connections between the nodes. Edge weights indicate the time (in minutes) it takes for the specific taxi to reach a specific person. If all the nodes from one set are connected to all the nodes from the other set, the graph is called complete.
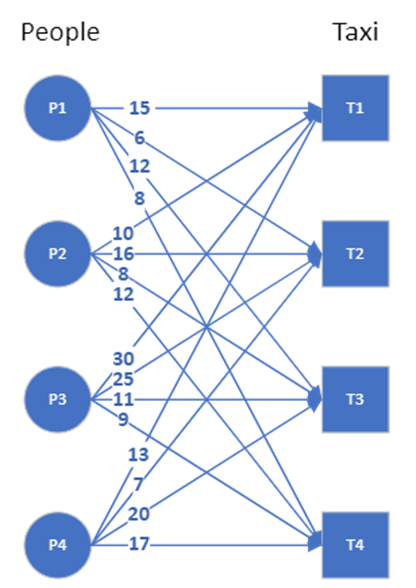
In this example, we need to map 4 persons to 4 taxis. We can brute force the solution:
- For the first person, there are four possible taxi assignments, and we can pick any one of them
- For the second person, there are three taxis left, and we pick one of the three
- For the third person, we pick one of the two taxis left
- For the last person, we pick the remaining taxi
So the total number of possible assignments are 4 x 3 x 2 x 1, which is 4 factorial. We then calculate the total cost for all these 4! assignments and pick that assignment that has the lowest cost. For assignment problems of smaller size, brute force may still be feasible. But as n, the number of people/taxis grow, the n! becomes quite large.
The other approach is a greedy algorithm. You pick one person, assign the taxi with minimum cost to that person, then pick the next person, assign the one of the remaining taxis with minimum cost, and so on. In this example, the minimum cost assignment is not possible for the last person because the taxi that can get to him at the shortest time has been assigned to another person already. So the algorithm picks the next available taxi with minimum cost. The last person therefore suffers for the greed of everyone else. The solution to the greedy algorithm is can be seen in the graph here. There is no guarantee that this greedy approach will result in an optimum assignment, though in this example, it does result in achieving the minimum cost of 36.
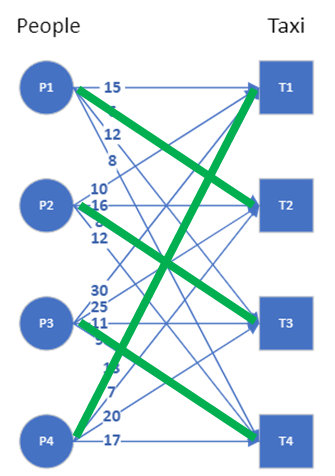
The Hungarian algorithm provides an efficient way of finding the optimum solution. We will start with the matrix algorithm first. We can represent the graph as an adjacency matrix where the weight of each edge is one entry of the matrix. The graph and its adjacency matrix can be seen here.
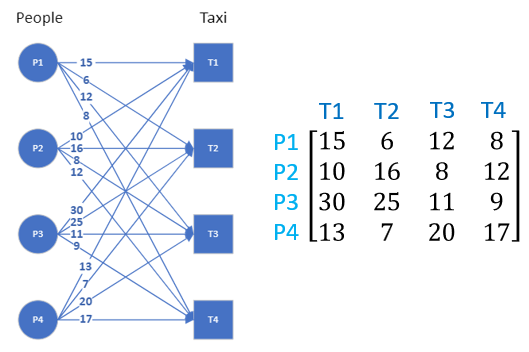
Here are the steps of the Hungarian algorithm operating on the adjacency matrix:
- For each row in the adjacency matrix, find and subtract the minimum entry from all the entries of that row
- For each column in the adjacency matrix, find and subtract the minimum entry from all entries of that column
- Cover all zeros in the matrix with minimum number of lines
a. Count the number of zeros in each row and in each column
b. Draw lines on the row/column that has most zeros first, then second most and so on
c. If number of lines required cover all zeros is less than the number or row/column of the matrix, continue to step 4, else move to step 5 - Find the smallest entry that is not covered by a line and subtract that entry from all uncovered entries while adding it to all entries covered twice (horizontal and vertical line), go to step 3
- Optimum assignment can be generated by starting with the row/column that has only one zero
The first two steps are easy. The third step requires crossing out rows or columns in the order of the number of zeros they have, highest to lowest. If the number of rows and columns crossed out does not equal the number of nodes to be matched, we need to create additional zeros — this is done in the fourth step. Iterate step 3 and step 4 until enough rows and columns are crossed out. We then have enough zeros in the matrix for optimum matching.
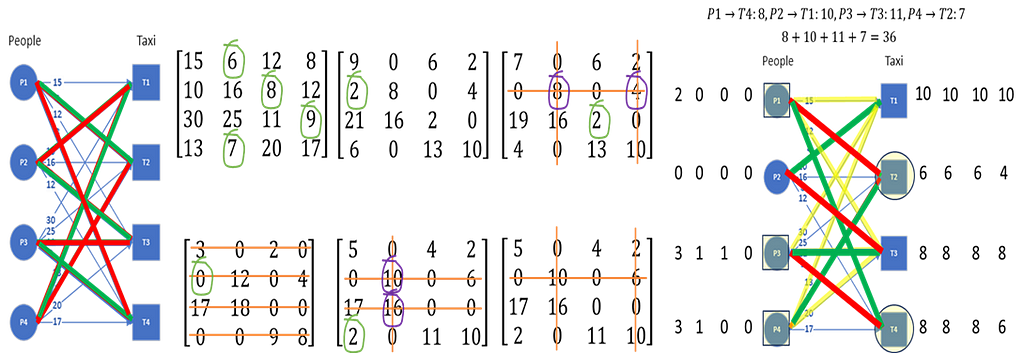
The steps of the Hungarian algorithm for this taxi matching example are shown in this animated GIF.
For those to whom the GIF is hard to follow, here is the image that shows the steps.
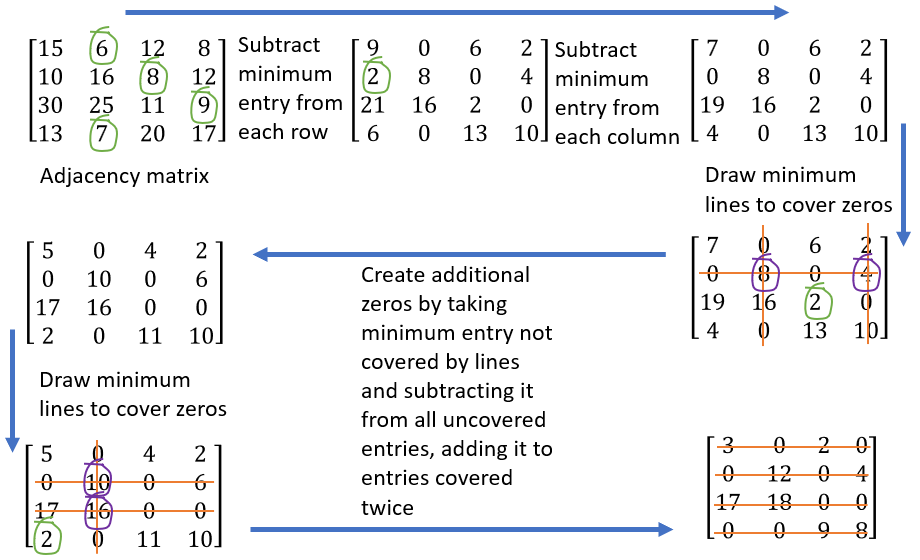
The algorithm terminates once the number of rows/columns that have been crossed out equals the number of nodes to be matched. The final step is then to find the assignment, and this is easily done by first assigning the edge corresponding to one of the zero entry, which in this example, could be (P1,T2) by picking the first zero in the first row. We cannot therefore assign T2 to anyone else, so the second zero in the T2 column can be removed. The only remaining zero in the P4 row says it must be assigned to T1, so the next assignment is (P4,T1). The second zero in T1 column can now be removed, and the P2 row then only has one zero. The third assignment then is (P2,T3). The final assignment is therefore (P3,T4). The reader can compute the total cost by adding up all the edge weights corresponding to these assignments, and the result will be 36.
This assignment process is much more intuitive if we look at the GIF animation, where we have a subgraph that connects all the nodes, and we can create an alternating path where the edges alternate between matched (green) and unmatched (red).
Now that we have seen the Hungarian algorithm in action on the adjacency matrix, do we know why the steps are what they are? What exactly does creating the minimum number of lines to cover the zeros tell us? Why is it that the minimum number of lines must equal the number of nodes to be matched for the algorithm to stop? How do we understand this weird rule in step 3 that to create additional zeros, we find the uncovered minimum, subtract it from all uncovered entries while adding it to the entries covered twice?
To get better insights, we need to see how the Hungarian algorithm works on the graph. To do that, we need to view the optimum assignment problem as matching the demand and supply. This requires creating labels for each notes that represent the amount of supply and demand.
We now need some notations to explain this process of labelling. There are two different sets of nodes in the bipartite graph, let us call them X and Y. All the nodes that belong to the set X is denoted x and nodes that belong to Y are written as y. The labels then are l(x) and l(y), and the cost of the edges connecting x and y is w(x,y). The labeling has to be feasible, which means l(x)+l(y)≤w(x,y) when we want to minimize the cost and l(x)+l(y)≥w(x,y) if we want to maximize the cost.
In our example, the demand from people is that they must get the taxi immediately, with zero wait time. The supply from taxi is the time it takes to get to these people. The initial feasible labelling is then to take the minimum time it takes for each taxi to get to any of the four people and add that as the label for the taxis, and have zeros as the labels for the people.
Once we have the feasible labelling, we can now create an equality subgraph, where we only pick those edges where we have equality: l(x)+l(y)=w(x,y). The initial labeling and the resulting equality subgraph (with highlighted edges) are shown in the image.
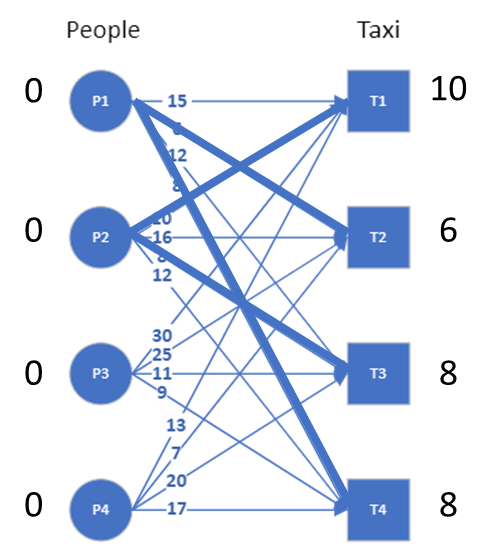
We see that there are nodes that are not connected in this equality subgraph and to fix this, we need to revise the labeling. We do that by looking at each of the nodes that are not connected, and updating the labels of those nodes using the minimum number by which the label can be updated to create a connection.
In our example, P3 cannot be connected if its label is 0. The minimum value by which this label can be increased to make a connection is 1, and this is found by looking at the minimum slack (Δ=w(x,y)-(l(x)+l(y))) we have on each of the edges connected to P3 in the original graph. Similarly for P4, the label is updated based on the minimum slack on its edges. The resulting equality graph after this label revision is shown in the image.
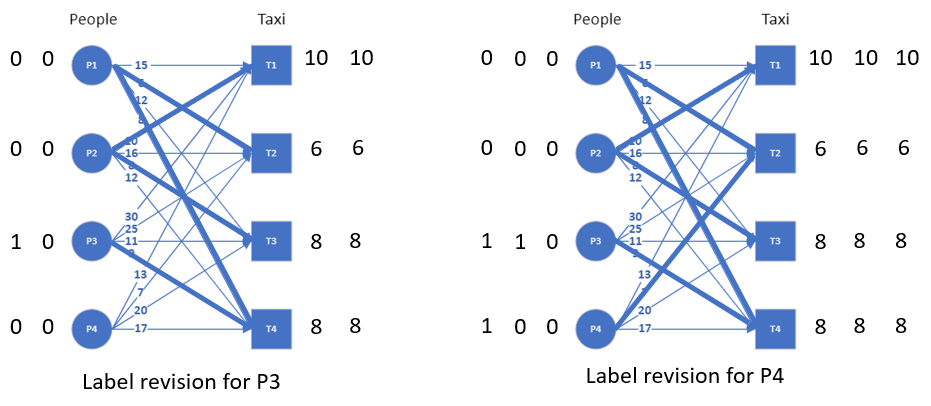
We can now try to find a matching on the equality subgraph and we will see that only 3 nodes can be matched. This is because we don’t yet have an alternating path in the equality graph that connects all the nodes. Since there are not enough edges to create such an alternating path, we need to revise the labels again to add additional edges. But this time, the equality subgraph has already connections to all the nodes. So the edge we add this time should help extend the alternating path.
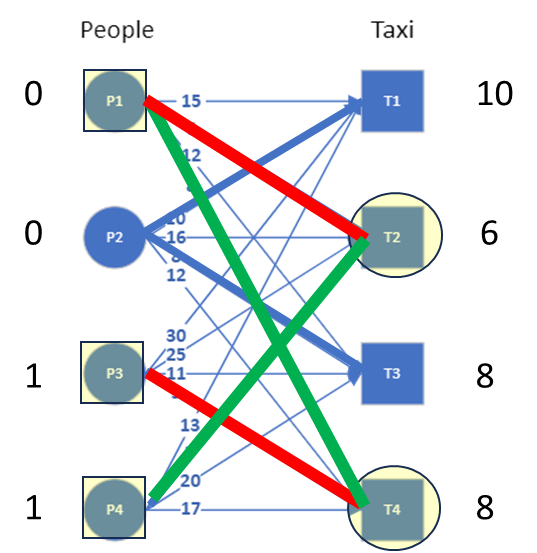
We look at all the nodes connected by this alternating path (shown in the image with red and green edges) and ask the question: what is the minimum slack by which the labels of these nodes can be revised to add an edge. To find that minimum slack, we look at the slack for all the edges connected to the X nodes that are not in the alternating path, as shown by the next image, and compute the minimum. For this example, the minimum slack comes out to be 2 (from the edge P3-T3).
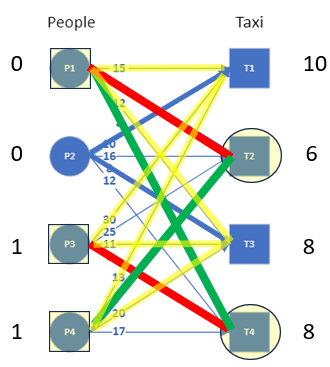
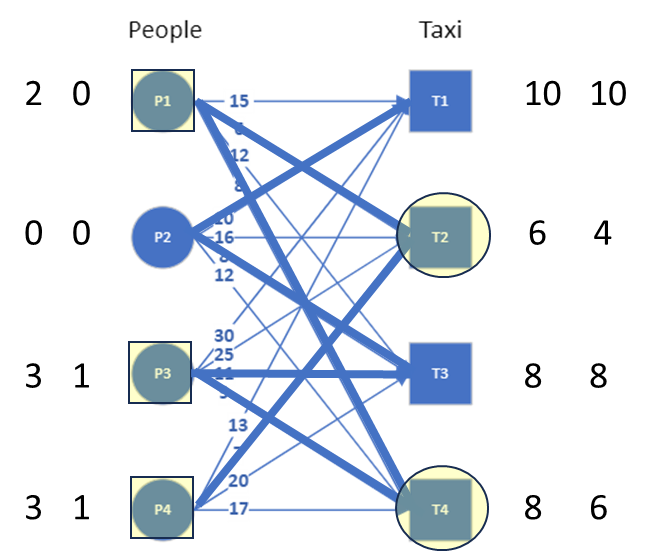
The labels of all the nodes in the alternating path needs to be updated, but when we adjust the demand (by adding the minimum slack to it), we need to also reduce it from the supply (by subtracting the minimum slack from it) so that the existing edges of the equality graph does not change. The revised labeling and the updated equality graph are seen in the image.
We can now see that there is an alternating path available that connects all nodes. The matching can now be found by using the alternating path and alternating between matched and unmatched edges (see image). Note that the alternating path has two edges connected to each node. The numbers below the nodes shows the order in which the alternating path connects these nodes.
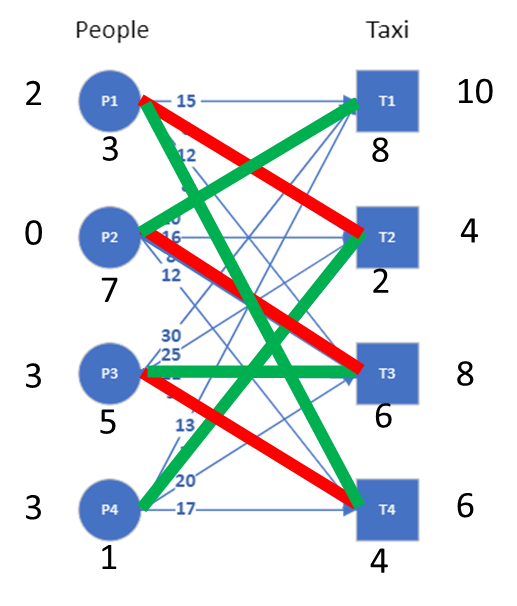
The assignment can be read out from this graph by picking all the edges that are highlighted in green. That is (P1,T4), (P2,T1), (P3,T3) and (P4,T2) resulting in a total cost of 8+10+11+7 = 36. An animation of the whole process can be seen in the GIF here.
We see from the Hungarian algorithm on the graph that we are always adjusting the supply and demand only by the minimum required value to add one additional edge. This process therefore guarantees that we end up with the optimum cost. There is a clear mathematical formulation and proof for this in many sources on the web, but the mathematical formulations for the graph is not straightforward to follow since we have to keep track of the subgraphs and the subsets. An example that shows the process really helps, at least I hope it does.
We also see parallels to the steps we did on the adjacency matrix. With the insights gained by applying the algorithm on the graph, we can see that the minimum number of lines to cover zeros need to be equal to the number of nodes to be matched to ensure maximum matching. The rule to create additional zeros in the adjacency matrix provides no intuition, but the revision of labels on the graph based on the minimum slack on edges that are not included in the alternating path immediately provides the connection.
Having said all this, the algorithm operating on the matrix is simpler to understand implement, which is why there is a lot of information on web that pertains to explaining the Hungarian algorithm this way. But I hope that some of you agree with me that once we see the Hungarian algorithm operating on the graph, the level of clarity that provides is essential to a comfortable understanding of this wonderfully simple algorithm.
That brings us to the end of this writeup. There is also a video of me presenting this material, but it is 45 minutes long since I seem to speak more slowly as I age. Perhaps I will link the video here someday.
Optimum Assignment and the Hungarian Algorithm was originally published in Towards Data Science on Medium, where people are continuing the conversation by highlighting and responding to this story.
Originally appeared here:
Optimum Assignment and the Hungarian Algorithm
Go Here to Read this Fast! Optimum Assignment and the Hungarian Algorithm
