The Math Behind Risk — Part 1
Does the attack really have an advantage in the game of world conquest?
A good friend of mine (Hey, Aron) recently asked me what the probabilities are for the attack and defense in the board game Risk. I know that the conquests of Alexander the Great and Genghis Khan cannot be fully explained by the mechanics of Risk, but it still seemed like an intriguing question, and it provides an excellent illustration of the capacity of probability and data visualization to inform and power intelligent decision making.

For those who don’t know, Risk is a board game of world conquest where the attacker rolls (up to) three dice and the defender rolls (up to) two dice. The player whose highest roll is lower loses a soldier, and a tie goes to the defender. We will refer to this as the first battle. If both players are rolling at least two dice, then the player whose second highest roll is lower will also lose a soldier. Once again, a tie goes to the defender. We will call this the second battle.
Of course, it’s clearly an advantage to throw 3 dice instead of 2, and the favorability of winning in the case of a tie is equally obvious. What’s less obvious is how these advantages stack up against each other.
(Here you can find code in which I confirm the below probabilities.)
Before analyzing the relative probabilities of defense and attack, let’s first analyze each of them in isolation.
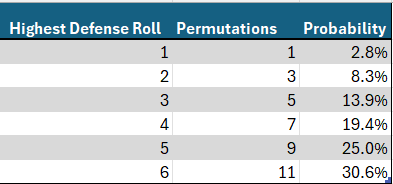
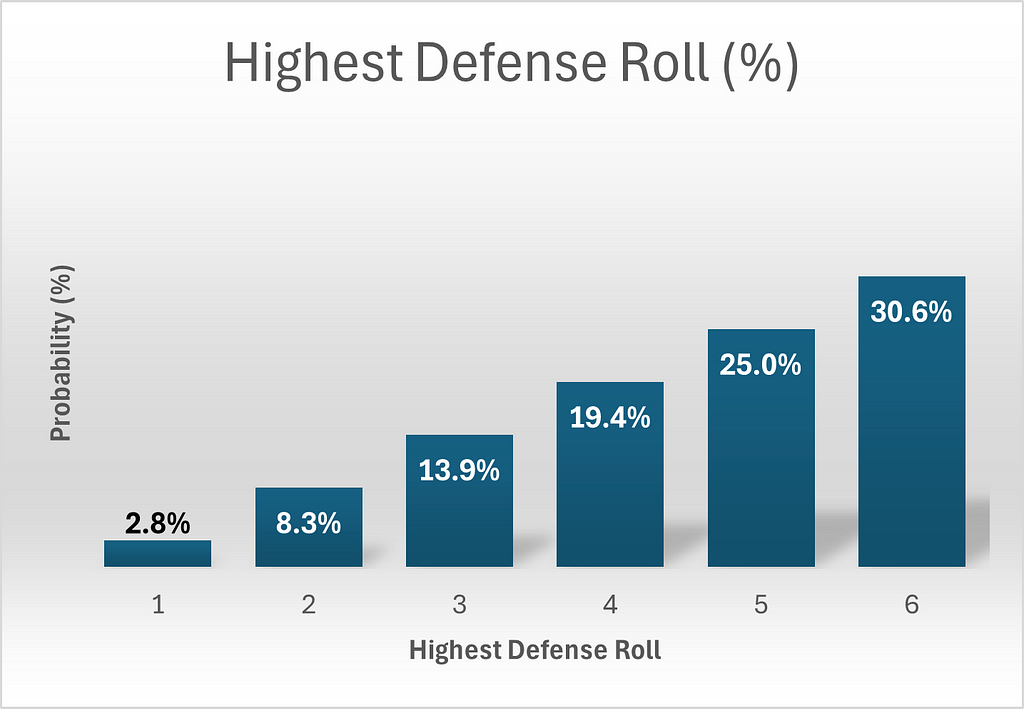
The defender’s turn is simpler as he rolls only two dice, so let’s start there. There are 11 permutations yielding a highest roll of 6. This can be calculated by considering all the possibilities: {(1,6), (2,6), (3,6), (4,6), (5,6), (6,1), (6,2), (6,3), (6,4), (6,5), (6,6)}. By similar logic, the number of permutations giving highest rolls of 5, 4, 3, 2 or 1 can be calculated as 9, 7, 5, 3 and 1 respectively. Since there are a total of 6 x 6 = 36 total permutations for 2 dice, we need only divide each permutation count by 36 to obtain probabilities. The below graphics should be helpful. Please note that in all the graphics, red denotes attack and blue denotes defense, in keeping with the color scheme of Risk itself.
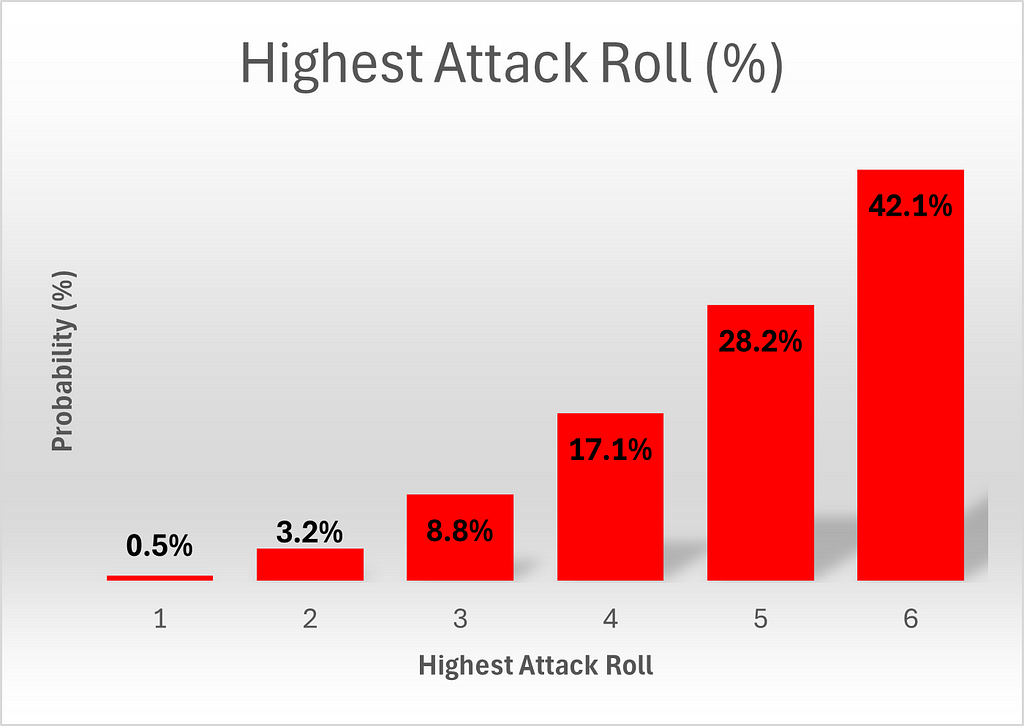
The highest roll of the attacker is slightly more complex, as he rolls 3 dice. To calculate how many permutations yield a highest roll of 6, let’s start by fixing the highest roll at 6 and let’s further stipulate that it occurs at die 1. It’s then clear that dice two and three can be anything up to 6, for a total of 6*6 = 36 outcomes. If we next fix the highest outcome of 6 at die 2, we must limit the first die to not being six, since we already considered that possibility. The third die can be anything, for a total of 6×5=30 additional outcomes. Finally, we can fix the highest outcome of 6 at the third die, and we know that we must limit the first two dice to not being six, since those possibilities have already been counted. This yields a further 25 outcomes, for a total of 36+30+25 = 91 of possibilities.
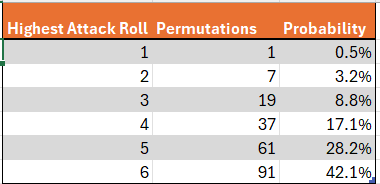
We can generalize this to calculate the number of outcomes yielding a highest roll of x. If the highest roll occurs at die 1, the second and third die can take any outcome up to and including x, for a total of x² outcomes. If, alternatively, the highest roll occurs at die 2, die 1 can take any value up to x-1, (since we have already considered the case where the first die takes a value of x) and the third die can take any value up to x, for a total of x(x-1)=x²-x additional outcomes. Finally, we consider the option of die three taking the value x. Then the only options not yet counted are for the first and second dice to each take a value up to x-1, adding (x-1)*(x-1) = x²–2x+1 outcomes. Adding everything up, we obtain a total of 3x²–3x+1 ways¹ to obtain a highest roll of x.
Note that the total number of permutations is 216, as expected, since 6³ = 216, which gives confidence that these calculations are correct.
Next, let’s directly compare the chances for attack and defense.
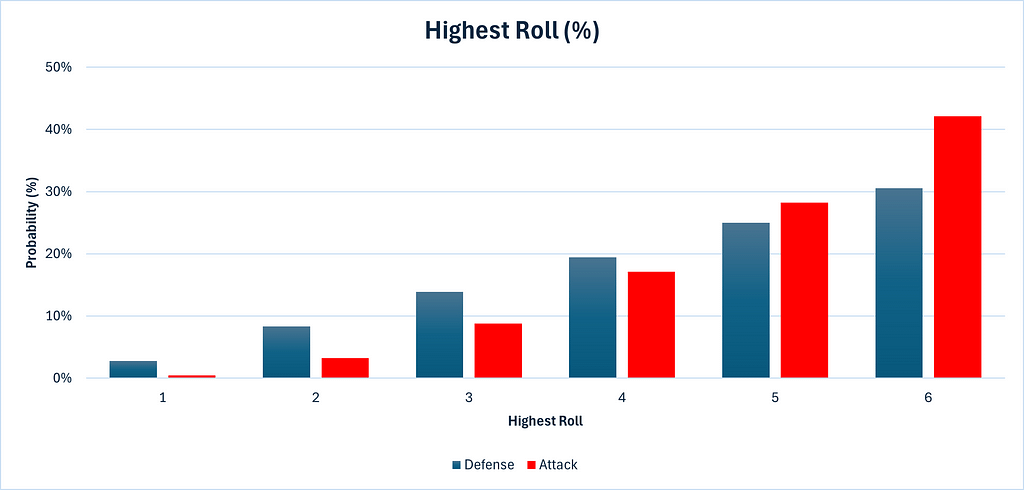
We can see that the defense has a higher chance of getting 1, 2, 3 and 4 as a highest roll than attack does, while attack has a higher chance of getting 5 or 6 as the highest roll than his opponent. This is the 3rd die working in the attack’s favor.
Enough stalling, let’s get to the battle.
We must consider the two battles separately. In Part 1, we will analyze the first battle, of who will win the highest roll, and we will leave the analysis of the second battle, for the 2nd highest roll, for Part 2.
To calculate the probability of the attacker winning the highest roll, we will first count the permutations in which the defender achieves a highest roll of x and calculate how many of those permutations would result in an outright win for the defense, a tie, which goes to the defense, or a win for the attack.
For example, since, as calculated above, there is a 9/36 chance of the defense’s highest roll being 5, and there are a total of 6⁵ = 7776 permutations, clearly (9/36) * 7776 = 1944 of those permutations will yield a highest defense roll of 5. To win, the attack then needs to get a highest roll of 6, the probability of which is 91/216, as calculated above, so (91/216) * 1944 = 819 of the 1944 permutations which yielded a highest defense roll of 6 will result in a victory for attack. To achieve a tie, attack must roll a highest roll of 5, the probability of which is 61/216, so (61/216) * 1944 = 549 of those permutations will result in ties, and the remainder (1944–819–549 = 576) will result in outright defense wins.
We can make similar calculations for all possible outcomes for defense. See the below table.

We can then calculate the conditional² probability of a defense victory, of a tie, and of an attack victory, by dividing the number of permutations yielding the selected outcome (e.g. attack wins) by the count of the broader group of outcomes (e.g. defense rolls a highest roll of 5).

We can also visualize the conditional probabilities.
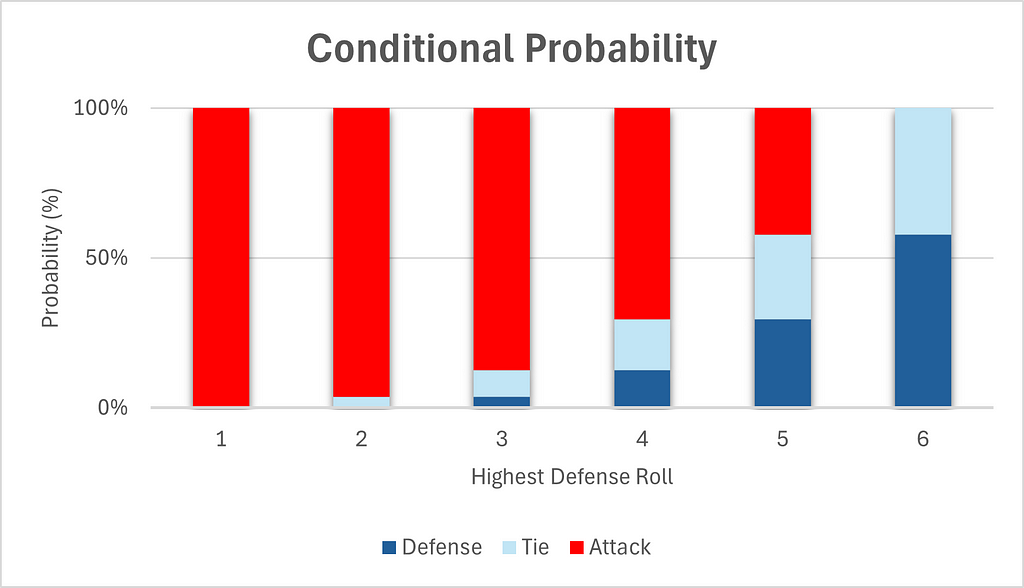
Chart 4 gives the same false impression that most people have initially, namely that attack has a big advantage overall. But this is because it ignores the probabilities of the highest defense rolls themselves. In fact, higher rolls are significantly more likely than lower rolls, as can be seen in Table 3.
For this reason, total probabilities are a more effective measure. It is even simpler to calculate the total probability of each outcome. We simply divide each permutation count by the total number of possible permutations, which is 7776.
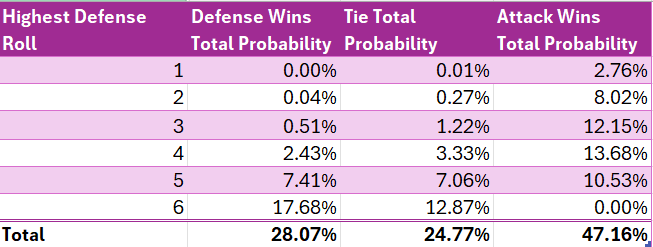
We can then sum the total permutations which result in a victory for the attack (3667) and divide by the total possible permutations (7776) to obtain a win probability of 47.15% for the attack.
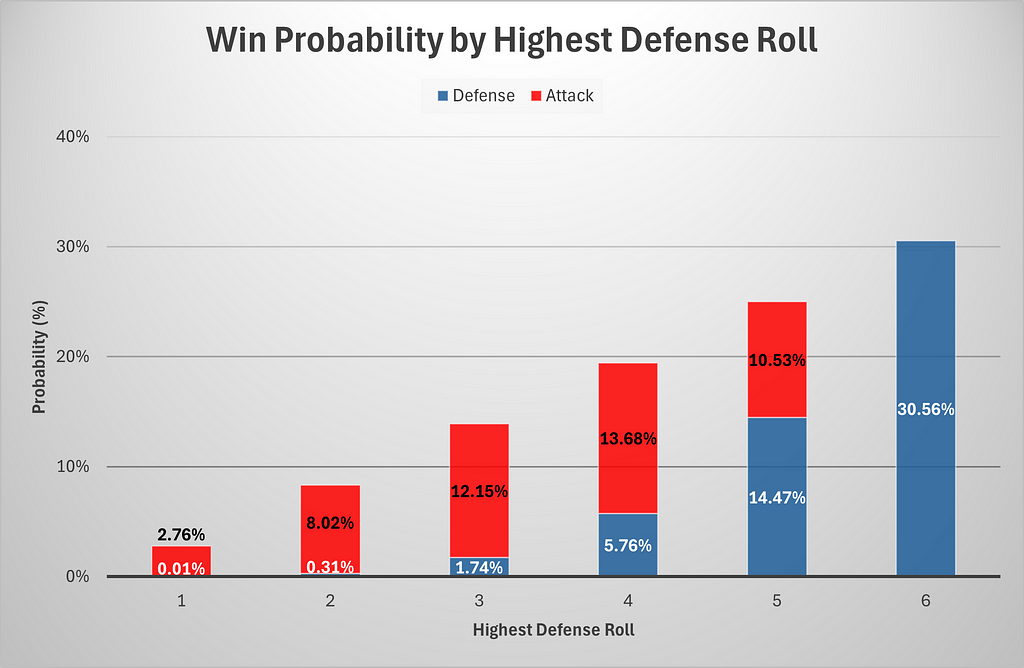
Below is a chart of total win probabilities by highest defensive roll. We include a tie as part of a defense victory for simplicity.
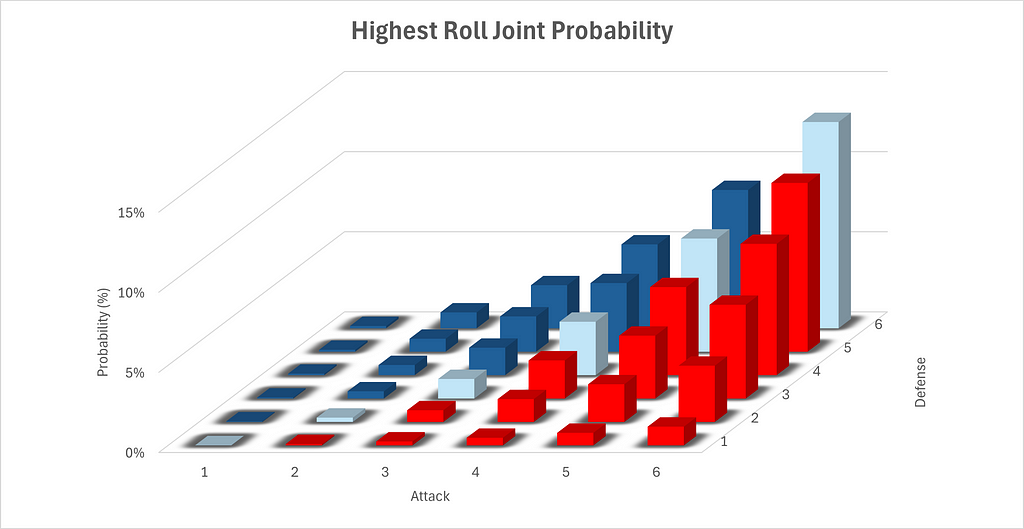
Finally, we will calculate the joint³ probabilities of each possible highest roll for both defense and attack. Since the highest roll for attack and defense are independent, we can simply multiply the probabilities together to obtain the joint probability. Note that in the below two graphics, red indicate victory for the attack, while blue denotes a defensive victory and pale blue indicates a tie, which goes to the defense.

We can also graph this data visually. Please note the configurations of the axes in the below chart, which have been configured to allow for maximal visibility.
Conclusions
- The probability of a victory for the attack is 47.15%. This can be seen clearly in Table 5. We go through the formal math in the footnotes⁴.
- The probability of an outright victory for the defense is 28.07%. This can be seen clearly in Table 5.
- The probability of a tie, which goes to the defense of course, is 24.77%. This can be seen clearly in Table 5.
- If the defense’s highest roll is four, he/she has only a 29.63% chance of winning. This can be calculated by summing the defense win probabilities on row 4 of Table 6 and dividing by the row total.
- In order for the defense to have a greater chance of winning outright than attack, he needs to get a highest roll of 6. This can be seen on rows 5 and 6 of Table 3 and Table 4.
- The most likely overall outcome, at 12.87% is for both attack and defense to roll highest rolls of 6, giving defense the victory. This can be seen clearly in Table 6.
- Of the cases in which the attack wins, the most commonly occurring way for this to happen is for the defense to roll a highest roll of 4. This case constitutes 29.02% of attack’s victories. This can be calculated by observing the attack percentage for a defense roll of 4 in Table 5 and dividing by the column total.
- Only 5.86% of attack’s victories come in cases where the defense’s highest roll is 1. The subtle, almost paradoxical point here is that if defense’s highest roll was 1, you can be almost sure (99.54%) that attack wins, but if attack wins, you can still be confident (94.14%) that defense did not roll a highest roll of 1, although admittedly, not as confident as you were (97.2%) before you found out that attack won. (Probability is awesome.) The first number can be calculated from Table 5. The second number is taken directly from Table 4. The third is the complement of the first, and the fourth can be calculated from Table 1.
So the attack is actually at a disadvantage for the first battle. So how was Genghis Khan able to rout his enemies so effectively in war? Perhaps this points to greater subtleties awaiting us in the matter of the second battle. Or maybe this demonstrates a breakdown in the ability of Risk to explain history’s greatest conquests. Or perhaps, even more tantalizingly, both?
See you in Part 2.
- For the mathematically inclined, this seems to indicate that the sum of 3x²-3x+1 for all x up to and including k is equal to k³, to satisfy the obvious requirement that summing the permutations yielding a highest value of x, for all x up to k, must equal the total number of permutations available with 3 dice yielding k alternatives. And indeed, a simple proof by induction yields this result. Clearly this holds for the base case of 1, since 3(1)²-3(1)+1 = ¹³. Then we must prove that the sum of 3x²-3x+1 for all x up to and including k is equal to k³, using the assumption that the sum of 3x²-3x+1 for all x up to and including k-1 is equal to (k-1)³. Since (k-1)³ = k³-3k²+3k-1, clearly adding 3k²-3k+1 will equal k³. QED.
- Conditional probability means the probability given some condition. For example, if the defense rolls a highest roll of 6, then the attack has a conditional probability of victory of 0%, since he cannot win in that case. But that’s only if the defense rolls a highest roll of 6.
- Joint probability simply means the probability of two events co-occurring.
- To formalize the math, we need some notation. Let A₁ and D₁ refer to the highest dice rolls of the attack and defense, respectively. Furthermore, let d indicate possible highest rolls of defense, which obviously can take any value between one and six. Then the probability of a win for attack can be calculated by calculating the below summation:

The Math Behind Risk — Part 1 was originally published in Towards Data Science on Medium, where people are continuing the conversation by highlighting and responding to this story.
Originally appeared here:
The Math Behind Risk — Part 1