An interpretable classifier
Very often in when working on classification or regression problems in machine learning, we’re strictly interested in getting the most accurate model we can. In some cases, though, we’re interested also in the interpretability of the model. While models like XGBoost, CatBoost, and LGBM can be very strong models, it can be difficult to determine why they’ve made the predictions they have, or how they will behave with unseen data. These are what are called black-box models, models where we do not understand specifically why the make the predictions they do.
In many contexts this is fine; so long as we know they are reasonably accurate most of the time, they can be very useful, and it is understood they will be incorrect on occasion. For example, on a website, we may have a model that predicts which ads will be most likely to generate sales if shown to the current user. If the model behaves poorly on the rare occasion, this may affect revenues, but there are no major issues; we just have a model that’s sub-optimal, but generally useful.
But, in other contexts, it can be very important to know why the models make the predictions that they do. This includes high-stakes environments, such as in medicine and security. It also includes environments where we need to ensure there are no biases in the models related to race, gender or other protected classes. It’s important, as well, in environments that are audited: where it’s necessary to understand the models to determine they are performing as they should.
Even in these cases, it is sometimes possible to use black-box models (such as boosted models, neural networks, Random Forests and so on) and then perform what is called post-hoc analysis. This provides an explanation, after the fact, of why the model likely predicted as it did. This is the field of Explainable AI (XAI), which uses techniques such as proxy models, feature importances (e.g. SHAP), counterfactuals, or ALE plots. These are very useful tools, but, everything else equal, it is preferable to have a model that is interpretable in the first place, at least where possible. XAI methods are very useful, but they do have limitations.
With proxy models, we train a model that is interpretable (for example, a shallow decision tree) to learn the behavior of the black-box model. This can provide some level of explanation, but will not always be accurate and will provide only approximate explanations.
Feature importances are also quite useful, but indicate only what the relevant features are, not how they relate to the prediction, or how they interact with each other to form the prediction. They also have no ability to determine if the model will work reasonably with unseen data.
With interpretable models, we do not have these issues. The model is itself comprehensible and we can know exactly why it makes each prediction. The problem, though, is: interpretable models can have lower accuracy then black-box models. They will not always, but will often have lower accuracy. Most interpretable models, for most problems, will not be competitive with boosted models or neural networks. For any given problem, it may be necessary to try several interpretable models before an interpretable model of sufficient accuracy can be found, if any can be.
There are a number of interpretable models available today, but unfortunately, very few. Among these are decision trees, rules lists (and rule sets), GAMs (Generalized Additive Models, such as Explainable Boosted Machines), and linear/logistic regression. These can each be useful where they work well, but the options are limited. The implication is: it can be impossible for many projects to find an interpretable model that performs satisfactorily. There can be real benefits in having more options available.
We introduce here another interpretable model, called ikNN, or interpretable k Nearest Neighbors. This is based on an ensemble of 2d kNN models. While the idea is straightforward, it is also surprisingly effective. And quite interpretable. While it is not competitive in terms of accuracy with state of the art models for prediction on tabular data such as CatBoost, it can often provide accuracy that is close and that is sufficient for the problem. It is also quite competitive with decision trees and other existing interpretable models.
Interestingly, it also appears to have stronger accuracy than plain kNN models.
The main page for the project is: https://github.com/Brett-Kennedy/ikNN
The project defines a single class called iKNNClassifier. This can be included in any project copying the interpretable_knn.py file and importing it. It provides an interface consistent with scikit-learn classifiers. That is, we generally simply need to create an instance, call fit(), and call predict(), similar to using Random Forest or other scikit-learn models.
Using, under the hood, using an ensemble of 2d kNN’s provides a number of advantages. One is the normal advantage we always see with ensembling: we get more reliable predictions than when relying on a single model.
Another is that 2d spaces are straightforward to visualize. The model currently requires numeric input (as is the case with kNN), so all categorical features need to be encoded, but once this is done, every 2d space can be visualized as a scatter plot. This provides a high degree of interpretability.
And, it’s possible to determine the most relevant 2d spaces for each prediction, which allows us to present a small number of plots for each record. This allows fairly simple as well as complete visual explanations for each record.
ikNN is, then, an interesting model, as it is based on ensembling, but actually increases interpretability, while the opposite is more often the case.
Standard kNN Classifiers
kNN models are less-used than many others, as they are not usually as accurate as boosted models or neural networks, or as interpretable as decision trees. They are, though, still widely used. They work based on an intuitive idea: the class of an item can be predicted based on the class of most of the items that are most similar to it.
For example, if we look at the iris dataset (as is used in an example below), we have three classes, representing three types of iris. If we collect another sample of iris and wish to predict which of the three types of iris it is, we can look at the most similar, say, 10 records from the training data, determine what their classes are, and take the most common of these.
In this example, we chose 10 to be the number of nearest neighbors to use to estimate the class of each record, but other values may be used. This is specified as a hyperparameter (the k parameter) with kNN and ikNN models. We wish set k so as to use to a reasonable number of similar records. If we use too few, the results may be unstable (each prediction is based on very few other records). If we use too many, the results may be based on some other records that aren’t that similar.
We also need a way to determine which are the most similar items. For this, at least by default, we use the Euclidean distance. If the dataset has 20 features and we use k=10, then we find the closest 10 points in the 20-dimensional space, based on their Euclidean distances.
Predicting for one record, we would find the 10 closest records from the training data and see what their classes are. If 8 of the 10 are class Setosa (one of the 3 types of iris), then we can assume this row is most likely also Setosa, or at least this is the best guess we can make.
One issue with this is, it breaks down when there are many features, due to what’s called the curse of dimensionality. An interesting property of high-dimensional spaces is that with enough features, distances between the points start to become meaningless.
kNN also uses all features equally, though some may be much more predictive of the target than others. The distances between points, being based on Euclidean (or sometimes Manhattan or other distance metrics) are calculated considering all features equally. This is simple, but not always the most effective, given many features may be irrelevant to the target. Assuming some feature selection has been performed, this is less likely, but the relevance of the features will still not be equal.
And, the predictions made by kNN predictors are uninterpretable. The algorithm is quite intelligible, but the predictions can be difficult to understand. It’s possible to list the k nearest neighbors, which provides some insight into the predictions, but it’s difficult to see why a given set of records are the most similar, particularly where there are many features.
The ikNN Algorithm
The ikNN model first takes each pair of features and creates a standard 2d kNN classifier using these features. So, if a table has 10 features, this creates 10 choose 2, or 45 models, one for each unique pair of features.
It then assesses their accuracies with respect to predicting the target column using the training data. Given this, the ikNN model determines the predictive power of each 2d subspace. In the case of 45 2d models, some will be more predictive than others. To make a prediction, the 2d subspaces known to be most predictive are used, optionally weighted by their predictive power on the training data.
Further, at inference, the purity of the set of nearest neighbors around a given row within each 2d space may be considered, allowing the model to weight more heavily both the subspaces proven to be more predictive with training data and the subspaces that appear to be the most consistent in their prediction with respect to the current instance.
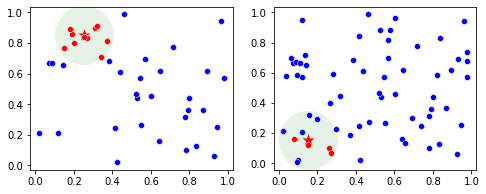
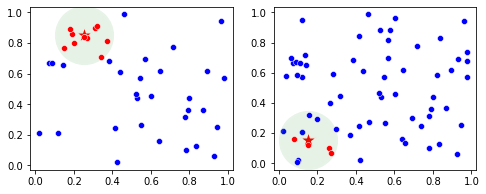
Consider two subspaces and a point shown here as a star. In both cases, we can find the set of k points closest to the point. Here we draw a green circle around the star, though the set of points do not actually form a circle (though there is a radius to the kth nearest neighbor that effectively defines a neighborhood).

These plots each represent a pair of features. In the case of the left plot, there is very high consistency among the neighbors of the star: they are entirely red. In the right plot, there is no little consistency among the neigbhors: some are red and some are blue. The first pair of features appears to be more predictive of the record than the second pair of features, which ikNN takes advantage of.
This approach allows the model to consider the influence all input features, but weigh them in a manner that magnifies the influence of more predictive features, and diminishes the influence of less-predictive features.
Example
We first demonstrate ikNN with a toy dataset, specifically the iris dataset. We load in the data, do a train-test split, and make predictions on the test set.
from sklearn.datasets import load_iris
from interpretable_knn import ikNNClassifier

iris = load_iris()
X, y = iris.data, iris.target

clf = ikNNClassifier()
X_train, X_test, y_train, y_test = train_test_split(
   X, y, test_size=0.33, random_state=42)
clf.fit(X_train, y_train)
y_pred = clf.predict(X_test)
For prediction, this is all that is required. But, ikNN also provides tools for understanding the model, specifically the graph_model() and graph_predictions() APIs.
For an example of graph_model():
ikNN.graph_model(X.columns)

This provides a quick overview of the dataspace, plotting, by default, five 2d spaces. The dots show the classes of the training data. The background color shows the predictions made by the 2d kNN for each region of the 2d space.
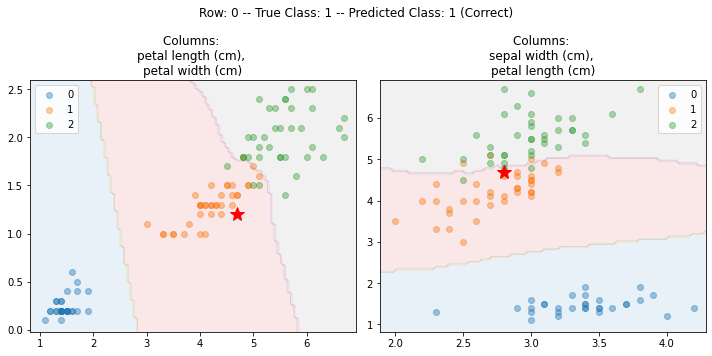
The graph_predictions() API will explain a specific row, for example:

Here, the row being explained is shown as a red star. Again, by default, five plots are used by default, but for simplicity, this uses just two. In both plots, we can see where Row 0 is located relative to the training data and the predictions made by the 2D kNN for this 2D space.
Visualizations
Although it is configurable, by default only five 2d spaces are used by each ikNN prediction. This ensures the prediction times are fast and the visualizations simple. It also means that the visualizations are showing the true predictions, not a simplification of the predictions, ensuring the predictions are completely interpretable
For most datasets, for most rows, all or almost all 2d spaces agree on the prediction. However, where the predictions are incorrect, it may be useful to examine more 2d plots in order to better tune the hyperparameters to suit the current dataset.
Accuracy Tests
A set of tests were performed using a random set of 100 classification datasets from OpenML. Comparing the F1 (macro) scores of standard kNN and ikNN models, ikNN had higher scores for 58 datasets and kNN for 42.
ikNN’s do even a bit better when performing grid search to search for the best hyperparameters. After doing this for both models on all 100 datasets, ikNN performed the best in 76 of the 100 cases. It also tends to have smaller gaps between the train and test scores, suggesting more stable models than standard kNN models.
ikNN models can be somewhat slower, but they tend to still be considerably faster than boosted models, and still very fast, typically taking well under a minute for training, usually only seconds.
The github page provides some more examples and analysis of the accuracy.
Conclusions
While ikNN is likely not the strongest model where accuracy is the primary goal (though, as with any model, it can be on occasion), it is likely a model that should be tried where an interpretable model is necessary.
This page provided the basic information necessary to use the tool. It simply necessary to download the .py file (https://github.com/Brett-Kennedy/ikNN/blob/main/ikNN/interpretable_knn.py), import it into your code, create an instance, train and predict, and (where desired), call graph_predictions() to view the explanations for any records you wish.
All images are by author.
Interpretable kNN (ikNN) was originally published in Towards Data Science on Medium, where people are continuing the conversation by highlighting and responding to this story.
Originally appeared here:
Interpretable kNN (ikNN)
