Arsenal vs Crystal Palace is one of the biggest Premier League matchups of the weekend, and we’ve got all the information you need to watch the game for free.
The Bitcoin and digital asset mining firm Hut 8 responded to a recent critical report in a statement on Jan. 19. The mining company wrote: “Hut 8 Corp is aware of a short report … by J Capital Research, which is a self-proclaimed group of biased activists who clearly disclose that they will profit if […]
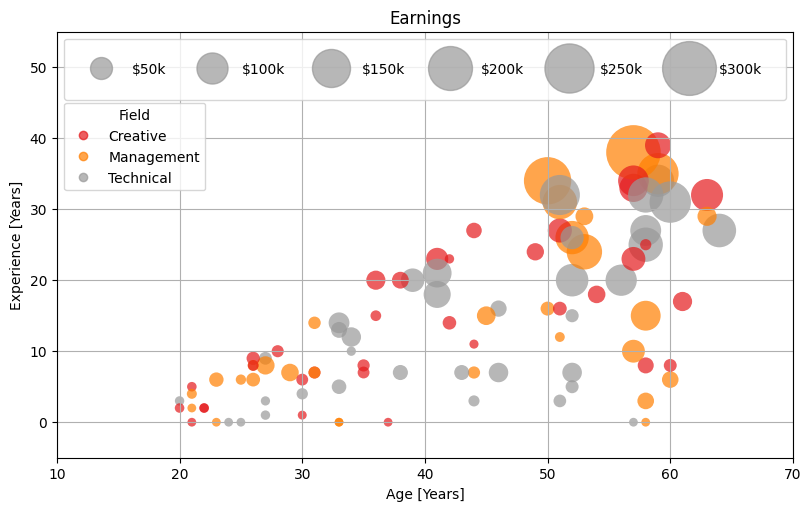
Why do marketers turn to spreadsheets and how to close this gap
Mind the gap (image by author)
Marketing is often the main use case for analytics. Most performance marketers are data-driven and -literate. They want to use data to optimize their campaigns and achieve their ROI targets.
However, self-service analytics is falling short. Especially for sophisticated and complex marketing teams running thousands of campaigns for various products across multiple markets and channels.
Let’s analyze the gap between expectation and reality.
The expectation
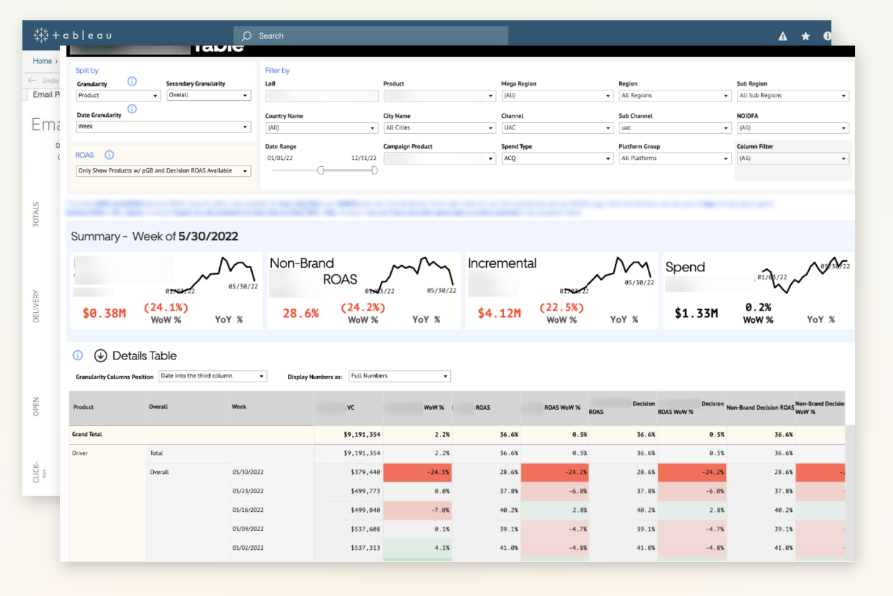
The expectation — BI tool dashboards as the single source of truth for marketing analytics (image by author)
Data teams are responsible for marketing dashboards, scoping the requirements and needs of each team. They build a single source of truth including all data across brands and categories in one place, accessible to marketers on the BI dashboards.
The expectation is that high-level dashboards and core deep dives will be sufficient and spreadsheets will go away.
This expectation breaks easily apart…
The reality
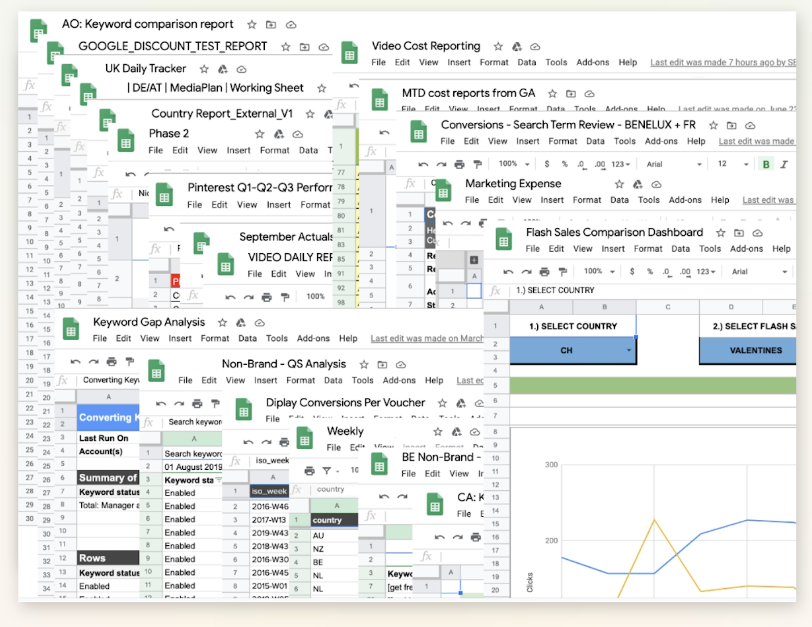
The reality — marketers run analytics on spreadsheets (image by author)
Dashboards lack the granularity and flexibility for deep dives (e.g., keyword- or creative-level analysis) and are not well suited for specific marketing analyses like budgeting or pacing. Moreover, marketing is very fast-changing. Analytics needs change very quickly (e.g., new channel, new metric, new dimension).
Marketers depend on data teams for any updates such as changes to metrics or dimensions. Report requests wait for data teams’ prioritization, which takes too long.
Marketers can’t wait. They have budgets to manage and ROAS targets to achieve — the stakes are high.
The fallback solution? Spreadsheets.
Why do marketing teams keep going to spreadsheets?
“In our BI tool, we don’t have the data granularity that our marketing colleagues need. In order to optimize their campaigns, they need to get down to the creative and keyword level. —Data leader
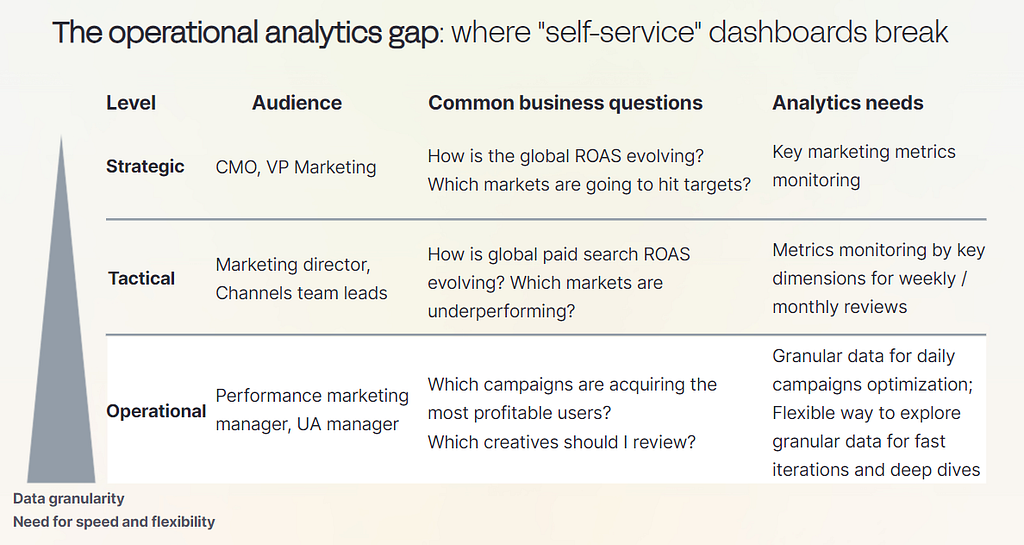
Dashboards are great for high-level metrics monitoring and basic deep dives, which meet the needs of managers, directors, and VPs. Daily and weekly operational decisions require more granularity and flexibility. This is why “self-service” dashboards break for operational use cases, typically owned by individual contributors like performance marketing managers and user acquisition managers.
The operational analytics gap: where “self-service” dashboards break (image by author)
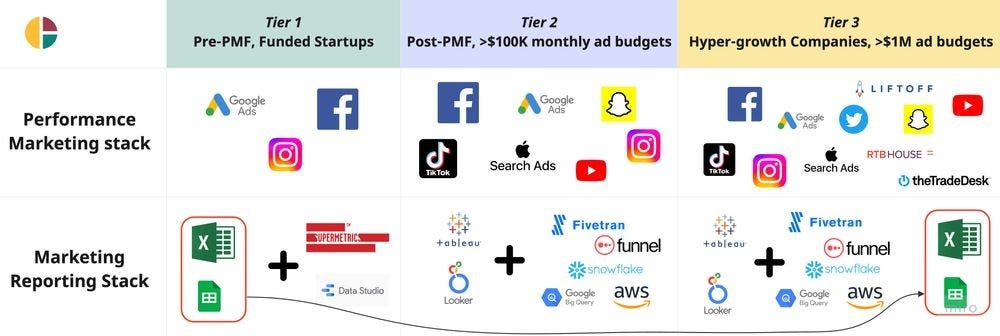
In the early days of any company, marketing analytics runs on spreadsheets. As the data team builds the modern data stack, the expectation is that spreadsheets will go away. And they often do for some time. However, at a later stage, when the company continues to grow, expand into new channels and markets, launch more campaigns, etc., there is a need for more granular analysis at the speed of business. That’s where spreadsheets come back.
The evolution of the performance marketing and reporting stacks over time (courtesy of Clarisights)
Spreadsheets are the go-to solution for performing granular analysis at the speed of business. Marketers have full control over them and can test their hypotheses with rapid feedback cycles.
Spreadsheets are a great addition to the available dashboards.
However, there are many shortcomings and drawbacks associated with this reality.
How this gap leads to missed opportunities
For marketing teams, this reality leads to wasted budget and suboptimal ROAS.
While budgets are decided at a higher level, the execution happens at the granular level of individual contributors. Performance Marketing Managers and User Acquisition Managers manage the campaigns, ultimately owning the ROAS metrics.
Spreadsheet-based analytics involve manual workflows, namely downloading data from channel platforms or using connectors tools, modeling the data, and running analyses. These manual processes and workflows are very time-consuming and error-prone.
Spreadsheets also lack data governance, leading to multiple sources of truth, silos, and mess. The common symptom is the typical question “Why don’t the numbers match?”
Managing significant marketing budgets on spreadsheets is far from ideal. Now that we understand how this reality leads to missed opportunities, let’s think about how to close this gap.
How to close this gap
Closing this gap often requires work across the 4 key elements (culture, people, tools, processes). Where to start and what to prioritize depends on your current situation. That’s where you should start: deeply understand how your marketers are running their analysis. Don’t just ask them. Instead, sit next to them and let them walk you through their daily and weekly workflows. This will enable you to understand where to start and map out the gap between your current situation and the ideal world.
How you should NOT approach this challenge
Data teams are sometimes bothered by this situation or simply ignore it. This is not the way to solve this problem. Avoid getting emotionally attached to the dashboards and solutions you‘ve built. Also, avoid simplistic explanations like “marketers don’t know how to use our BI tool. That’s why they use spreadsheets”. These pitfalls lead to interpersonal friction, making the problem worse.
Instead, seek to understand the current situation by getting close to the marketing team. See this gap as a big opportunity to have a significant business impact and improve the ROI of data.
Below, I’m sharing some generic best practices to tackle this gap.
Best practices
While specific action points depend on your context, here are a few best practices across the 4 key elements:
Tools: Consider building or developing complementary tools suited for marketing-specific operational workflows. You should map out which needs can be covered by your dashboards and which use cases need more flexible and granular solutions. Ideally, you should aim to build or buy a comprehensive solution that combines the flexibility of spreadsheets with the scale and governance of BI solutions.
Culture: Promote a data culture of strong collaboration with the marketing team over giving up (i.e., the typical answer — “they don’t know how to use our BI tool”). Challenge existing assumptions and seek to understand why. Present a solid business case to tackle this opportunity and get executive buy-in.
People: Embed analysts into marketing teams to develop business and domain expertise. Foster strong relationships between these data analysts and marketers. Promote knowledge-sharing sessions about marketing needs, use cases, and workflows.
Processes: Develop best practices around ideal workflows (e.g., “What’s the best way to perform a keyword analysis). Also, ensure regular touchpoints with marketers to collect their feedback and align on what to work next. You should combine qualitative feedback (i.e., regular touch points) with quantitative approaches (e.g., quarterly surveys).
The hit reality competition series The Traitors is back for a new season, and we’ll tell you where you can watch four different version of The Traitors!
Today’s Wordle answer and hints for game #945, Saturday, January 20
Originally appeared here:
Today’s Wordle answer and hints for game #945, Saturday, January 20
We use cookies on our website to give you the most relevant experience by remembering your preferences and repeat visits. By clicking “Accept”, you consent to the use of ALL the cookies.
This website uses cookies to improve your experience while you navigate through the website. Out of these, the cookies that are categorized as necessary are stored on your browser as they are essential for the working of basic functionalities of the website. We also use third-party cookies that help us analyze and understand how you use this website. These cookies will be stored in your browser only with your consent. You also have the option to opt-out of these cookies. But opting out of some of these cookies may affect your browsing experience.
Necessary cookies are absolutely essential for the website to function properly. These cookies ensure basic functionalities and security features of the website, anonymously.
Cookie
Duration
Description
cookielawinfo-checkbox-analytics
11 months
This cookie is set by GDPR Cookie Consent plugin. The cookie is used to store the user consent for the cookies in the category "Analytics".
cookielawinfo-checkbox-functional
11 months
The cookie is set by GDPR cookie consent to record the user consent for the cookies in the category "Functional".
cookielawinfo-checkbox-necessary
11 months
This cookie is set by GDPR Cookie Consent plugin. The cookies is used to store the user consent for the cookies in the category "Necessary".
cookielawinfo-checkbox-others
11 months
This cookie is set by GDPR Cookie Consent plugin. The cookie is used to store the user consent for the cookies in the category "Other.
cookielawinfo-checkbox-performance
11 months
This cookie is set by GDPR Cookie Consent plugin. The cookie is used to store the user consent for the cookies in the category "Performance".
viewed_cookie_policy
11 months
The cookie is set by the GDPR Cookie Consent plugin and is used to store whether or not user has consented to the use of cookies. It does not store any personal data.
Functional cookies help to perform certain functionalities like sharing the content of the website on social media platforms, collect feedbacks, and other third-party features.
Performance cookies are used to understand and analyze the key performance indexes of the website which helps in delivering a better user experience for the visitors.
Analytical cookies are used to understand how visitors interact with the website. These cookies help provide information on metrics the number of visitors, bounce rate, traffic source, etc.
Advertisement cookies are used to provide visitors with relevant ads and marketing campaigns. These cookies track visitors across websites and collect information to provide customized ads.