The falling Bitcoin exchange reserve supported the idea of accumulation.
Bitcoin showed a bullish structure and is highly likely to break the $100k level in December.
Retail investor demand for Bitcoin has surged to its highest level since 2020, boosting market optimism.
Rising institutional interest suggested a potential push toward the $100K psychological
In depth SQL code for creating your own statistical test design
Image from Imagen 3
The $300 Million Button: How A/B Testing Changed E-Commerce Forever
I am sure a lot of people are aware of the $300 million button story. For those that are not aware of the story, it is about a major e-commerce platform losing millions in potential revenue due to customer drop-offs at checkout. This was a large online retailer, and a single button labeled “Register” when changed to “Continue,” with an option to register later, the company saw a $300 million increase in annual revenue. This case study was documented by UX expert Jared Spool )Source: UIE, Jared Spool, “The $300 Million Button”), showing how a minor change can drastically impact business outcomes.
Yet surprisingly, 58% of executives still rely on intuition when making business decisions, according to a PwC report (Source: PwC Global Data and Analytics Survey). I always believe that folks with industry knowledge and well-versed with business processes intuition is important but adds more value when combined with observed evidence of data and numbers in decision making. Champion-challenger testing is one such approach to decision-making that changes guesswork into scientific validation.
What Is Champion/Challenger Testing?
Champion/challenger testing (A/B testing) is a technique used in businesses to optimize processes and business operations by selecting best options that improve performance by increasing revenue, reduce costs, and enhance decision making. Champion here is the current operation or methodology that works best while challenger is the method or a new strategy you want to test against your champion to see if it works better or worse than your current process or strategy. Your champion challenger should have the same type of setup, like similar type of accounts or customer segments, to ensure you have an apples-to-apples comparison. It is important to know, what is the goal you are trying to achieve and know what your key performance indicators should be to measure the success of the test.
Implementation Through Oracle SQL: A Practical Guide
When implementing champion-challenger testing, I always wondered whether to rely on online calculators or invest in a database-driven SQL implementation. The answer depends on various factors but let us explore an SQL approach through a practical example. While going through the example, I will also be walking you through the importance of some of the variables and conditions to consider ensuring we have a solid champion-challenger testing created.
Imagine a collection agency wanting to test the effectiveness of leaving voicemail versus not leaving them. The current strategy involves no voicemails, and some believe leaving voicemails could improve metrics like contact rate and payment rate, but implementing this change across all accounts carries risks like potential reduction in contact rates, compliance considerations with leaving messages, resource costs of leaving voicemails, and a possible decrease in payment rates. Let us design a rigorous test to evaluate the hypothesis.
To begin our implementation, we need to create a structured foundation that will track our test from start to finish. I used Oracle SQL developer to write my SQL and for illustration purpose in the voicemail testing context, I assumed some of the key component values as mentioned below to generate voicemail champion-challenger test. Below are the details of what each of these key components mean:
Baseline Conversion Rate: Your current conversion rate for the metric you’re testing. In this specific voicemail test example, we are assuming 8% current payment rate as baseline conversion rate.
Minimum Detectable Effect (MDE): The smallest improvement in conversion rate you care about detecting. For voicemails, we want to see if we can improve the current conversion rate by 10% which is increasing to 8.8% (8% * (1 + 0.10) = 8.8%).
Statistical Significance Level: Typically set at 95%, meaning you’re 95% confident that your results are not due to chance.
Statistical Power: Often set at 80%, this is a measure of whether the test has enough data to reach a conclusive result.
Hypothesis / Tail type: a statement that predicts whether changing a certain variable will affect customer behavior. There are two types of hypotheses to consider or more known as tail tests:
a) One-tail test: This test is recommended only when you are testing if something is either only better than current performance or only worse than current performance. Voicemail testing with one-tail test means we only want to know if voicemails improve payment rates.
b) Two-tail test: This test is recommended in scenarios where you need to understand any change in performance. You are testing if something is either better or worse than current performance. Voicemail testing with two -tail test means we want to know if voicemails will increase or decrease payment rates.
As we do not know whether voicemails will increase or decrease payment rates, we will be going with a two-tailed test.
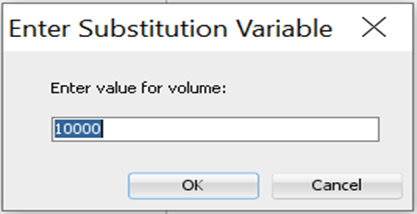
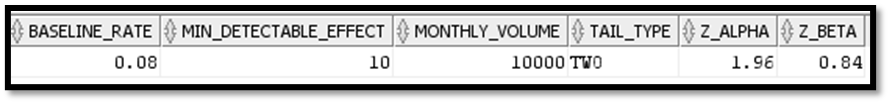
with test_parameters as(
    select
        0.08 as baseline_rate,       -- assuming current rate of 8% of payment rate
        10 as min_detectable_effect, -- wanting 10% improvement
        95 as significance_level,    -- 95% confidence level
        80 as statistical_power,     -- 80% statistical power
        'TWO' as tail_type,          -- 'ONE' or 'TWO' for tail type test
        &volume as monthly_volume    -- dynamic query to pull volume data can be used
        -- example: (select count(*) from accounts where assign_date>=add_months(sysdate,-1) )
    from dual
    )

   select * from test_parameters;
SQL prompt for monthly volume inputOutput Result
This above configuration is important because it records what we are testing and why. These metrics are the key components in sample size calculation. I will show you the sample size calculation, split ratio, months and days needed to run your test and finally the recommendation results for different monthly volumes available.
Sample Size Calculation
Using the right sample size is important to make sure your test results are statistically significant. A sample size that’s too small may result in inaccurate results. Larger sample sizes will give you more accurate average values, identify outliers in data and provide smaller margins of error. The question here ultimately is what too small vs large sample sizes is. You will find out the answers to it as you go through the article.
The below oracle script shows how to calculate sample size. I am using a CTE and partitioned them into multiple sections of snapshots to explain the code better. If you want to use the script, you need to put all sections of code together. Now, I am going to set up our statistical parameters.
--set confidence level z-score based on tail type case when tail_type='ONE' then case significance_level when 90 then 1.28 -- One tailed test for 90% confidence when 95 then 1.645 -- One tailed test for 95% confidence when 99 then 2.326 -- One tailed test for 99% confidence else 1.645 end else case significance_level when 90 then 1.645 -- Two tailed test for 90% confidence when 95 then 1.96 -- Two tailed test for 95% confidence when 99 then 2.576 -- Two tailed test for 99% confidence else 1.96 end end as z_alpha,
--set power level z-score (same for both tail types) case statistical_power when 80 then 0.84 when 90 then 1.28 when 95 then 1.645 else 0.84 end as z_beta from test_parameters )
select * from statistical_parameters;
This conversion converts the confidence levels into statistical values used in sample size calculations. For collections, 95% confidence means there is a possibility of 5% of the time results being wrong or when voicemails don’t help.
In statistical terms, z-alpha represents our confidence level, with different values based on both confidence level and tail-type test. Typically, two tailed test values are higher than one tailed test values because of the error rate split in both directions for a two-tailed test. In voicemail testing scenario, 5% chance of being wrong indicates error rate split evenly (0.025 chance probability for payments going lower and 0.025 for payments going higher) whereas a one-tailed test concentrates the entire 0.05 probability in one direction, as we’re only interested in payments going either up or down, not both.
Statistical power is known as z-beta. When we set 80% statistical power (z-beta = 0.84), we are saying we want to catch real changes 80% of the time and will accept missing them 20% of the time.
Z-alpha and Z-beta put together means, if voicemails truly help improve payment rates, we will detect this improvement 80% of the time, and when we do detect it, we can be 95% confident it is a real improvement and not due to a chance.
Output Result
Let us now move into the calculation of the sample size volume needed. This calculation determines how many accounts we need to test. In our voicemail scenario, if we’re looking to improve from 8% to 8.8% payment rate, this tells us how many accounts we need to be confident that the payment rate will increase, or decrease is real and not just by chance.
--calculate minimum effect size baseline_rate*(min_detectable_effect/100) as minimum_effect,
--calculate base sample size ceil( case tail_type when 'ONE' then ( power(z_alpha + z_beta, 2) * baseline_Rate * (1 - baseline_Rate)) / (power(baseline_Rate * (min_detectable_effect/100), 2)) else (2 * power(z_alpha + z_beta, 2) * baseline_Rate * (1 - baseline_Rate)) / (power(baseline_Rate * (min_detectable_effect/100), 2)) end ) as required_sample_size from statistical_parameters )
Output Result
Split Ratios and Test Duration
Split ratios determine how you divide your dataset between the champion (your current version) and the challenger(s) (your test versions). Common split ratios include two way (like 50/50, 80/20 or 90/10 splits) or multi-way splits like 50/25/25 or 70/10/10/10. These multi-way tests are used to test different variations while we still have a control group.
Choosing a split ratio should not be random or solely depend on volume availability but also consider other factors like confidence level in the challenger, impact of the change especially if it hurts the current metrics, and ensure the test meets the minimum sample size needed requirement.
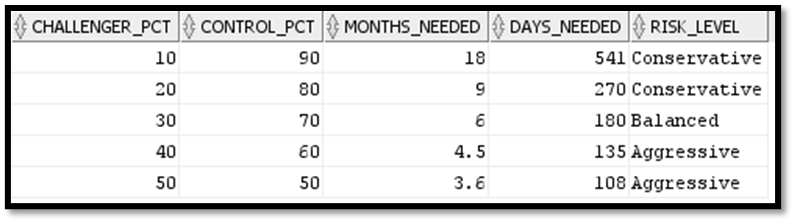
This below analysis translates statistical requirements into business terms and shows how different split ratios affect test duration. It also shows risk level based on split ratio. Split ratios represent how we divide accounts between champion and challenger.
 --split ratio
    ,split_ratios as(
    --generate split ratios from 10 to 50 for challenger
    Select
        level * 10 as challenger_pct,
        100 - (level * 10) as control_pct
    from dual
    connect by level <= 5 -- This generates 10/90, 20/80, 30/70, 40/60, 50/50
    )

    --split_analysis
    ,split_analysis as(
    select
        s.baseline_Rate * 100 as current_rate_pct,
        s.baseline_rate * (1 + s.min_detectable_effect/100) * 100 as target_rate_pct,
        s.min_detectable_effect as improvement_pct,
        s.tail_type,
        s.required_sample_size as sample_size_per_group,
        s.required_sample_size * 2 as total_sample_needed,
        s.monthly_volume,
        r.challenger_pct,
        r.control_pct,

    --calculate test duration (months) for different splits
        round(s.required_sample_size / (s.monthly_volume * (r.challenger_pct/100)), 1) as months_needed,

    --calculate test days needed for each split
        round(s.required_sample_size / (s.monthly_volume * (r.challenger_pct/100)) * 30, 0) as days_needed,

     --Assess risk level for each split
        case
            when r.challenger_pct <= 20 then 'Conservative'
            when r.challenger_pct <= 35 then 'Balanced'
            else 'Aggressive' end as risk_level
    from sample_size_calculation s cross join split_ratios r
    )

    select * from split_analysis;
Conservative risk only impacts 10–20% of accounts getting new treatment and 80–90% accounts from potential negative impacts. This split ratio takes longer to gather enough data. Balanced risk will impact one third of the accounts and protect the rest while it gathers data faster. Aggressive risk impacts up to half the accounts though it gathers data quickly, it exposes more accounts to risk.
Part of the output result
It is important to know how long a champion/challenger test should be run. Run a test for too short of a time, and you risk making decisions based on incomplete or misleading data. Run it too long, you may waste resources and delay decision making. To maintain the balance, generally, tests should run for a minimum of one full business cycle. Tests typically shouldn’t run for more than 4–8 weeks and this way we don’t mix up our results with other operational or seasonal changes taking place.
Risk Assessment and Volume Requirements
I observe analysts new to champion/challenger testing do not know what split ratio to opt for. We can decide on which split ratio to opt for by considering the risks associated in choosing for a certain split ratio and what volume is needed for that split ratio.
Worst-case scenario must be calculated to assess the risk level.
,volume_recommendations as( select distinct sample_size_per_group, --recommende monthly volumes for different completion timeframes for all splits ceil(sample_size_per_group / 0.5) as volume_for_1_month_50_50, --50/50 split ceil(sample_size_per_group / 0.4) as volume_for_1_month_40_60, --40/60 split ceil(sample_size_per_group / 0.3) as volume_for_1_month_30_70, --30/70 split ceil(sample_size_per_group / 0.2) as volume_for_1_month_20_80, --20/80 split ceil(sample_size_per_group / 0.1) as volume_for_1_month_10_90 --10/90 split from split_analysis )
Part of the output result
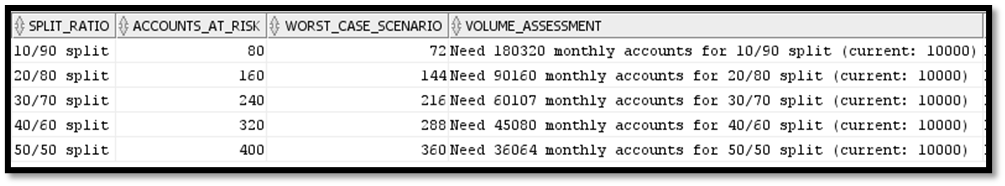
Let us say we opt for 30/70 split ratio which is showing a ‘balanced’ split for voicemails. With 10,000 monthly accounts, 3000 accounts will receive voicemails while 7000 accounts continue as normal. If voicemails perform poorly, it affects 3,000 accounts and the maximum exposure will be 240 payments at risk (3,000 * 8%). In the scenario, voicemails test decrease payment rates by 10% instead of improving them, we would only receive 216 payments (3,000 * 8% * (1–10%)). This means we lose 24 payments which we would have otherwise received.
This worst-case calculation helps us understand what’s at risk. With a more aggressive 50/50 split, we would have 5,000 accounts in the test group, risking a potential loss of 40 payments under worse-case conditions. A conservative 20/80 split would only risk 16 payments, though it would take longer to complete the test.
With a 50/50 split, we need a total volume of 36k accounts to get our required 18k accounts in the test group. Since we only have 10k accounts monthly, this means our test would take approximately 3.6 months to complete. Moving to the most conservative 10/90 split would require 180k accounts, making the test duration impractically long at 18 months.
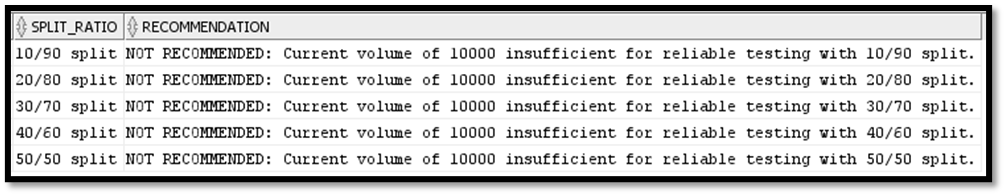
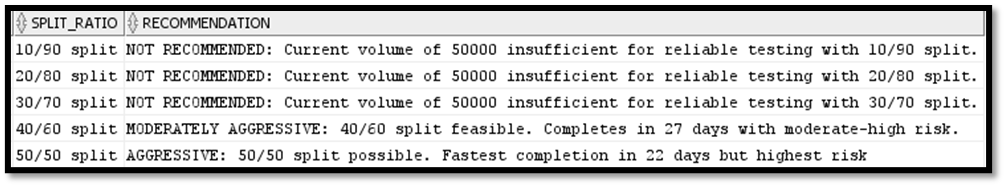
,final_Recommendation as(
    select
        sa.*,
        ra.accounts_At_Risk,
        ra.worst_case_scenario,
        vr.volume_for_1_month_50_50,
        vr.volume_for_1_month_40_60,
        vr.volume_for_1_month_30_70,
        vr.volume_for_1_month_20_80,
        vr.volume_for_1_month_10_90,
        --Generate final recommendations based on all split ratios
    case when sa.monthly_volume >= vr.volume_for_1_month_50_50 and sa.challenger_pct = 50
         then 'AGGRESSIVE: 50/50 split possible. Fastest completion in ' || sa.days_needed || ' days but highest risk '
         when sa.monthly_volume >= vr.volume_for_1_month_40_60 and sa.challenger_pct = 40
         then 'MODERATELY AGGRESSIVE: 40/60 split feasible. Completes in ' || sa.days_needed || ' days with moderate-high risk.'
         when sa.monthly_volume >= vr.volume_for_1_month_30_70 and sa.challenger_pct = 30
         then 'BALANCED: 30/70 split recommended. Completes in ' || sa.days_needed || ' days with balanced risk.'
         when sa.monthly_volume >= vr.volume_for_1_month_20_80 and sa.challenger_pct = 20
         then 'CONSERVATIVE: 20/80 split possible. Takes ' || sa.days_needed || ' days with lower risk.'
         when sa.monthly_volume >= vr.volume_for_1_month_10_90 and sa.challenger_pct = 10
         then 'BALANCED: 10/90 split possible. Takes ' || sa.days_needed || ' days but minimizes risk.'
         else 'NOT RECOMMENDED: Current volume of ' || sa.monthly_volume || ' insufficient for reliable testing with '
              || sa.challenger_pct || '/' ||  sa.control_pct || ' split.' end as recommendation
    from split_analysis sa join risk_assessment ra on sa.challenger_pct=ra.challenger_pct
        cross join volume_recommendations vr
        )
select
        tail_type as test_type,
        current_rate_pct || '%' as current_rate,
        target_rate_pct || '%' as target_rate,
        improvement_pct || '%' as improvement,
        sample_size_per_group as needed_per_group,
        total_sample_needed as total_needed,
        monthly_volume,
        challenger_pct || '/' || control_pct || ' split' as split_ratio,
        days_needed || ' days (' || round(months_needed, 1) || ' months)' as duration,
        risk_level,
        accounts_At_Risk || ' accounts at risk' as risk_exposure,
        worst_Case_Scenario || ' worst case' as risk_scenario,
            case
                when challenger_pct = 10 then
                    case
                        when monthly_volume >= volume_for_1_month_10_90
                        then 'Current volume (' || monthly_volume || ') sufficient for 10/90 split'
                        else 'Need ' || volume_for_1_month_10_90
                        || ' monthly accounts for 10/90 split (current: ' || monthly_volume || ')'
                    end
                when challenger_pct = 20 then
                    case
                        when monthly_volume >= volume_for_1_month_20_80
                        then 'Current volume (' || monthly_volume || ') sufficient for 20/80 split'
                        else 'Need ' || volume_for_1_month_20_80
                        || ' monthly accounts for 20/80 split (current: ' || monthly_volume || ')'
                    end
                 when challenger_pct = 30 then
                    case
                        when monthly_volume >= volume_for_1_month_30_70
                        then 'Current volume (' || monthly_volume || ') sufficient for 30/70 split'
                        else 'Need ' || volume_for_1_month_30_70
                        || ' monthly accounts for 30/70 split (current: ' || monthly_volume || ')'
                    end
                 when challenger_pct = 40 then
                    case
                        when monthly_volume >= volume_for_1_month_40_60
                        then 'Current volume (' || monthly_volume || ') sufficient for 40/60 split'
                        else 'Need ' || volume_for_1_month_40_60
                        || ' monthly accounts for 40/60 split (current: ' || monthly_volume || ')'
                    end
                else
                    case
                        when monthly_volume >= volume_for_1_month_50_50
                        then 'Current volume (' || monthly_volume || ') sufficient for 50/50 split'
                        else 'Need ' || volume_for_1_month_50_50
                        || ' monthly accounts for 50/50 split (current: ' || monthly_volume || ')'
                    end
                end as volume_assessment,
            recommendation
        from final_Recommendation
        order by challenger_pct;
Part of the output result for 10k monthly volume
If monthly volume is 50,000 accounts:
Part of the output result for 50k monthly volume
Certain questions need to be thought of in order to decide which split ratio to choose and risk level is acceptable and eventually understand the volume available to test voicemails. Can the business accept potentially losing 40 payments monthly in exchange for completing the test in 3.6 months or would it be better to risk only 16 payments monthly but extend the test duration? By carefully choosing your split ratios and understand what sample sizes are appropriate, you can design tests that provide accurate and actionable insights.
Calculators versus SQL Implementation
Online calculators like Evan Miller and Optimizely are valuable tools, typically defaulting to a 50/50 split ratio or two-tailed tests. Another online tool, Statsig, doesn’t default to anything but at the same time doesn’t provide additional details like what we just coded with our SQL implementation. The SQL implementation becomes valuable here as it helps track not just basic metrics, but also monitor risk exposure and test duration based on your actual monthly volume. This comprehensive view helps especially when you need to deviate from standard 50/50 splits or want to understand different split ratios on your test design and business risks.
Continuous Testing
Champion/challenger testing is not a one-time effort but a continuous cycle of improvement. Create performance reports and continuously monitor the results. Adapt to the changing conditions including seasonal shifts and economic changes. By integrating this approach into your strategy testing, you are creating a systematic approach to decision-making that drives innovation, mitigates risk, and most importantly intuition can be backed up with solid data evidence.
Note:All images, unless otherwise noted, are by the author.
A Spanish government-appointed committee of experts has recommended that smartphones sold in the country carry health warning labels. The advice comes amid mounting concern about the effects of smartphone use, particularly among young people. The experts published their findings in a 250-page report, seen by newspaper El País. The document details ways the government could crack down on what the panel calls a “public health epidemic”. Proposals include banning digital devices for kids under three and restricting their use for those between three and six, except in rare cases. The report also advises rolling out so-called “dumbphones” for teens up…
A Spanish government-appointed committee of experts has recommended that smartphones sold in the country carry health warning labels. The advice comes amid mounting concern about the effects of smartphone use, particularly among young people. The experts published their findings in a 250-page report, seen by newspaper El País. The document details ways the government could crack down on what the panel calls a “public health epidemic”. Proposals include banning digital devices for kids under three and restricting their use for those between three and six, except in rare cases. The report also advises rolling out so-called “dumbphones” for teens up…
PLD Space has secured an €11mn loan to help fund the development of a liftoff site for its partially reusable Miura 5 rocket, which is set to become Europe’s first privately developed satellite launcher — unless one of its competitors gets there first. The loan will help the Spanish startup construct the launch facility, located at Europe’s primary spaceport in French Guiana and estimated to cost around €16mn overall. PLD Space launched its first, smaller rocket, Miura 1, from Spain last year. However, for a bigger orbital launcher like Miura 5, the company needs a facility with specific capabilities. These…
In a new interview, CEO Tim Cook says that Apple began looking into what became Apple Intelligence in 2017, just as Apple Park was opening.
Credit: Apple
It’s been repeatedly claimed that Apple is behind the industry on artificial intelligence, and that’s just as often been refuted. Now before it became known as Apple Intelligence, Tim Cook says that AI crept up on Apple — but crept up a long time ago.
“I wouldn’t say there was an aha moment,” he told Steven Levy in Wired. “It built like a wave, or like rolling thunder.”
The FBI and Cybersecurity and Infrastructure Security Agency say that Americans should use encrypted apps such as iMessage and FaceTime to be safe from foreign hackers.
Image credit: Elchinator on Pixabay
It’s an about-face for the FBI, which has for years demanded that Apple allow the agency unencrypted access to Messages. The new warning comes in the face of what it and the Cybersecurity and Infrastructure Security Agency (CISA) say is China’s ongoing Salt Typhoon hack.
“Our suggestion, what we have told folks internally, is not new here: Encryption is your friend, whether it’s on text messaging or if you have the capacity to use encrypted voice communication,” Jeff Greene, executive assistant director for cybersecurity at the CISA, told NBC News in a press call. “Even if the adversary is able to intercept the data, if it is encrypted, it will make it impossible.”
We use cookies on our website to give you the most relevant experience by remembering your preferences and repeat visits. By clicking “Accept”, you consent to the use of ALL the cookies.
This website uses cookies to improve your experience while you navigate through the website. Out of these, the cookies that are categorized as necessary are stored on your browser as they are essential for the working of basic functionalities of the website. We also use third-party cookies that help us analyze and understand how you use this website. These cookies will be stored in your browser only with your consent. You also have the option to opt-out of these cookies. But opting out of some of these cookies may affect your browsing experience.
Necessary cookies are absolutely essential for the website to function properly. These cookies ensure basic functionalities and security features of the website, anonymously.
Cookie
Duration
Description
cookielawinfo-checkbox-analytics
11 months
This cookie is set by GDPR Cookie Consent plugin. The cookie is used to store the user consent for the cookies in the category "Analytics".
cookielawinfo-checkbox-functional
11 months
The cookie is set by GDPR cookie consent to record the user consent for the cookies in the category "Functional".
cookielawinfo-checkbox-necessary
11 months
This cookie is set by GDPR Cookie Consent plugin. The cookies is used to store the user consent for the cookies in the category "Necessary".
cookielawinfo-checkbox-others
11 months
This cookie is set by GDPR Cookie Consent plugin. The cookie is used to store the user consent for the cookies in the category "Other.
cookielawinfo-checkbox-performance
11 months
This cookie is set by GDPR Cookie Consent plugin. The cookie is used to store the user consent for the cookies in the category "Performance".
viewed_cookie_policy
11 months
The cookie is set by the GDPR Cookie Consent plugin and is used to store whether or not user has consented to the use of cookies. It does not store any personal data.
Functional cookies help to perform certain functionalities like sharing the content of the website on social media platforms, collect feedbacks, and other third-party features.
Performance cookies are used to understand and analyze the key performance indexes of the website which helps in delivering a better user experience for the visitors.
Analytical cookies are used to understand how visitors interact with the website. These cookies help provide information on metrics the number of visitors, bounce rate, traffic source, etc.
Advertisement cookies are used to provide visitors with relevant ads and marketing campaigns. These cookies track visitors across websites and collect information to provide customized ads.