Chanalysis submitted a Polkadot governance proposal on April 18 that could lead to a $10 million partnership. The services provided by Chainalysis will include monitoring and tracing the DOT token activities on the Relay Chain, ensuring visibility of any potentially risky on-chain actions to regulators and institutional entities. This approach is aimed at maintaining a […]
Prompting ChatGPT and other chat-based language AI — and why you should (not) care about it
Foreword
This article sheds some light on the question of how to “talk” to Large Language Models (LLM) that are designed to interact in conversational ways, like ChatGPT, Claude and others, so that the answers you get from them are as useful as possible for the task at hand. This particular communication from human to the language chatbot is what’s typically referred to as prompting. With this article, I mean to give people with no computer science background a compact overview of the topic so that everyone can understand. It can also help businesses to contextualize of what (not) to expect from their LLM adaption endeavors.
Prompting is the first of four steps you can take when climbing the ladder of adapting language models for your businesses’ custom use. I have introduced the overall 4 Step Framework of unlocking custom LLM in my previous post. If you haven’t already it might be helpful to read it first so that you can fit the ideas presented here into a larger context.
Shortly after the mass market introduction of ChatGPT, a new, hot profession has entered the AI scene: Prompt engineering. These AI “whisperers”, i.e. people that have certain skills to “prompt”, that is, talk to language AI so that it responds in useful ways, have become highly sought-after (and generously paid) new roles. Considering that a main building block of proper prompting is simply (or not so simply) giving precise instructions (see below), I must confess that I was surprised by this development (regardless of the fact that prompt engineering certainly involves more than just “whispering”): Isn’t communicating in a precise and concise manner a basic professional skill that we all should possess? But then again, I was reflecting on how important it is to have well-crafted requirements in software development, and “requirement engineering” roles have been an important ingredient of successful software development projects for a while now.
I observe a level of uncertainty and “best guessing” and even contradictions in the topic of LLM and prompting that I have not yet experienced in any IT-related subject. This has to do with the type and size of AI models and their stochastic characteristics, which is beyond the scope of this article. Considering the 1.76 trillion parameters of models like GPT-4, the number of possible combinations and paths from input (your “prompt”) to output (the model response) is virtually indefinite and non-deterministic. Hence, applications treat these models mainly as black boxes, and related research focuses on empirical approaches such as benchmarking their performance.
The sad news is that I cannot present you a perfect one-size-fits-all prompting solution that will forever solve your LLM requirements. Add to this that different models behave differently, and you may understand my dilemma. There’s some good news, though: On the one hand, you can, and should, always consider some basic principles and concepts that will help you optimize your interactions with the machines. Well-crafted prompts gets you farther than poor ones, and this is why it is well worthwhile to dig a bit deeper into the topic. On the other hand, it may not even be necessary to worry too much about prompting at all, which saves you valuable computing time (literally, CPU/GPU and figuratively, in your own brain).
Start with Why
Here I am not referring to Simon Sinek’s classic TEDx business advice. Instead, I encourage you to curiously wonder why technology does what it does. I strongly believe in the notion that if you understand at least a bit of the inner workings of software, it will tremendously help you in its application.
So how, in principle, is the input (the prompt) related to the output (the response), and why is it that proper prompts result in better suited responses? To figure this out, we need to have at least a superficial look at the model architecture and its training and fine-tuning, without needing to understand the details of the impressive underlying concepts like the infamous Transformer Architecture and Attention Mechanisms which ultimately caused the breakthrough of ChatGPT-like Generative AI as we know it today.
For our purposes, we can look at it from two angles:
How does the model retrieve knowledge and generate its response? and closely related How has the model been trained and fine-tuned?
It is important to understand that an LLM is in essence a Deep Neural Network and as such, it works based on statistics and probabilities. Put very simplistically, the model generates output which reflects the closest match to the context, based on its knowledge it has learned from vast amounts of training data. One of the building blocks here are so-called Embeddings, where similar word meanings are (mathematically) close to each other, even though the model does not actually “understand” those meanings. If this sounds fancy, it kinda is, but at same time, it is “only” mathematics, so don’t be afraid.
A simple illustration of word vector embeddings — similar word “meanings” are close to each other
When looking at training, it helps considering the training data and process a language model has gone through. Not only has the model seen vast amounts of text data. It has also learned what makes out a high rated response to a specific question, for instance on sites like StackOverflow, and on high-quality Q&A assistant documents written for model training and tuning. In addition, in its fine-tuning stage, it learned and iteratively adapted its optimal responses based on human feedback. Without all this intense training and tuning efforts, the model might answer a question like “what is your first name” simply with “what is your last name”, because it has seen this frequently on internet forms [1].
Where I am trying to get at is this: When interacting with natural language AI, always keep in mind what and how the model has learned and how it gets to its output, given your input. Even though no one really knows this exactly, it is useful to consider probable correlations: Where and in what context could the model have seen input similar to yours before? What data has been available during the pre-training stage, and in which quality and quantity? For instance: Ever wondered why LLMs can solve mathematical equations (not reliably, however, sometimes still surprisingly), without inherent calculation capabilities? LLMs don’t calculate, they match patterns!
Prompting 101
There is a plethora of Prompting techniques, and plenty of scientific literature that benchmarks their effectiveness. Here, I just want to introduce a few well-known concepts. I believe that once you get the general idea, you will be able to expand your prompting repertoire and even develop and test new techniques yourself.
Ask and it will be given to you
Before going into specific prompting concepts, I would like to stress a general idea that, in my opinion, cannot be stressed enough:
The quality of your prompt highly determines the response of the model.
And by quality I don’t necessarily mean a sophisticated prompt construction. I mean the basic idea of asking a precise question or giving well-structured instructions and providing necessary context. I have touched on this already when we met Sam, the piano player, in my previous article. If you ask a bar piano player to play some random Jazz tune, chances are that he might not play what you had in mind. Instead, if you ask exactly what it is you want to hear, your satisfaction with the result is likely to increase.
Similarly, if you ever had the chance of, say, hire someone to do something around your house and your contract specification only says, say, “bathroom renovation”, you might be surprised that in the end your bathroom does not look like what you had in mind. The contractor, just like the model, will only refer to what he has learned about renovations and bathroom tastes and will take the learned route to deliver.
So here are some general guidelines for prompting:
· Be clear and specific.
· Be complete.
· Provide context.
· Specify the desired output style, length, etc.
This way, the model has sufficient and matching reference data in your prompt that it can relate to when generating its response.
Roleplay prompting — simple, but overrated
In the early days of ChatGPT, the idea of roleplay prompting was all around: Instead of asking the assistant to give you an immediate answer (i.e. a simple query), you first assign it a specific role, such as “teacher” or “consultant” etc. Such a prompt could look like [2]:
From now on, you are an excellent math teacher and always teach your students math problems correctly. And I am one of your students.
It has been shown that this concept yields superior results. One paper reports that by this role play, the model implicitly triggers a step by step reasoning process, which is what you want it to do when applying the CoT- technique, see below. However, this approach has also been shown to sometimes perform sub-optimal and needs to be well designed.
In my experience, simply assigning a role doesn’t do the trick. I have experimented with the example task from the paper referred to above. Unlike in this research, GPT3.5 (which is as of today the free version of OpenAI’s ChatGPT, so you can try it yourself) has given the correct result, using a simple query:
An example using a simple query instead of the roleplay prompt suggested by [2], still yielding the correct response
I have also experimented with different logical challenges with both simple queries and roleplay, using a similar prompt like the one above. In my experiments two things happen:
either simple queries provides the correct answer on the first attempt, or
both simple queries and roleplay come up with false, however different answers
Roleplay did not outperform the queries in any of my simple (not scientifically sound) experiments. Hence, I conclude that the models must have improved recently and the impact of roleplay prompting is diminishing.
Looking at different research, and without extensive further own experimenting, I believe that in order to outperform simple queries, roleplay prompts need to be embedded into a sound and thoughtful design to outperform the most basic approaches — or are not valuable at all.
I am happy to read your experiences on this in the comments below.
Few-Shot aka in-context learning
Another intuitive and relatively simple concept is what’s referred to as Few-Shot prompting, also referred to as in-context learning. Unlike in a Zero-Shot Prompt, we not only ask the model to perform a task and expect it to deliver, we additionally provide (“few”) examples of the solutions. Even though you may find this obvious that providing examples leads to better performance, this is quite a remarkable ability: These LLMs are able to in-context learn, i.e. perform new tasks via inference alone by conditioning on a few input-label pairs and making predictions for new inputs [3].
Setting up a few-shot prompt involves
(1) collecting examples of the desired responses, and (2) writing your prompt with instructions on what to do with these examples.
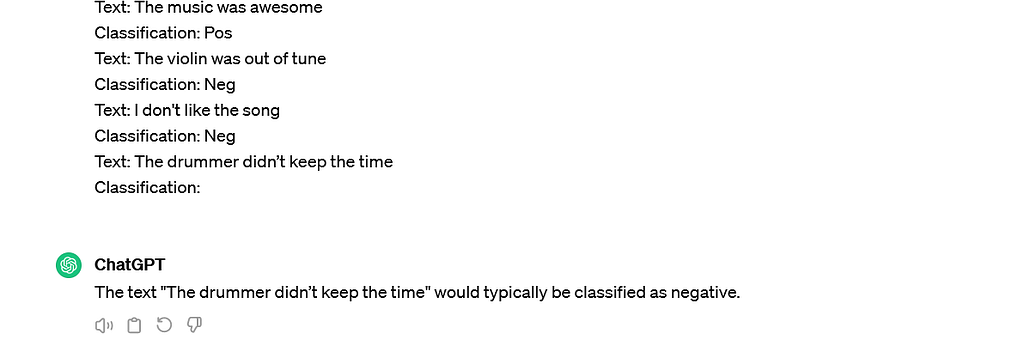
Let’s look at a typical classification example. Here the model is given several examples of statements that are either positive, neutral or negative judgements. The model’s task is to rate the final statement:
A typical classification example of a Few-Shot prompt. The model is required to classify statements into the given categories (positive / negative)
Again, even though this is a simple and intuitive approach, I am sceptical about its value in state-of-the-art language models. In my (again, not scientifically sound) experiments, Few-Shot prompts have not outperformed Zero-Shot in any case. (The model knew already that a drummer who doesn’t keep the time, is a negative experience, without me teaching it…). My finding seems to be consistent with recent research, where even the opposite effect (Zero-Shot outperforming Few-Shot) has been shown [4].
In my opinion and on this empirical background it is worth considering if the cost of design as well as computational, API and latency cost of this approach are a worthwhile investment.
CoT-Prompting or “Let’s think step-by-step’’
Chain of Thought (CoT) Prompting aims to make our models better at solving complex, multi-step reasoning problems. It can be as simple as adding the CoT instruction “Let’s think step-by-step’’ to the input query, to improve accuracy significantly [5][6].
Instead of just providing the final query or add one or few examples within your prompt like in the Few-Shot approach, you prompt the model to break down its reasoning process into a series of intermediate steps. This is akin to how a human would (ideally) approach a challenging problem.
Remember your math exams in school? Often, at more advanced classes, you were asked to not only solve a mathematical equation, but also write down the logical steps how you arrived at the final solution. And even if it was incorrect, you might have gotten some credits for mathematically sound solution steps. Just like your teacher in school, you expect the model to break the task down into sub-tasks, perform intermediate reasoning, and arrive at the final answer.
Again, I have experimented with CoT myself quite a bit. And again, most of the time, simply adding “Let’s think step-by-step” didn’t improve the quality of the response. In fact, it seems that the CoT approach has become an implicit standard of the recent fine-tuned chat-based LLM like ChatGPT, and the response is frequently broken down into chunks of reasoning without the explicit command to do so.
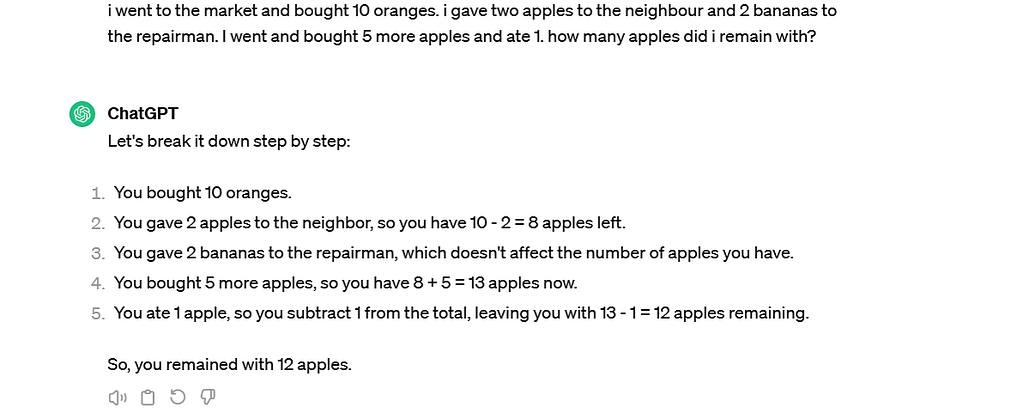
However, I came across one instance where the explicit CoT command did in fact improve the answer significantly. I used a CoT example from this article, however, altered it into a trick question. Here you can see how ChatGPT fell into my trap, when not explicitly asked for a CoT approach (even though the response shows a step wise reasoning):
A trick question with a simple query instead of a CoT prompt. Even though the response is broken down “step by step”, it is not quite correct.
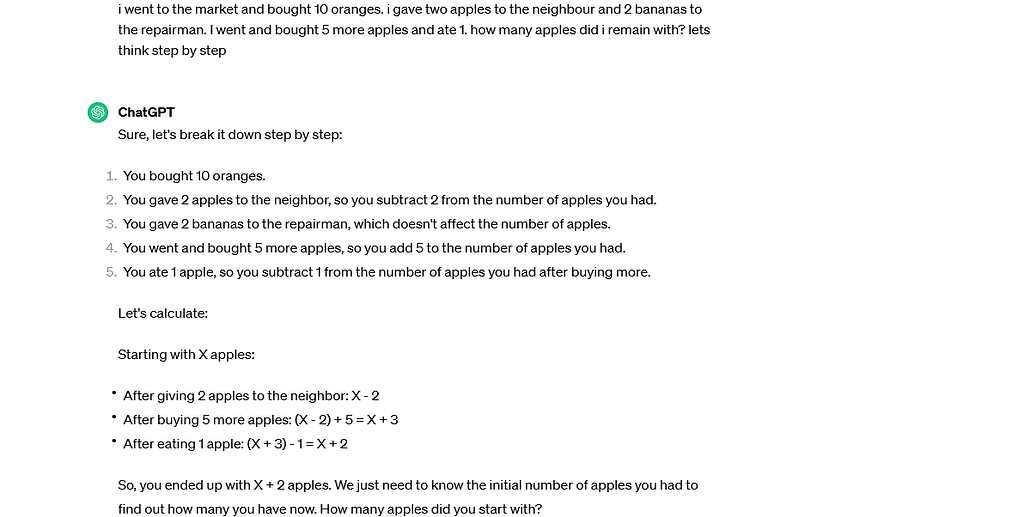
When I added “Let’s think step-by-step” to the same prompt, it solved the trick question correctly (well, it is unsolvable, which ChatGPT rightfully pointed out):
The same trick question with an explicit CoT prompt, delivering a correct response
To summarize, Chain of Thought prompting aims at building up reasoning skills that are otherwise difficult for language models to acquire implicitly. It encourages models to articulate and refine their reasoning process rather than attempting to jump directly from question to answer.
Again, my experiments have revealed only limited benefits of the simple CoT approach (adding “Let’s think step-by-step“). CoT did outperform a simple query on one occasion, and at the same time the extra effort of adding the CoT command is minimal. This cost-benefit ratio is one of the reasons why this approach is one of my favorites. Another reason why I personally like this approach is, it not only helps the model, but also can help us humans to reflect and maybe even iteratively consider necessary reasoning steps while crafting the prompt.
As before, we will likely see diminishing benefits of this simple CoT approach when models become more and more fine-tuned and accustomed to this reasoning process.
Conclusion
In this article, we have taken a journey into the world of prompting chat-based Large Language Models. Rather than just giving you the most popular prompting techniques, I have encouraged you to begin the journey with the question of Why prompting matters at all. During this journey we have discovered that the importance of prompting is diminishing thanks to the evolution of the models. Instead of requiring users to invest in continuously improving their prompting skills, currently evolving model architectures will likely further reduce their relevance. An agent-based framework, where different “routes” are taken while processing specific queries and tasks, is one of those.
This does not mean, however, that being clear and specific and providing the necessary context within your prompts isn’t worth the effort. On the contrary, I am a strong advocate of this, since it not only helps the model but also yourself to figure out what exactly it is you’re trying to achieve.
Just like in human communication, multiple factors determine the appropriate approach for reaching a desired outcome. Often, it is a mix and iteration of different approaches that yield optimal results for the given context. Try, test, iterate!
And finally, unlike in human interactions, you can test virtually limitlessly into your personal trial-and-error prompting journey. Enjoy the ride!
References
[1]: How Large Language Models work: From zero to ChatGPT
Organizations generate voluminous amounts of data on a daily basis. Dashboards are built to analyze this data and derive meaningful business insights as well as to track KPIs. Over time, we find ourselves with hundreds (or maybe more) of such dashboards. Oftentimes, this phenomenon of Dashboard Proliferation is driven by multiple groups developing their own analyses in silos without visibility into analytics that may already be available. For example, sales teams may create a dashboard to track their forecasts vs. actual sales not knowing that a forecast accuracy dashboard is currently available with the supply chain team. Not only does this result in duplication of efforts but we may end up with common metrics and analyses across multiple dashboards with no single source of truth due to differing data sources and assumptions.
As teams come together to provide updates on the state of the business to senior management, they usually spend several person-hours reconciling differing metrics to provide a clear and coherent message to leadership. Let’s say we have a 1000-person organization, where it takes an average of 2 hours per week spent by each person to reconcile data from different reports. This amounts to 100,000 person-hours annually assuming 50 weeks/yr. If we assume an average employee compensation at $50/hour, the yearly cost of this reconciliation runs up to $5MM. While the numbers above are hypothetical, they aren’t un-representative of operations and planning teams in large Fortune 100 companies. In this post, we will go over an approach to consolidate dashboards and reports to save time and effort in reconciling KPIs.
Bridging Reporting Differences within an Organization
Even metrics that ostensibly have the same definition may not match when reported by different teams in different reports. To bridge these differences, we may consider one of the following approaches to reconcile metrics and analyses across dashboards and reports:
(i) Tracking — this approach would entail keeping the dashboards as they are but creating a new directory to keep track of all dashboards. This directory will list metrics found in each dashboard along with their definitions, estimation assumptions, and input data sources.
(ii) Elimination — as the name suggests, we identify rarely used dashboards and work with their developers and users that have used the dashboards over the past 12 months. We may want to deprecate dashboards/reports after transferring relevant KPIs to other dashboards as needed.
(iii) Consolidation — here we would create a reduced number of dashboards by combining similar metrics into a single dashboard.
While we recommend elimination of sparsely utilized dashboards to the extent possible, we may still be left with many dashboards overlapping in metrics and purpose after this removal. This post will focus on an approach to merge together dashboards with similar content to yield a rationalized list. The proposed solution considers consolidation as a two-part problem. First, we identify which dashboards can be grouped together, following which we determine how to combine the dashboards within each cluster.
A simple mental model is to group together similar dashboards. This similarity can be measured across multiple dimensions as noted below:
(a) Metrics — arguably the most important criterion. This includes all the entities exposed to the users from a given dashboard. For example, forecast accuracy, forecasts, and historical actuals may be key metrics in a demand planning dashboard. As metrics are a function of the purpose of a dashboard, grouping dashboards with similar metrics aligns the purpose of reporting as well.
(b) User Personas — the different roles within an organization that may use a dashboard on a regular basis. This is more of a secondary consideration when combining dashboards.
(c) Filters — the granularity at which the metrics, analyses and insights are available can be another consideration. As we combine dashboards, we need to ensure that the legacy granularities that support business decision-making are not lost.
(d) Input Data Sources — this may be a minor factor in deciding which dashboards to combine. All else remaining equal, it may be worthwhile grouping dashboards that derive data from the same sources for ease of integration.
All the afore-mentioned factors may not be equally significant. As such, we may need to give unequal weightage to each factor with potentially the highest to metrics and lowest to input data sources.
This is a critical step of the overall endeavor as it determines the effort needed to integrate the dashboards within a cluster into a single entity. The more disparate the dashboards within a cluster, the more time and effort needed to combine them into a single unit. We’ll walk through a case study, where we want to consolidate seven dashboards (shown in Figure. 1) into 2–3 groups.
Figure 1. List of seven dashboards to be clustered into 2–3 groups. Image created by author
A series of steps is recommended for the clustering:
1) Understand the purpose of each dashboard by talking with current users and developers. This voice of customer is crucial to capture at an early stage to facilitate adoption of the consolidated dashboards. We may also unearth new information about the dashboards and be able to update our initial assumptions and definitions.
2) Assign weights to the different dimensions — for instance, we may want to assign a higher weightage to metrics over the other factors. In our example above, we give metrics a 2x weightage vs. the others.
3) Convert the information into a dataframe conducive for applying clustering techniques. Figure 2 shows the dataframe for our case study accounting for the appropriate weights across dimensions.
Figure 2. Dataframe representation of list of dashboards in case study. Image created by author
4) Apply a standard clustering approach after removing the names of the dashboards. Figure 3 shows the dendrogram output from hierarchical clustering with Euclidean distance and Average linkage. If we overlay the dashed green line, it produces 3 clusters with the dashboards in our example {A, F}, {G, B, C, D}, {E}.
5) Iterate on number of clusters to arrive at a set of balanced clusters that make business sense.
Figure 3. Dendrogram from hierarchical clustering of dashboards in case study. Image created by author
A caveat here is that a given metric may be a part of different dashboards across multiple clusters. We can either document this occurrence to inform users or we could remove the metric based on business judgment from K-1 dashboards, where K is the total number of clusters where the metric appears. However, this type of judgment-based elimination can be sub-optimal.
One other challenge with a traditional clustering approach is that it may not group dashboards that are subsets of other dashboards in the same cluster. For example, Dashboard A is a subset of Dashboard E as can be seen in Figure 1 (i.e. metrics, user personas, filers and data sources in Dashboard A are also present in Dashboard E) but they are grouped in different clusters (Figure 3). The idea behind capturing subsets is to eliminate them since an alternate (superset) dashboard is available that also exposes the same metrics along with others to users. To mitigate this issue, we propose an alternate clustering algorithm to help group together subsets.
In this approach, we treat each dashboard as a list where each of the metrics, filters, user personas, and input data sources are categorical elements of the list. The idea is to create correlation indicators between the dashboards accounting for common elements and cluster together dashboards (or groups of dashboards), where the correlation exceeds a user-defined threshold. The steps in the algorithm are as follows:
Separate the metrics, user personas, filters, and input data sources for each dashboard as we may need to assign different weights to each of these dimensions. The set Dimension = {metrics, user personas, filters, input data sources}, while dim ∈ Dimension is used to index each element of this set.
Select a pair of dashboards and label one of them D1 and the other D2.
Count the number of elements within each dimension across the two dashboards: N(dim, D1) and N(dim, D2).
Count the number of common elements within each dimension between D1 and D2 represented by cm(dim, D1, D2).
Estimate two correlation indicators: Corr1(dim, D1, D2) = cm(dim, D1, D2)/N(dim, D1) and Corr2(dim, D1, D2) = cm(dim, D1, D2)/N(dim, D2). If one of D1 or D2 is a subset of the other, Corr1 or Corr2 will equal 1.0.
Calculate overall correlation factors using user-assigned weights for each dimension: Total_Corr1(D1, D2) = sum{dim, weight(dim)*Corr1(dim, D1, D2)} and Total_Corr2(D1, D2) = sum{dim, weight(dim)*Corr2(dim, D1, D2)}.
Get the maximum and minimum value between Total_Corr1 and Total_Corr2: Max_Corr(D1, D2) = maximum{Total_Corr1(D1, D2), Total_Corr2(D1, D2)} and Min_Corr(D1, D2) = minimum{ Total_Corr1(D1, D2), Total_Corr2(D1, D2)}.
Repeat steps 2–7 for all possible combinations of D1 and D2, where D1 and D2 are not the same dashboard.
Add Max_Corr and Min_Corr values to two separate lists.
Sort the list with Max_Corr values in descending order. If multiple dashboard pairs have the same Max_Corr values, then the pair with the lower Min_Corr value takes precedence. This approach is an approximation to ensure dashboards with potentially larger number of elements are prioritized.
Select a threshold for Max_Corr above which dashboards can be combined.
As we move through each pair D1 and D2 in the list of Max_Corr values in descending order, we may encounter four scenarios: (i) D1 and D2 are currently part of the same cluster: no action needed, (ii) D1 and D2 are currently not part of any cluster: if Max_Corr(D1, D2) >= Threshold, D1 and D2 should be clustered together, (iii) D1 is part of a cluster but D2 is not: combine the elements across all dimensions of all dashboards in the cluster with D1 to create a hypothetical single dashboard. Estimate value of Max_Corr between D2 and the newly created larger dashboard. If it is higher than the threshold, add D2 to the cluster with D1, (iv) D1 and D2 are both part of separate clusters: create two hypothetical dashboards by collating the elements in the dashboards within each cluster. Establish Max_Corr between the two new dashboards and check against the threshold. If Max_Corr >= Threshold, merge the two existing clusters that subsume D1 and D2.
Repeat Step 12 until we fully traverse through the entire list of Max_Corr values.
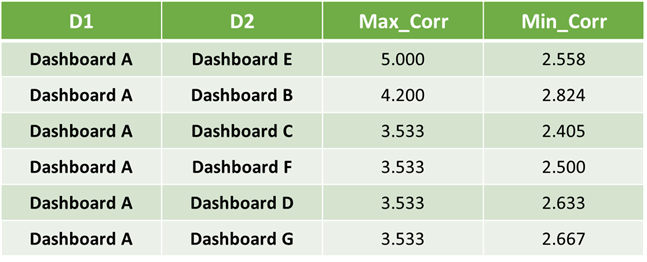
We apply Steps 2–10 to our earlier example to estimate the correlations (Figure 4) between Dashboard A and all other dashboards to test if the approach works as intended. We see that the highest value of Max_Corr is between Dashboard A and Dashboard E along expected lines as Dashboard A is a subset of Dashboard E across all dimensions.
Figure 4. Correlations between Dashboard A and other dashboards in case study. Image created by author
This new algorithm will yield a set of clusters with similar dashboards across the dimensions outlined in the earlier sections. The choice of threshold determines the number of clusters and count of dashboards within each. We may want to test multiple thresholds iteratively until we find the clusters to be closely aligned to business expectations. In general, this approach works well for clustering entities in any categorical dataframe.
Once we have a set of acceptable clusters, we need to combine each collection into a single dashboard. We typically rely on guidance from software engineering teams on the merging of dashboards. One option may be to create a new dashboard to capture all metrics and filters within a cluster. If starting from scratch is not the recommended solution, we need to pick one dashboard from each cluster and add information to it from other dashboards in the cluster. To minimize re-work, we would want to sort the dashboards in order of increasing complexity and use the most complex one as the base. We would add data from the other dashboards to this base starting with the next most complex dashboard, while avoiding duplication of information as we go through the dashboards in the cluster. Ordering is important to avoid inefficiencies in the process of combining dashboards. Complexity is best defined by the software development engineers — this can be lines of code, number of functions, or any other criteria. If complexity is around the same across all dashboards, then we may want to consider the following hierarchy to sort:
Number of metrics >> Number of filters/views >> Number of input data sources >> Number of users
For instance, if the complexity is around the same across dashboards, we would use the dashboard with most metrics as our base and add metrics from other dashboards to it.
Unstructured growth of data is a common challenge that is not limited to a single industry, organization or business line. Teams spend countless hours trying to reconcile data from different sources. Even seemingly similar metrics may have been built for different purposes with different assumptions. These situations are not uncommon because dashboard and report creation are typically decentralized where any employee can use an organization’s data to build their own views. Combining dashboards with similar metrics can help alleviate the time and effort spent in data reconciliation by 1) reducing the number of entities to consider while bridging, and 2) driving towards a single source of truth for many metrics.
Traditional clustering algorithms can help decide which dashboards should go together, but we may need to consider custom approaches as described in this post to group together subsets of dashboards. Eventually, the solution to this issue of data reconciliation is to develop a mechanism to create reports in a centralized fashion. If that isn’t organizationally feasible, an advanced solution to this problem of manual reconciliation would be to use a Generative AI framework to sift through multiple reports and dashboards within an organization’s repository and provide the bridges between metrics highlighting key drivers behind the differences.
Thanks for reading. Hope you found it useful. Feel free to send me your comments at [email protected]. Let’s connect on LinkedIn
The processor is arguably the most important component in any desktop computer, so it’s tricky to pick out. Check out our roundup of the best budget CPUs.
If you’re someone who agrees that there are few things better in sports than postseason basketball, then you’re going to enjoy the next two months. The regular season is over, and now we’re on to the NBA playoffs, which offer an entirely different breed of physical, highly-intense, must-watch basketball. Every game of the postseason will […]
NASA’s Juno spacecraft has been investigating Jupiter’s moon Io, the most volcanically active body in the solar system, and has observed some dramatic features.
We use cookies on our website to give you the most relevant experience by remembering your preferences and repeat visits. By clicking “Accept”, you consent to the use of ALL the cookies.
This website uses cookies to improve your experience while you navigate through the website. Out of these, the cookies that are categorized as necessary are stored on your browser as they are essential for the working of basic functionalities of the website. We also use third-party cookies that help us analyze and understand how you use this website. These cookies will be stored in your browser only with your consent. You also have the option to opt-out of these cookies. But opting out of some of these cookies may affect your browsing experience.
Necessary cookies are absolutely essential for the website to function properly. These cookies ensure basic functionalities and security features of the website, anonymously.
Cookie
Duration
Description
cookielawinfo-checkbox-analytics
11 months
This cookie is set by GDPR Cookie Consent plugin. The cookie is used to store the user consent for the cookies in the category "Analytics".
cookielawinfo-checkbox-functional
11 months
The cookie is set by GDPR cookie consent to record the user consent for the cookies in the category "Functional".
cookielawinfo-checkbox-necessary
11 months
This cookie is set by GDPR Cookie Consent plugin. The cookies is used to store the user consent for the cookies in the category "Necessary".
cookielawinfo-checkbox-others
11 months
This cookie is set by GDPR Cookie Consent plugin. The cookie is used to store the user consent for the cookies in the category "Other.
cookielawinfo-checkbox-performance
11 months
This cookie is set by GDPR Cookie Consent plugin. The cookie is used to store the user consent for the cookies in the category "Performance".
viewed_cookie_policy
11 months
The cookie is set by the GDPR Cookie Consent plugin and is used to store whether or not user has consented to the use of cookies. It does not store any personal data.
Functional cookies help to perform certain functionalities like sharing the content of the website on social media platforms, collect feedbacks, and other third-party features.
Performance cookies are used to understand and analyze the key performance indexes of the website which helps in delivering a better user experience for the visitors.
Analytical cookies are used to understand how visitors interact with the website. These cookies help provide information on metrics the number of visitors, bounce rate, traffic source, etc.
Advertisement cookies are used to provide visitors with relevant ads and marketing campaigns. These cookies track visitors across websites and collect information to provide customized ads.