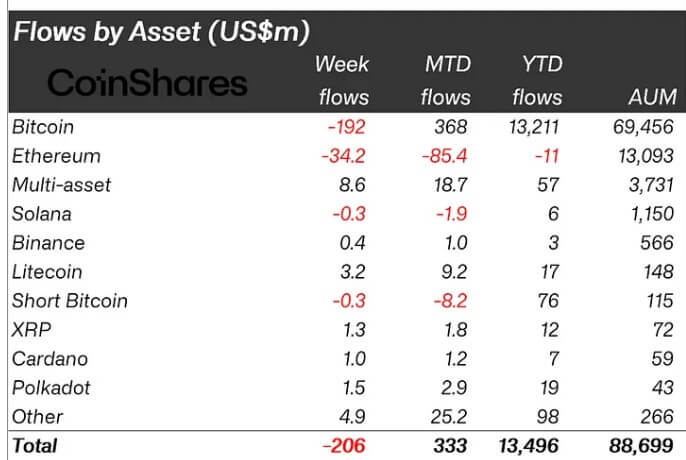
Crypto-related investment products saw their second consecutive week of outflows in April, with roughly $206 million leaving the market, per CoinShares‘ recent weekly report. Despite Bitcoin’s recent halving, which typically generates excitement in the market, investor interest in the leading digital asset remained subdued, evidenced by outflows totaling $192 million. Conversely, short-term investors seized the […]
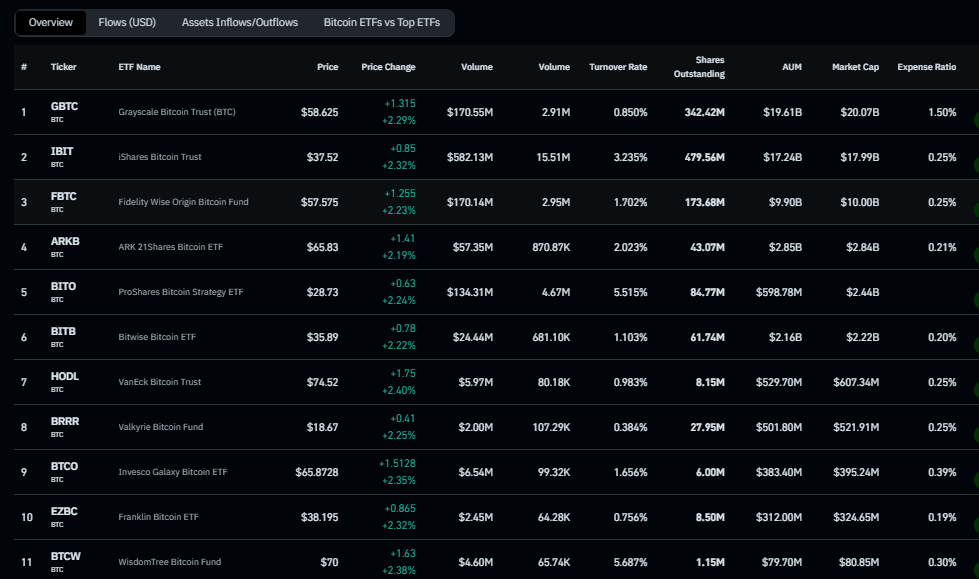
Quick Take The Grayscale Bitcoin Trust (GBTC) is planning to launch a new Bitcoin mini-trust with a groundbreaking fee of 0.15%, Coindesk reported on April 22. If realized, this new offering would undercut the current lowest-cost spot bitcoin ETF — the Franklin Bitcoin ETF (EZBC) — which charges a 0.19% fee, according to Coinglass. The […]
After the highly anticipated fourth halving arrived, Bitcoin transaction fees spiked to as high as $146 for a medium-priority transaction and $179 for a high-priority transaction.
Build Trusted Data Platforms with Google SRE Principles
Image generated by Dall-E
Do you have customers coming to you first with a data incident? Are your customers building their own data solutions due to un-trusted data? Does your data team spend unnecessarily long hours remediating undetected data quality issues instead of prioritising strategic work?
Data teams need to be able to paint a complete picture of their data systems health in order to gain trust with their stakeholders and have better conversations with the business as a whole.
We can combine data quality dimensions with Google’s Site Reliability Engineering principles to measure the health of our Data Systems. To do this, assess a few Data Quality Dimensions that makes sense for your data pipelines and come up with service level objectives (SLOs).
What are Service Level Objectives?
The service level terminology we will use in this article are service level indicators and service level objectives. The two are borrowed principles from Google’s SRE book.
service levelindicator — a carefully defined quantitative measure of some aspect of the level of service that is provided.
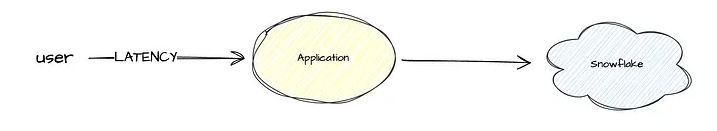
The indicators we’re familiar with in the software world are throughput, latency and up time (availability). These are used to measure the reliability of an application or website.
Typical Event
The indicators are then turned into objectives bounded by a threshold. The health of the software application is now “measurable” in a sense that we can now communicate the state of our application with our customers.
service level objective: a target value or range of values for a service level that is measured by an SLI.
We have an intuitive understanding of the necessity of these quantitative measures and indicators in a typical user applications to reduce friction and establish trust with our customers. We need to start adopting a similar mindset when building out data pipelines in the data world.
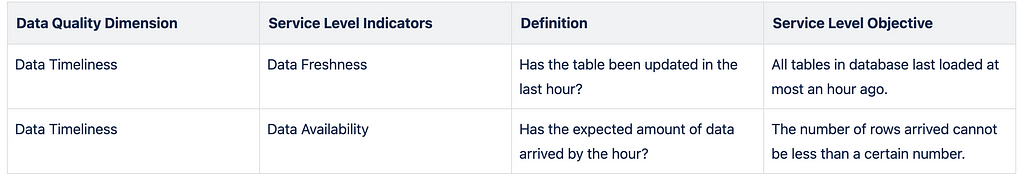
Data Quality Dimensions Translated into Service Level Terminology
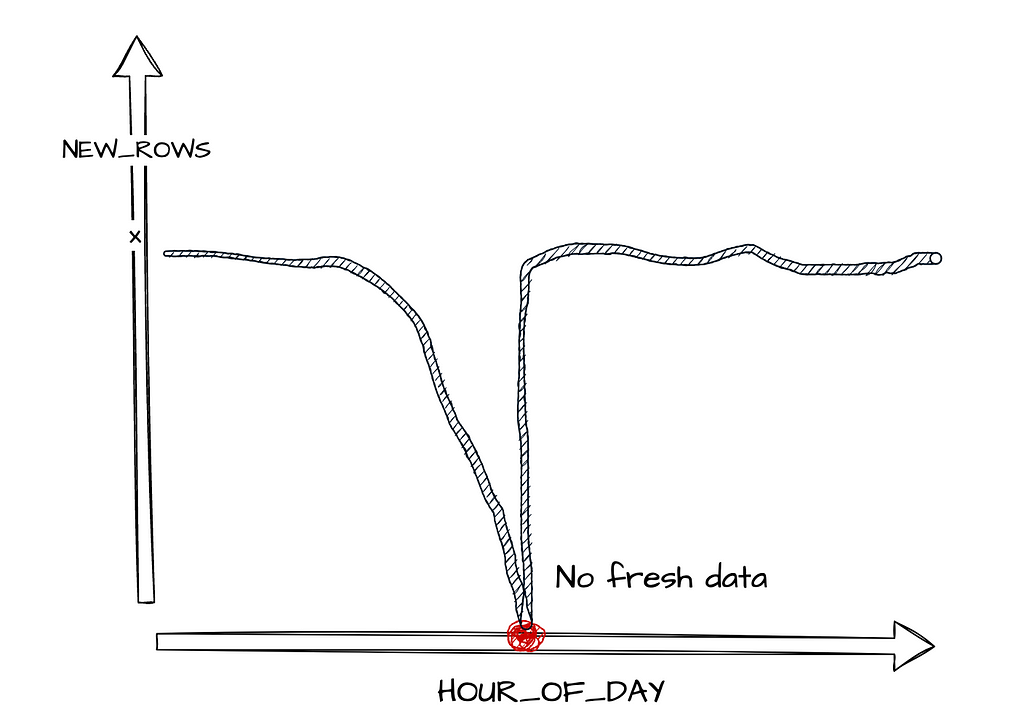
Data System with Failure
Lets say the user interacts with our application and generates X amounts of data every hour into our data warehouse, if the number of rows entering the warehouse suddenly decreases drastically, we can flag it as an issue. Then trace our timestamps from our pipelines to diagnose and treat the problem.
We want to capture enough information about the data coming into our systems so that we can detect when anomalies occur. Most data teams tend to start with Data Timeliness. Is the expected amount of data arriving at the right time?
This can be decomposed into the indicators:
Data Availability — Has the expected amount of data arrived/been made available?
Data Freshness — Has new data arrived at the expected time?
Data Quality Dimensions Translated into SLIs & SLOs
Once the system is stable it is important to maintain a good relationship with your customers in order to set the right objectives that are valuable to your stakeholders.
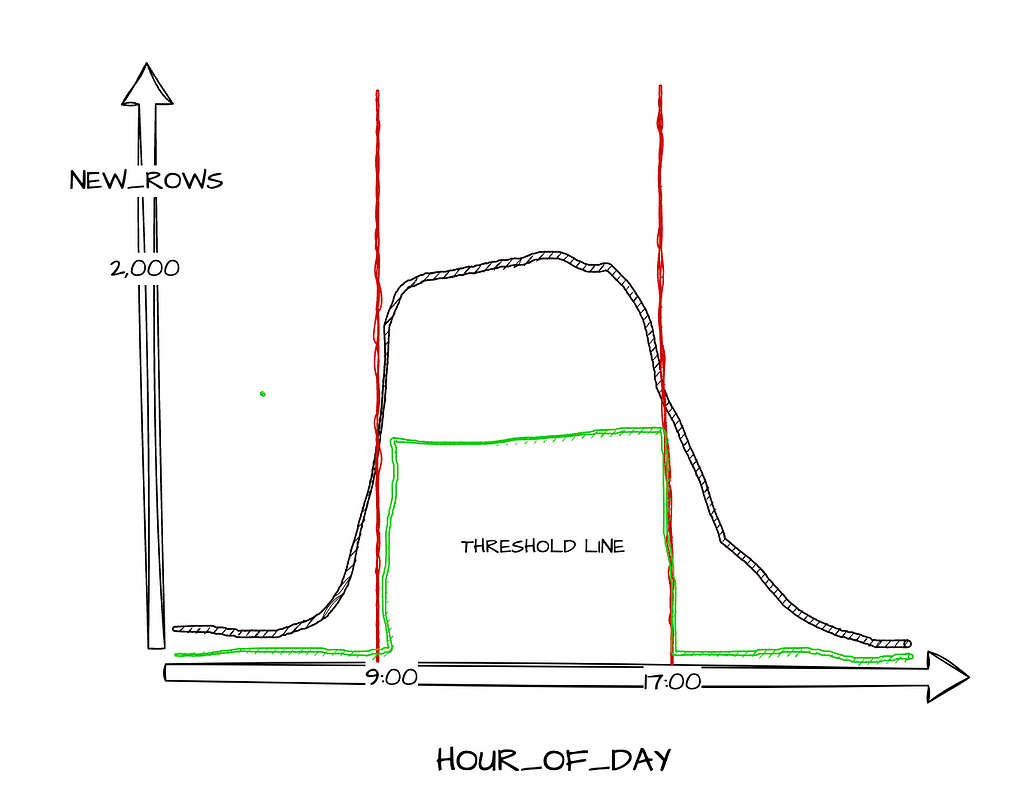
Concept of a Threshold…
How do we actually figure out how much data to expect and when? What is the right amount of data for all our different datasets? This is when we need to focus on the threshold concept as it does get tricky.
Assume we have an application where users mainly login to the system during the working hours. We expect around 2,000 USER_LOGIN events per hour between 9am to 5pm, and 100 events outside of those hours. If we use a single threshold value for the whole day, it would lead to the wrong conclusion. Receiving 120 events at 8pm is perfectly reasonable, but it would be concerning and should be investigated further if we only received 120 events at 2pm.
Graph with line of threshold in green
Because of this, we need to calculate a different expected value for each hour of the day for each different dataset — this is the threshold value. A metadata table would need to be defined that dynamically fetches the number of rows arrived each hour in order to get a resulting threshold that makes sense for each data source.
There are some thresholds which can be extracted using timestamps as a proxy as explained above. This can be done using statistical measures such as averages, standard deviations or percentiles to iterate over your metadata table.
Depending on how creative you want to be, you can even introduce machine learning in this part of the process to help you set the threshold. Other thresholds or expectations would need to be discussed with your stakeholders as it would stem from having specific knowledge of the business to know what to expect.
Technical Implementation in Snowflake
The very first step to getting started is picking a few business critical dataset to build on top of before implementing a data-ops solution at scale. This is the easiest way to gather momentum and feel the impact of your data observability efforts.
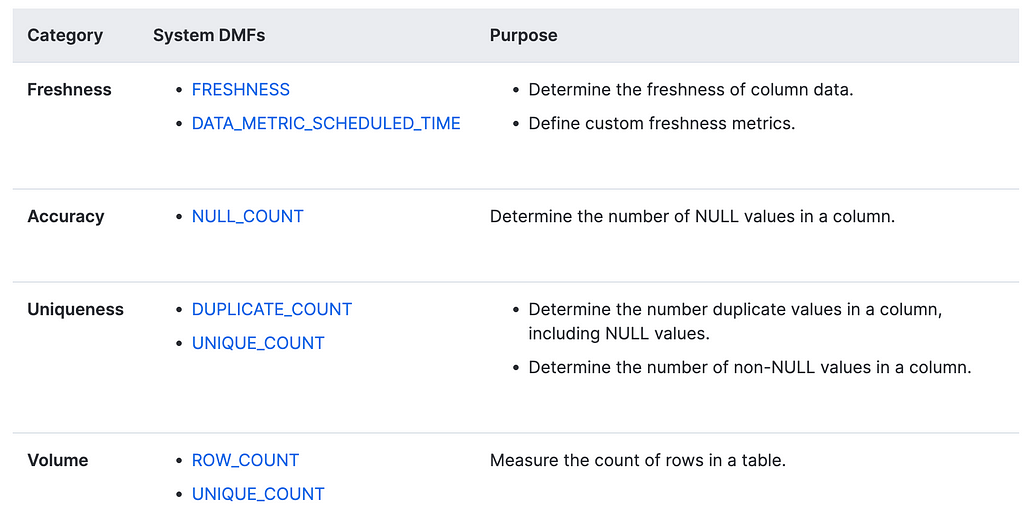
Many analytical warehouses already have inbuilt functionalities around this. For example, Snowflake has recently pushed out Data Metric Functions in preview for Enterprise accounts to help data teams get started quickly.
Data Metrics Functions is a wrapper around some of the queries we might write to get insights into our data systems. We can start with the system DMFs.
Snowflake System DMF
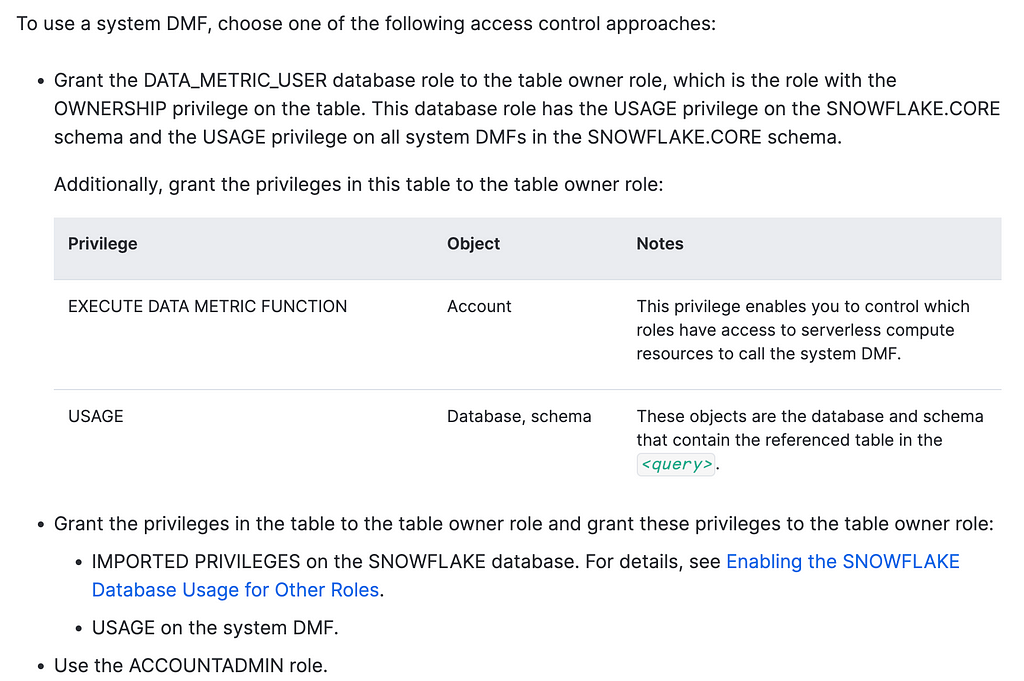
We first need to sort out a few privileges…
DMF Access Control Docs
USE ROLE ACCOUNTADMIN;

GRANT database role DATA_METRIC_USER TO role jess_zhang;

GRANT EXECUTE data metric FUNCTION ON account TO role jess_zhang;

## Useful queries once the above succeeds
SHOW DATA METRIC FUNCTIONS IN ACCOUNT;
DESC FUNCTION snowflake.core.NULL_COUNT(TABLE(VARCHAR));
DATA_METRIC_USER is a database role which may catch a few people out. It’s important to revisit the docs if you’re running into issues. The most likely reason is probably due to permissions.
Then, simply choose a DMF …
-- Uniqueness
SELECT SNOWFLAKE.CORE.NULL_COUNT(
  SELECT customer_id
  FROM jzhang_test.product.fct_subscriptions
);
-- Freshness
SELECT SNOWFLAKE.CORE.FRESHNESS(
  SELECT
    _loaded_at_utc
  FROM jzhang_test.product.fct_subscriptions
) < 60;
-- replace 60 with your calculated threshold value
You can schedule your DMFs to run using Data Metric Schedule — an object parameter or your usual orchestration tool. The hard-work would still need to be done to determine your own thresholds in order to set the right SLOs for your pipelines.
In Summary…
Data teams need to engage with stakeholders to set better expectations about the data by using service level indicators and objectives. Introducing these metrics will help data teams move from reactively firefighting to a more proactive approach in preventing data incidents. This would allow energy to be refocused towards delivering business value as well as building a trusted data platform.
Unless otherwise noted, all images are by the author.
Organizations are facing ever-increasing requirements for sustainability goals alongside environmental, social, and governance (ESG) practices. A Gartner, Inc. survey revealed that 87 percent of business leaders expect to increase their organization’s investment in sustainability over the next years. This post serves as a starting point for any executive seeking to navigate the intersection of generative […]
Google Chrome’s potential integration of Gemini, its flagship AI model, promises smarter password suggestions but raises concerns about security vulnerabilities.
We use cookies on our website to give you the most relevant experience by remembering your preferences and repeat visits. By clicking “Accept”, you consent to the use of ALL the cookies.
This website uses cookies to improve your experience while you navigate through the website. Out of these, the cookies that are categorized as necessary are stored on your browser as they are essential for the working of basic functionalities of the website. We also use third-party cookies that help us analyze and understand how you use this website. These cookies will be stored in your browser only with your consent. You also have the option to opt-out of these cookies. But opting out of some of these cookies may affect your browsing experience.
Necessary cookies are absolutely essential for the website to function properly. These cookies ensure basic functionalities and security features of the website, anonymously.
Cookie
Duration
Description
cookielawinfo-checkbox-analytics
11 months
This cookie is set by GDPR Cookie Consent plugin. The cookie is used to store the user consent for the cookies in the category "Analytics".
cookielawinfo-checkbox-functional
11 months
The cookie is set by GDPR cookie consent to record the user consent for the cookies in the category "Functional".
cookielawinfo-checkbox-necessary
11 months
This cookie is set by GDPR Cookie Consent plugin. The cookies is used to store the user consent for the cookies in the category "Necessary".
cookielawinfo-checkbox-others
11 months
This cookie is set by GDPR Cookie Consent plugin. The cookie is used to store the user consent for the cookies in the category "Other.
cookielawinfo-checkbox-performance
11 months
This cookie is set by GDPR Cookie Consent plugin. The cookie is used to store the user consent for the cookies in the category "Performance".
viewed_cookie_policy
11 months
The cookie is set by the GDPR Cookie Consent plugin and is used to store whether or not user has consented to the use of cookies. It does not store any personal data.
Functional cookies help to perform certain functionalities like sharing the content of the website on social media platforms, collect feedbacks, and other third-party features.
Performance cookies are used to understand and analyze the key performance indexes of the website which helps in delivering a better user experience for the visitors.
Analytical cookies are used to understand how visitors interact with the website. These cookies help provide information on metrics the number of visitors, bounce rate, traffic source, etc.
Advertisement cookies are used to provide visitors with relevant ads and marketing campaigns. These cookies track visitors across websites and collect information to provide customized ads.