YouTube has hit a new milestone with its Music and Premium offerings. The paid services have more than 100 million users between them as of January, including those who were on a free trial. That’s an increase of 20 million members in just over a year, and the figure has doubled since September 2021. YouTube has successfully grown the figures despite a $2 per month increase for Premium that came into force last summer.
It’s unclear how many people are actually using YouTube Music (Premium includes access to that service). However you slice it, the music streaming service has significantly fewer paid users than Spotify, which had 220 million Premium members as of September 30. Spotify will reveal its latest membership numbers in an earnings report next week. Apple no longer breaks out its number of Apple Music subscribers. The last firm number the company gave for the service was 60 million subscribers back in 2019.
Regardless, the comparison between YouTube’s paid service and Apple Music and Spotify Premium is hardly like-for-like. YouTube Premium is its own thing with its own benefits. It can be tough to go back to the lousier ad-strewn free version of the service after having Premium. The option to download videos for offline viewing without having to resort to workarounds and background playback feature are both very useful. YouTube Music is just an extra perk on top of that for many members.
This article originally appeared on Engadget at https://www.engadget.com/youtubes-paid-music-and-premium-services-now-have-more-than-100-million-subscribers-210008040.html?src=rss
Amazon launched a new generative AI shopping assistant, Rufus, on Thursday. The chatbot is trained on Amazon’s product catalog, customer reviews, community Q&As and “information from across the web.” It’s only available to a limited set of Amazon customers for now but will expand in the coming weeks.
The company views the assistant as customers’ one-stop shop for all their shopping needs. Rufus can answer questions like, “What to consider when buying running shoes?” and display comparisons for things such as, “What are the differences between trail and road running shoes?” It can also respond to follow-up questions like, “Are these durable?”
Amazon suggests asking Rufus for general advice about product categories, such as things to look for when shopping for headphones. It can provide contextual advice as well, lending insight into products based on specific activities (like hiking) or events (holidays or celebrations). Other examples include asking it to compare product categories (“What’s the difference between lip gloss and lip oil?” or “Compare drip to pour-over coffee makers”). In addition, it can recommend gifts for people with particular tastes or shopping recommendations for holidays.
Rufus can also answer more fine-tuned questions about a specific product page you’re viewing. Amazon provides the examples, “Is this pickleball paddle good for beginners?” or “Is this jacket machine-washable?”
“It’s still early days for generative AI, and the technology won’t always get it exactly right,” wrote Amazon executive Rajiv Mehta. “We will keep improving our AI models and fine-tune responses to continuously make Rufus more helpful over time. Customers are encouraged to leave feedback by rating their answers with a thumbs up or thumbs down, and they have the option to provide freeform feedback as well.”
Rufus is launching in beta today to only “a small subset of customers,” and it will appear (for those in the beta) after updating the Amazon mobile app. The assistant will continue rolling out to US customers “in the coming weeks.” Once you’re allowed into the beta, you can summon Rufus by typing or speaking your questions into the search bar. A Rufus chat box will appear at the bottom of the screen.
This article originally appeared on Engadget at https://www.engadget.com/amazon-launches-rufus-an-ai-powered-shopping-assistant-204811837.html?src=rss
If you’ve considered splurging on a premium monitor, Samsung has some deals worth investigating. The company’s offerings, including the 55-inch Odyssey Ark (available for a record-low $2,000), 57-inch Odyssey Neo G9 ($500 off) and 49-inch Odyssey OLED G9 ($400 off) are among the models discounted in a wide-ranging monitor sale on Amazon and Samsung’s website.
The 55-inch Odyssey Ark is a 4K behemoth with a 1000R curvature to ensure all sides of the screen face you at a roughly equal distance. It supports 165Hz refresh rates, making for fairly smooth gaming and other tasks, and it has a 1ms response time. You can even rotate its screen into portrait orientation, although that’s more of a niche bonus than an essential feature for most people.
Samsung fixed one of our biggest gripes about the first-generation version, adding the DisplayPort compatibility and multi-input split view that were perplexingly missing from that inaugural model. The one on sale is the latest variant, launched in 2023.
Usually $3,000, you can cut that in third on Amazon and Samsung, taking the 55-inch Odyssey Ark home for $2,000.
Samsung
The 57-inch Odyssey G9 Neo has a more elongated (32:9) aspect ratio. This lets you squeeze more apps onto your desktop multitasking setup while supplying a wider field of view for gaming. Despite its different size and shape, it has the same tight 1000R curve as the Ark.
The monitor has 8K resolution, a 240Hz refresh rate and 1ms response time. Its mini LED technology uses 2,392 local dimming zones and “the highest 12-bit black levels.” Ports include DisplayPort 2.1, HDMI 2.1 and a USB hub.
Usually $2,500, you can shave $500 off the 57-inch Neo G9 monitor, taking it home for $2,000. That pricing is available on Amazon and Samsung.
Samsung
The 49-inch Odyssey G9 OLED also has a 32:9 aspect ratio. Its OLED / Quantum Dot screen produces rich colors and deep blacks to make your games pop more, and its solid-black text can help your workspace lettering jump out more.
This model’s curve (1800R) is less pronounced than the 55-inch Ark and 57-inch G9 Neo’s, but it still supplies a gentle curve inward. It includes built-in speakers, and it has a 240Hz refresh rate with a “near-instant” (0.03ms) response time. It includes connections for HDMI 2.1 and DisplayPort.
The 49-inch G9 OLED retails for $1,600, but you can get it for $1,200 on Amazon. (It’s $1,300 on Samsung’s site.)
We only highlighted some of the standout monitors, but you can browse through the full sale on Amazon and Samsung.
Apple has made spatial video capture and playback a key selling point of its headset, but it won’t be the only device in town that can handle stereoscopic videos. Meta Quest virtual reality headsets are getting spatial video playback capabilities, perfectly timed to coincide with tomorrow’s Apple Vision Pro launch.
You can upload spatial videos via the Meta Quest mobile app directly from your iPhone, but you’ll need an iPhone 15 Pro or iPhone 15 Pro Max to make the videos. The content will be stored in the cloud, and not the headset, to preserve all-important hard drive space. Once uploaded, you’ll be able to relive precious memories over and over again, as the increased depth that spatial videos provide is pretty engrossing.
Meta has made several demo videos available for users so you can see what all the fuss is about. This feature is not exclusive to the recently-released Meta Quest 3. You’ll be able to view spatial videos via the Meta Quest 2 and Meta Quest Pro. As usual, the OG Meta Quest is left out in the cold. It’s worth noting that the Viture One and One Lite XR glasses can also play spatial videos.
The video viewer is part of a larger system update that brings several other upgrades to Quest users. The headset’s web browser will now be able to play web-based games, with support for external gamepads. Additionally, Facebook live streaming is now available for everyone, after a limited rollout. Finally, there are some new single-gesture quick actions. You can, for instance, mute the microphone or take a photo just by looking down at your wrist and performing a short pinch. Hey, wait a minute. That also sounds suspiciously like Apple Vision Pro’s control scheme. Shots fired.
This article originally appeared on Engadget at https://www.engadget.com/meta-quest-headsets-get-spatial-video-playback-just-in-time-for-the-apple-vision-pro-launch-193821840.html?src=rss
The SEC’s civil lawsuit against Barry Silbert-backed Genesis has ended in a mutual settlement amid bankruptcy proceedings for the defunct crypto service provider.
Residents of Granbury, Texas, are facing unprecedented disturbances, health issues, and environmental crises due to a local Bitcoin mining operation, as reported by TIME.
The United States, through the Energy Information Administration (EIA), will start collecting data about cryptocurrency miners’ energy consumption rate within the nation starting next week. On Jan. 31, the EIA revealed its intention to initiate a provisional survey targeting commercial cryptocurrency miners. This survey was authorized by the Office of Management and Budget (OMB) as […]
A Quantitatively Accurate and Clinically Useful Generative Medical Imaging Model
3D body surface scan point cloud and matching dual energy X-ray absorptiometry (DXA) scan (Image by Author)
Key Points
To our knowledge, this is the first quantitatively accurate model in which generated medical imaging can be analyzed with commercial clinical software.
Being able to predict interior distributions of fat, muscle, and bone from exterior shape, indicates the strong relationship between body composition and body shape
This model represents a significant step towards accessible health monitoring, producing images that would normally require specialized, expensive equipment, trained technicians, and involve exposure to potentially harmful ionizing radiation.
Generative artificial intelligence (AI) has become astonishingly popular especially after the release of both diffusion models like DALL-E and large language models (LLM) like ChatGPT. In general, AI models are classified as “generative” when the model produces something as an output. For DALL-E the product output is a high-quality image while for ChatGPT the product or output is highly structured meaningful text. These generative models are different than classification models that output a prediction for one side of a decision boundary such as cancer or no cancer and these are also different from regression models that output numerical predictions such as blood glucose level. Medical imaging and healthcare have benefited from AI in general and several compelling use cases and generative models are constantly being developed. A major barrier to clinical use of generative AI models is a lack of validation of model outputs beyond just image quality assessments. In our work, we evaluate our generative model on both a qualitative and quantitative assessment as a step towards more clinically relevant AI models.
Quality vs Quantity
In medical imaging, image quality is crucial; it’s all about how well the image represents the internal structures of the body. The majority of the use cases for medical imaging is predicated on having images of high quality. For instance, X-ray scans use ionizing radiation to produce images of many internal structures of the body and quality is important for identifying bone from soft tissue or organs as well as identifying anomalies like tumors. High quality X-ray images result in easier to identify structures which can translate to more accurate diagnosis. Computer vision research has led to the development of metrics meant to objectively measure image quality. These metrics, which we use in our work, include peak signal to noise ratio (PSNR) and structural similarity index (SSIM), for example. Ultimately, a high-quality image can be defined as having sharp, well defined borders, with good contrast between different anatomical structures.
Images are highly structured data types and made up of a matrix of pixels of varying intensities. Unlike natural images as seen in the ImageNet dataset consisting of cars, planes, boats, and etc. which have three red, green, and blue color channels, medical images are mostly gray scale or a single channel. Simply put, sharp edges are achieved by having pixels near the borders of structures be uniform and good contrast is achieved when neighboring pixels depicting different structures have a noticeable difference in value from one another. It is important to note that the absolute value of the pixels are not the most important thing for high quality images and it is in fact more dependent on the relative pixel intensities to each other. This, however, is not the case for achieving images with high quantitative accuracy.
Demonstrating the difference between quality and quantity. Both images look the same and are of good quality but the one on the right gives the right biological measurements of bone, muscle, and fat. (Image by Author)
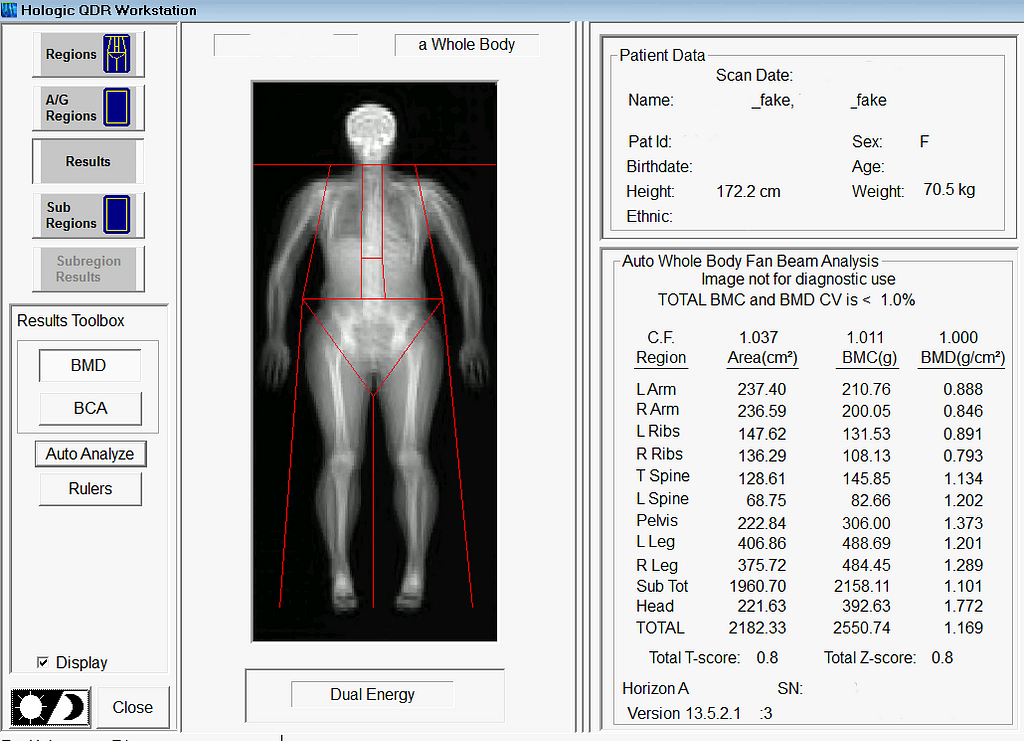
A subset of medical imaging modalities is quantitative meaning the pixel values represent a known quantity of some material or tissue. Dual energy X-ray Absorptiometry (DXA) is a well known and common quantitative imaging modality used for measuring body composition. DXA images are acquired using high and low energy X-rays. Then a set of equations sometimes refered to as DXA math is used to compute the contrast and ratios between the high and low energy X-ray images to yield quantities of fat, muscle, and bone. Hence the word quantitative. The absolute value of each pixel is important because it ultimately corresponds to a known quantity of some material. Any small changes in the pixel values, while it may still look of the same or similar quality, will result in noticeably different tissue quantities.
Example of commercial software that is used clinically to measure body composition. In this example, we are demonstrating the ability to load and analyze our Pseudo-DXA generated image. (Image by Author)
Generative AI in Medical Imaging
As previously mentioned, generative AI models for medical imaging are at the forefront of development. Known examples of generative medical models include models for artifact removal from CT images or the production of higher quality CT images from low dose modalities where image quality is known to be lesser in quality. However, prior to our study, generative models creating quantitatively accurate medical images were largely unexplored. Quantitative accuracy is arguably more difficult for generative models to achieve than producing an image of high quality. Anatomical structures not only have to be in the right place, but the pixels representing their location needs to be near perfect as well. When considering the difficulty of achieving quantitative accuracy one must also consider the bit depth of raw medical images. The raw formats of some medical imaging modalities, DXA included, encode information in 12 or 14 bit which is magnitudes more than standard 8-bit images. High bit depths equate to a bigger search space which could equate to it being more difficult to get the exact pixel value. We are able to achieve quantitative accuracy through self-supervised learning methods with a custom physics or DXA informed loss function described in this work here. Stay tuned for a deep dive into that work to come in the near future.
What We Did
We developed a model that can predict your insides from your outsides. In other words, our model innovatively predicts internal body composition from external body scans, specifically transforming three-dimensional (3D) body surface scans into fully analyzable DXA scans. Utilizing increasingly common 3D body scanning technologies, which employ optical cameras or lasers, our model bypasses the need for ionizing radiation. 3D scanning enables accurate capture of one’s exterior body shape and the technology has several health relevant use cases. Our model outputs a fully analyzable DXA scan which means that existing commercial software can be used to derive body composition or measures of adipose tissue (fat), lean tissue (muscle), and bone. To ensure accurate body composition measurements, our model was designed to achieve both qualitative and quantitative precision, a capability we have successfully demonstrated.
Inspiration and Motivation
The genesis of this project was motivated by the hypothesis that your body shape or exterior phenotype is determined by the underlying distribution of fat, muscle, and bone. We had previously conducted several studies demonstrating the associations of body shape to measured quantities of muscle, fat, and bone as well as to health outcomes such as metabolic syndrome. Using principal components analysis (PCA), through shape and appearance modeling, and linear regression, a student in our lab showed the ability to predict body composition images from 3D body scans. While this was impressive and further strengthened the notion of the relationship between shape and composition, these predicted images excluded the forelimbs (elbow to hand and knee to feet) and the images were not in a format (raw DXA format) which enabled analysis with clinical software. Our work fully extends and overcomes previous limitations. The Pseudo-DXA model, as we call it, is able to generate the full whole body DXA image from 3D body scan inputs which can be analyzed from using clinical and commercial software.
Very early proof-of-concept 3D to DXA image translation which sparked this whole project. (Image by Author)
Our Training Data
The cornerstone of the Pseudo-DXA model’s development was a unique dataset comprising paired 3D body and DXA scans, obtained simultaneously. Such paired datasets are uncommon, due to the logistical and financial challenges in scanning large patient groups with both modalities. We worked with a modest but significant sample size: several hundred paired scans. To overcome the data scarcity issue, we utilized an additional, extensive DXA dataset with over 20,000 scans for model pretraining.
Building the Model
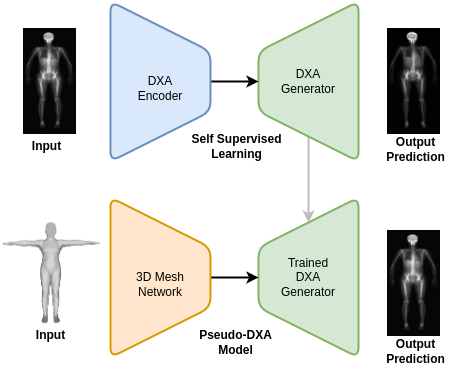
The Pseudo-DXA model was built in two steps. The first self-supervised learning (SSL) or pretraining step involved training a variational auto encoder (VAE) to encode and decode or regenerate raw DXA scan. A large DXA data set, which is independent of the data set used in the final model and evaluation of our model, was used to SSL pretrain our model and it was divided to contain an separate hold out test set. Once the VAE model was able to accurately regenerate the original raw DXA image as validated with the holdout test set, we moved to the second phase of training.
In brief, VAE models consist of two main subnetwork components which include the encoder and the decoder, also known as a generator. The encoder is tasked with taking the high dimensional raw DXA image data and learning a meaningful compressed representation which is encoded into what is known as a latent space. The decoder or generator takes the latent space representation and learns to regenerate the original image from the compressed representation. We used the trained generator from our SSL DXA training as the base of our final Pseudo-DXA model.
Model architecture diagram with the first self-supervised learning phase at the top and the Pseudo-DXA training phase at the bottom. (Image by Author)
The structure of the 3D body scan data consisted of a series of vertices or points and faces which indicate which points are connected to one another. We used a model architecture resembling the Pointnet++ model which has demonstrated the ability to handle point cloud data well. The Pointnet++ model was then attached to the generator we had previously trained. We then fed the mode the 3D data and it was tasked with learning generate the corresponding DXA scan.
Pseudo-DXA Results
In alignment with machine learning best practices, we divided our data such that we had an unseen holdout test for which we reported all our results on.
Image quality
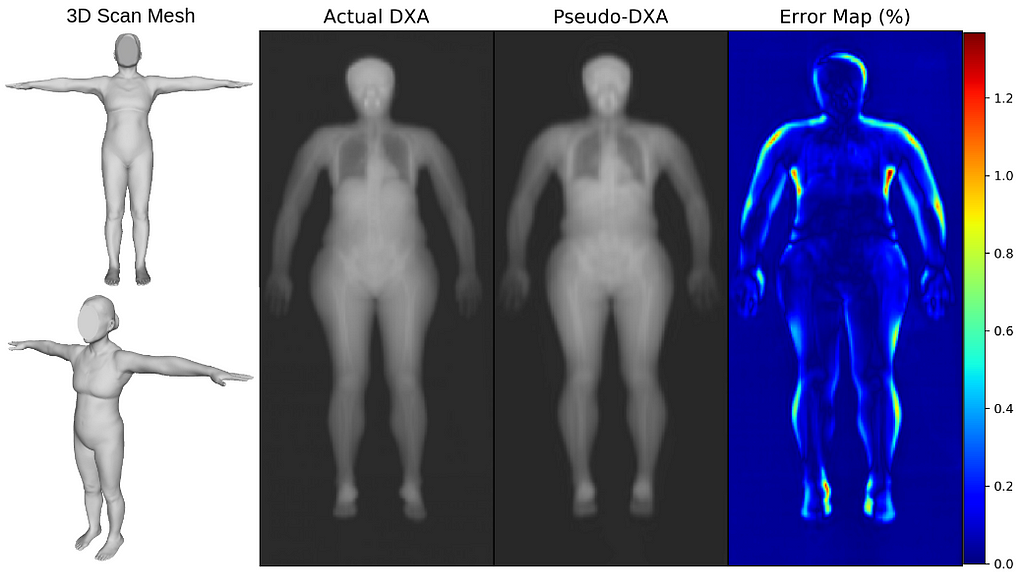
We first evaluated our Pseudo-DXA images using image quality metrics which include normalized mean absolute error (NMAE), peak signal to noise ratio (PSNR), and structural similarity index (SSIM). Our model generated images had mean NMAE, PSNR, and SSIM of 0.15, 38.15, and 0.97, respectively, which is considered to be good with respect to quality. Shown below is an example of a 3D scan, the actual DXA low energy scan, Pseudo-DXA low energy scan and the percent error map of the two DXA scans. As mentioned DXA images have two image channels for high and low energies yet, these examples are just showing the low energy image. Long story short, the Pseudo-DXA model can generate high quality images on par with other medical imaging models with respect to the image quality metrics used.
3D scan from the test set, their actual DXA scan, the Pseudo-DXA scan, and error map comparing the actual to the Pseudo-DXA. (Image by Author)
Quantitative Accuracy
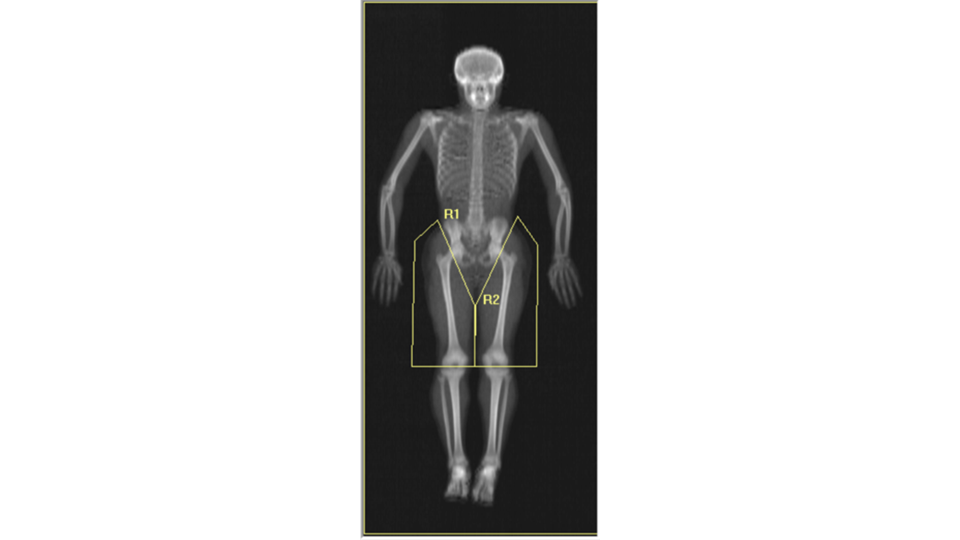
When we analyzed our Pseudo-DXA images for composition and compare the quantities to the actual quantities we achieved coefficients of determination (R²) of 0.72, 0.90, 0.74, and 0.99 for fat, lean, bone, and total mass, respectively. An R²of 1 is desired and our values were reasonably close considering the difficulty of the task. A comment we encountered when presenting our preliminary findings at conferences was “wouldn’t it be easier to simply train a model to predict each measured composition value from the 3D scan so the model would for example, output a quantity of fat and bone and etc., rather than a whole image”. The short answer to the question is yes, however, that model would not be as powerful and useful as the Pseudo-DXA model that we are presenting here. Predicting a whole image demonstrates the strong relationship between shape and composition. Additionally, having a whole image allows for secondary analysis without having to retrain a model. We demonstrate the power of this by performing ad-hoc body composition analysis on two user defined leg subregions. If we had trained a model to just output scalar composition values and not an image, we would only be able to analysis these ad-hoc user defined regions by retraining a whole new model for these measures.
Example of secondary analysis with user defined subregions of the leg labeled R1 and R2. (Image by Author)
Long story short, the Pseudo-DXA model produced high quality images that were quantitatively accurate, from which software could measure real amounts of fat, muscle, and bone.
So What Does This All Mean?
The Pseudo-DXA model marks a pivotal step towards a new standard of striving for quantitative accuracy when necessary. The bar for good generative medical imaging models was high image quality yet, as we discussed, good quality may simply not be enough given the task. If the clinical task or outcome requires something to be measured from the image beyond morphology or anthropometry, then quantitative accuracy should be assessed.
Our Pseudo-DXA model is also a step in the direction of making health assessment more accessible. 3D scanning is now in phones and does not expose individuals to harmful ionizing radiation. In theory, one could get a 3D scan of themselves, run in through our models, and receive a DXA image from which they can obtain quantities of body composition. We acknowledge that our model generates statistically likely images and it is not able to predict pathologies such as tumors, fractures, or implants, which are statistically unlikely in the context of a healthy population from which this model was built. Our model also demonstrated great test-retest precision which means it has the ability to monitor change over time. So, individuals can scan themselves every day without the risk of radiation and the model is robust enough to show changes in composition, if any.
We invite you to engage with this groundbreaking technology and/or provided an example of a quantitatively accurate generative medical imaging model. Share your thoughts, ask questions, or discuss potential applications in the comments. Your insights are valuable to us as we continue to innovate in the field of medical imaging and AI. Join the conversation and be part of this exciting journey!
We use cookies on our website to give you the most relevant experience by remembering your preferences and repeat visits. By clicking “Accept”, you consent to the use of ALL the cookies.
This website uses cookies to improve your experience while you navigate through the website. Out of these, the cookies that are categorized as necessary are stored on your browser as they are essential for the working of basic functionalities of the website. We also use third-party cookies that help us analyze and understand how you use this website. These cookies will be stored in your browser only with your consent. You also have the option to opt-out of these cookies. But opting out of some of these cookies may affect your browsing experience.
Necessary cookies are absolutely essential for the website to function properly. These cookies ensure basic functionalities and security features of the website, anonymously.
Cookie
Duration
Description
cookielawinfo-checkbox-analytics
11 months
This cookie is set by GDPR Cookie Consent plugin. The cookie is used to store the user consent for the cookies in the category "Analytics".
cookielawinfo-checkbox-functional
11 months
The cookie is set by GDPR cookie consent to record the user consent for the cookies in the category "Functional".
cookielawinfo-checkbox-necessary
11 months
This cookie is set by GDPR Cookie Consent plugin. The cookies is used to store the user consent for the cookies in the category "Necessary".
cookielawinfo-checkbox-others
11 months
This cookie is set by GDPR Cookie Consent plugin. The cookie is used to store the user consent for the cookies in the category "Other.
cookielawinfo-checkbox-performance
11 months
This cookie is set by GDPR Cookie Consent plugin. The cookie is used to store the user consent for the cookies in the category "Performance".
viewed_cookie_policy
11 months
The cookie is set by the GDPR Cookie Consent plugin and is used to store whether or not user has consented to the use of cookies. It does not store any personal data.
Functional cookies help to perform certain functionalities like sharing the content of the website on social media platforms, collect feedbacks, and other third-party features.
Performance cookies are used to understand and analyze the key performance indexes of the website which helps in delivering a better user experience for the visitors.
Analytical cookies are used to understand how visitors interact with the website. These cookies help provide information on metrics the number of visitors, bounce rate, traffic source, etc.
Advertisement cookies are used to provide visitors with relevant ads and marketing campaigns. These cookies track visitors across websites and collect information to provide customized ads.