Bitcoin was a pacesetter as the U.S. dominated inflows to crypto-based products between Feb. 12 and Feb. 16, with 2024 YTD numbers hitting $5.2 billion.
In a strategic move ahead of the upcoming general elections, South Korea’s ruling party, the People Power Party (PPP), has announced plans to push for a further two-year delay in the implementation of crypto taxation, local media reported Feb. 19. Party officials announced the intention to explore the delay as a key campaign promise during […]
Visualizing Complex-Valued Functions in Python and Mathematica
Unlocking visual insights into a difficult but powerful branch of math
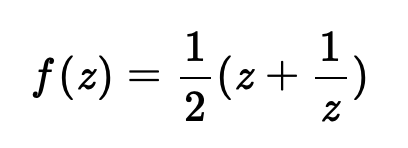
Today I was pouring through Complex Variables and Analytic Functions by the esteemed Fornberg and Piret, trying my best to wrap my mind around how complex-valued functions behave. Mentally vizualization such functions is extra difficult since they take a real and an imaginary input, and outputs two components as well. Therefore, a single 3-D plot is not sufficient to see how the function behaves. Rather, we have to split such a visualization into separate plots of the imaginary and real parts, or alternatively by magnitude and argument, or angle.
I wanted to be able to play around with any function I could think of, drag and zoom around its plots, and explore it in visual detail to understand how it resulted from the equation. For such a task, Wolfram Mathematica is an excellent starting tool.
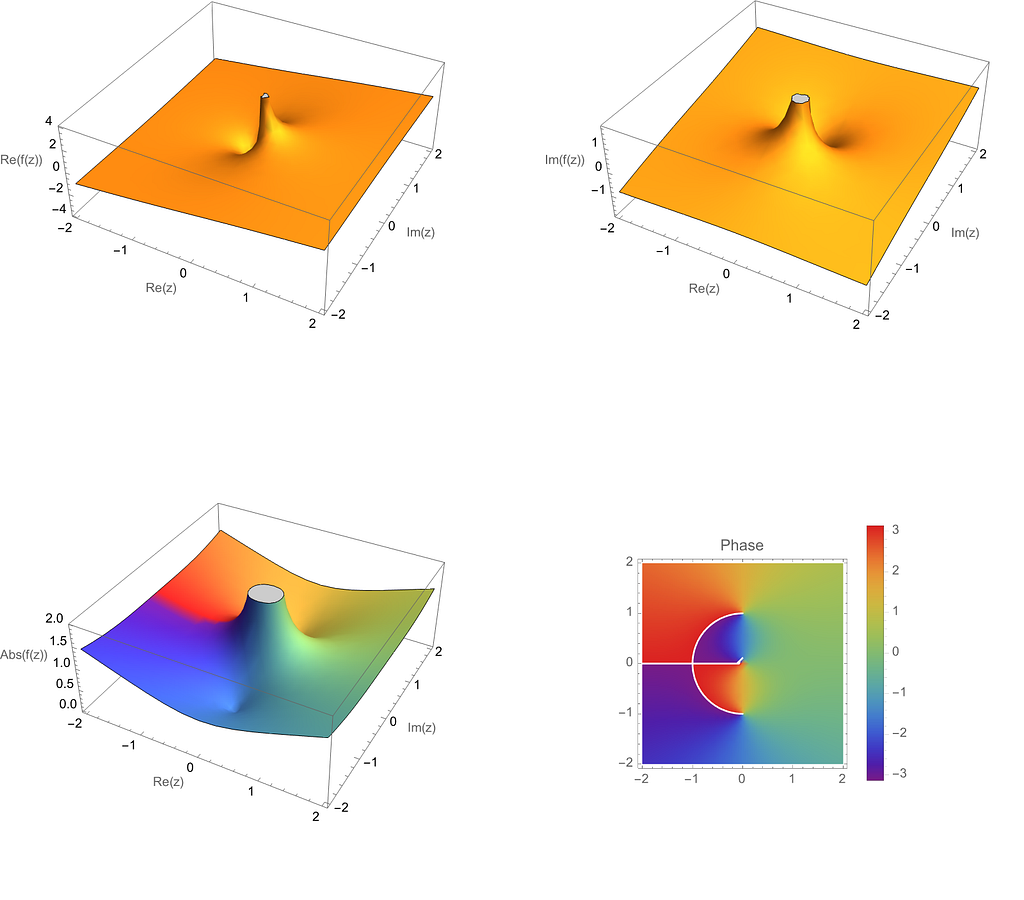
I wrote the above Mathematica code to produce a grid of plots showing the function in both ways just described. On the top, the imaginary and real parts of the function
are shown, and on the bottom, and the magnitude, and the phase shown in color:
Component-Wise and Magnitude-Phase Plots of f(z) from Wolfram
After playing around with a few functions using this code and convincing myself they made sense, I was interested in getting the same functionality in Python, to connect it to my other mathematical programming projects.
Python, PyPlot and complex-plotting-tools
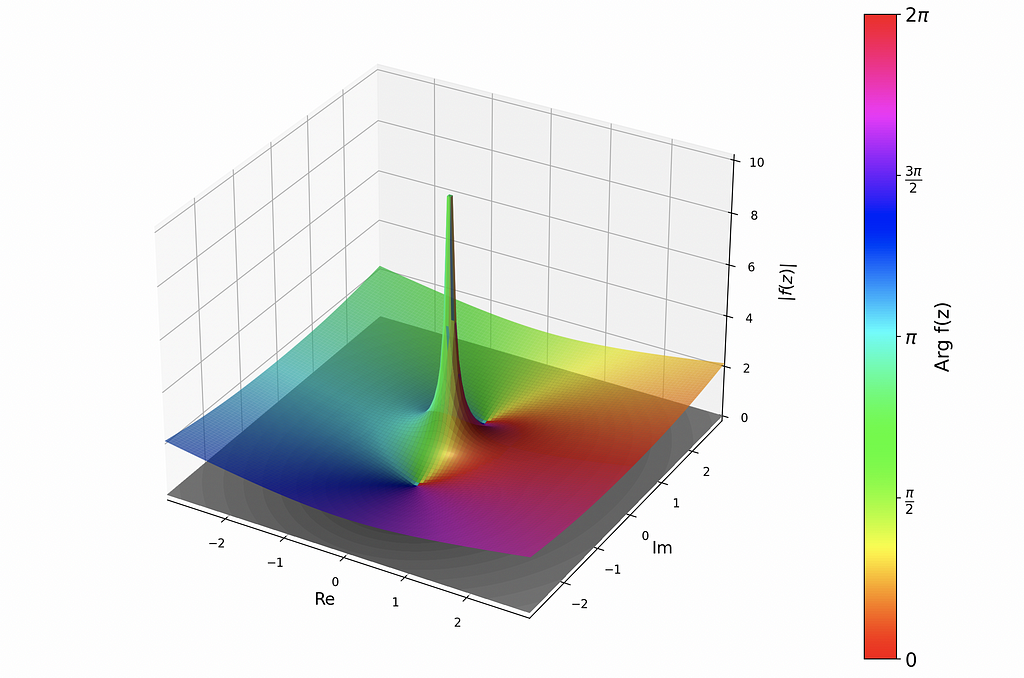
I found an excellent project on GitHub (https://github.com/artmenlope/complex-plotting-tools) which I decided to use as a starting point, and potentially contribute to in the future. The repo provided a very easy interface for plotting complex-valued functions in a variety of ways. Thanks https://github.com/artmenlope! For example, after importing numpy, matplotlib, and the repo’s cplotting_tools module defining the function and calling cplt.complex_plot3D(x,y,f,log_mode=False) produces the following:
Magnitude and Phase Plot of f(z) from complex-plotting-tools
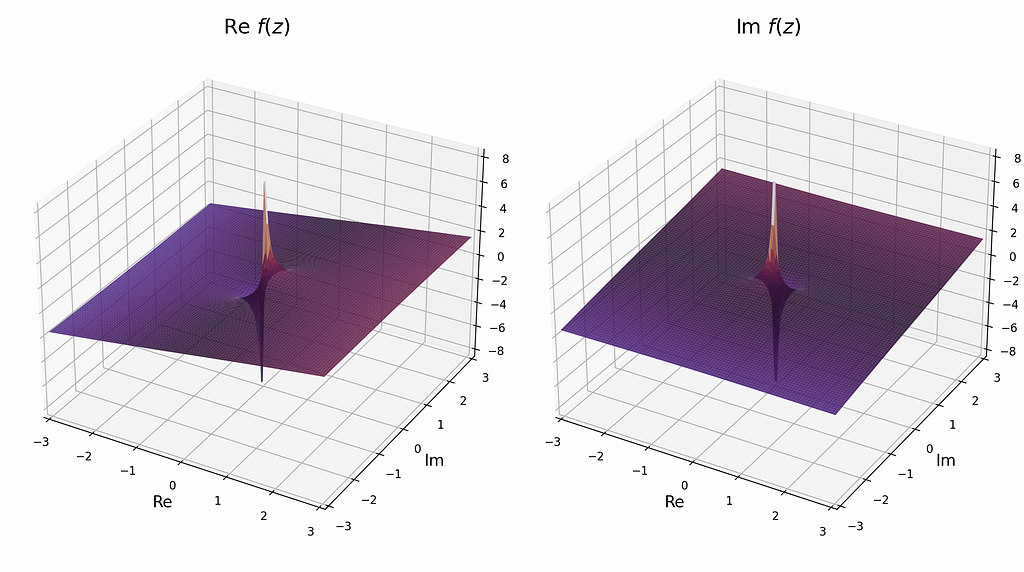
These are all for the same f(z) as above. To view the side-by-side imaginary and real parts of the function, use cplot.plot_re_im(x,y,f,camp=”twilight”,contour=False,alpha=0.9:
Component-Wise Plots from complex-plotting-tools
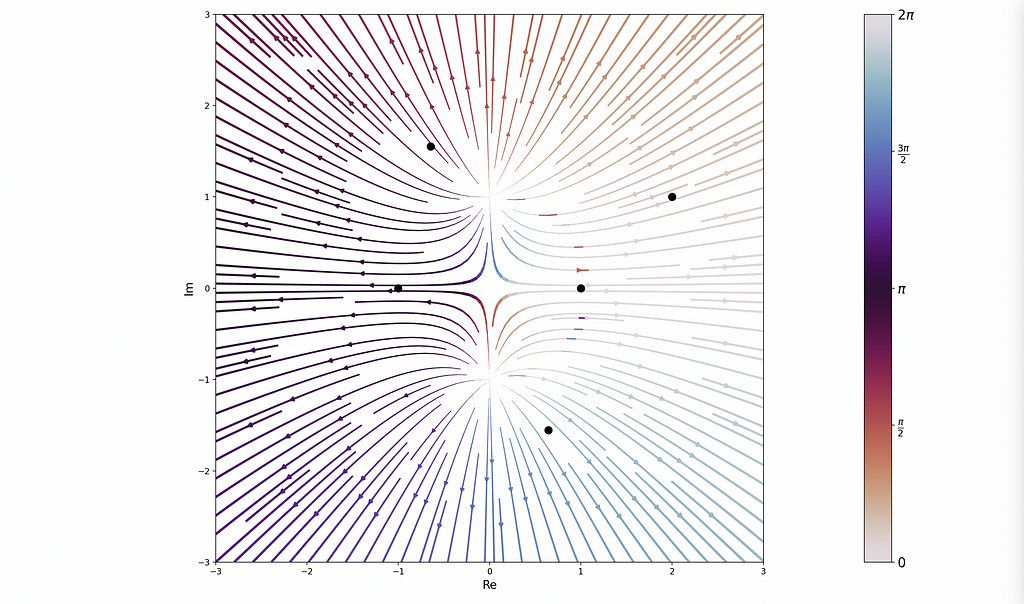
Additionally, the library provides other cool ways to study functions, including a stream plot:
Stream Plot of f(z) from complex-plotting-tools
Future Direction
The library shows a lot of promise and is relatively easy to use! It does require a pts variable to be defined that encodes the poles and zeros of the given function. Wolfram does not require this because it computes the locations of these points under the hood. It would save a lot of effort for the user if complex-plotting-tools had this functionality as well. I plan to implement this is into the module in the near future.
In the meantime, have fun plotting with Wolfram and Python, and share your thoughts and questions in comments below, connect with me on LinkedIn or collaborate with me on GitHub!
Unless otherwise noted, all images were created by the author.
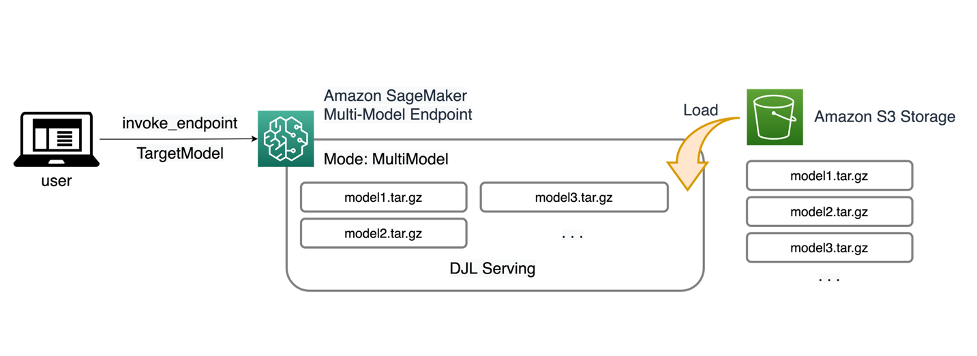
Amazon SageMaker multi-model endpoints (MMEs) are a fully managed capability of SageMaker inference that allows you to deploy thousands of models on a single endpoint. Previously, MMEs pre-determinedly allocated CPU computing power to models statically regardless the model traffic load, using Multi Model Server (MMS) as its model server. In this post, we discuss a […]
Amazon Bedrock provides a broad range of high-performing foundation models from Amazon and other leading AI companies, including Anthropic, AI21, Meta, Cohere, and Stability AI, and covers a wide range of use cases, including text and image generation, searching, chat, reasoning and acting agents, and more. The new Amazon Titan Image Generator model allows content […]
Apple’s Beats has become the official consumer audio products partner of MLS, with the personal audio company producing exclusive custom Beats headphones for eight teams.
Custom MLS-branded Beats headphones
The global agreement, announced on Monday, is a multi-year agreement that will see Beats provide custom versions of Beats headphones created specifically for the teams.
Eight teams have been selected for the custom headphone treatment in 2024, including Atlanta United, Columbus Crew, Inter Miami, LAFC, Nashville SC, NYCFC, St. Louis City SC, and Toronto FC. Others will be added to the roster in the future.
To celebrate the debut of her newest album, Jennifer Lopez is giving an exclusive Apple Music Live performance on February 21.
Image Credit: Apple Music
On February 16, Jenifer Lopez — also known as J Lo — released her ninth studio album, titled “This is Me… Now.” The album is a spiritual sequel to her 2002 album “This is Me… Then.”
Lopez, known for hits like “I’m Real” and “Love Don’t Cost A Thing,” has partnered with Apple Music to offer an exclusive performance to celebrate the release of the new album. The performance, which will take place on February 21 at 7:00 PM PT / 10:00 PM ET, was announced on Monday on social media platform X.
We use cookies on our website to give you the most relevant experience by remembering your preferences and repeat visits. By clicking “Accept”, you consent to the use of ALL the cookies.
This website uses cookies to improve your experience while you navigate through the website. Out of these, the cookies that are categorized as necessary are stored on your browser as they are essential for the working of basic functionalities of the website. We also use third-party cookies that help us analyze and understand how you use this website. These cookies will be stored in your browser only with your consent. You also have the option to opt-out of these cookies. But opting out of some of these cookies may affect your browsing experience.
Necessary cookies are absolutely essential for the website to function properly. These cookies ensure basic functionalities and security features of the website, anonymously.
Cookie
Duration
Description
cookielawinfo-checkbox-analytics
11 months
This cookie is set by GDPR Cookie Consent plugin. The cookie is used to store the user consent for the cookies in the category "Analytics".
cookielawinfo-checkbox-functional
11 months
The cookie is set by GDPR cookie consent to record the user consent for the cookies in the category "Functional".
cookielawinfo-checkbox-necessary
11 months
This cookie is set by GDPR Cookie Consent plugin. The cookies is used to store the user consent for the cookies in the category "Necessary".
cookielawinfo-checkbox-others
11 months
This cookie is set by GDPR Cookie Consent plugin. The cookie is used to store the user consent for the cookies in the category "Other.
cookielawinfo-checkbox-performance
11 months
This cookie is set by GDPR Cookie Consent plugin. The cookie is used to store the user consent for the cookies in the category "Performance".
viewed_cookie_policy
11 months
The cookie is set by the GDPR Cookie Consent plugin and is used to store whether or not user has consented to the use of cookies. It does not store any personal data.
Functional cookies help to perform certain functionalities like sharing the content of the website on social media platforms, collect feedbacks, and other third-party features.
Performance cookies are used to understand and analyze the key performance indexes of the website which helps in delivering a better user experience for the visitors.
Analytical cookies are used to understand how visitors interact with the website. These cookies help provide information on metrics the number of visitors, bounce rate, traffic source, etc.
Advertisement cookies are used to provide visitors with relevant ads and marketing campaigns. These cookies track visitors across websites and collect information to provide customized ads.